1123
Analysis of time varying energy period profiles using Hilbert Huang Transform in resting state fMRI for Alzheimer’s disease1Lou Ruvo Center for Brain Health, Cleveland Clinic, Las Vegas, NV, United States
Synopsis
Keywords: fMRI Analysis, Alzheimer's Disease, Resting state fMRI, Empirical Mode Decomposition, Time frequency analysis
Motivation: The time frequency analysis of brain networks in resting state fMRI has largely been based on linear decompositions.
Goal(s): The primary goal of this study is to analyze the temporal dynamics of these networks using an adaptive nonlinear approach devoid of any apriori assumptions or basis functions.
Approach: Empirical Mode Decomposition (EMD), a data driven technique is utilized to investigate the energy period relationship differences in brain networks across cognitively normal (CN), mild cognitive impairment (MCI) and Alzheimer’s disease (AD).
Results: The AD group operates at a higher frequency with reduced energy in typical resting state networks compared to both CN and MCI.
Impact: The time varying energy and period profiles obtained from EMD could serve as a potential neuromarker for disease progression from MCI to AD, resulting in timely and early clinical intervention.
Introduction
Previous studies have shown that the functional connectivity in large scale brain networks like Default Mode Network (DMN) is decreased in Alzheimer’s disease1,2 compared to controls and MCI, and is also frequency dependent3. Also, the need and success of employing non-linear signal decomposition methods over conventional time frequency transforms (Fourier, Wavelet) to analyze brain networks is well established4-6. In this study, we apply the data-driven signal decomposition technique EMD7 to decompose the common resting state networks into Intrinsic Mode Functions8 (IMFs) that cover distinct frequency bands. The mean energy and period features obtained from Hilbert transform7 are used to analyze the temporal differences between the CN, MCI, and AD groups.Methods
Data used for this study was obtained from the publicly available Alzheimer’s Disease Neuroimaging Initiative (ADNI) database and consisted of amyloid-β positive subjects (F-florbetapir AV-45 PET standardized uptake value ratio9, SUVR ≥ 1.1) with 53 CN (20 Male; age: 76.7± 6.2 years; years of education: 17.2 ± 2.15), 58 MCI (31 Male; age: 76.1 ± 7.8 years; years of education: 16.3 ± 2.6) and 61 AD (33 Male; age: 77.1± 7.3 years; years of education: 16.1 ± 2.2) participants. The resting state fMRI was acquired with the following parameters (TR/TE/resolution = 3000ms/30ms/3.3x3.3x3.3mm3, flip angle = 80, 48 slices, and 140 timepoints). Standard spatial preprocessing was followed by temporal preprocessing consisting of detrending and variance normalization. Group ICA based on FastICA10 with tanh nonlinearity was implemented in MATLAB by temporal concatenation of the timeseries across all three groups to obtain 30 independent components. Then, 18 components spanning 8 major resting state networks (Default mode, fronto-parietal, frontal, temporal, visual, somatomotor, auditory and cerebellar networks) were shortlisted for subsequent analysis. Back-reconstruction based on GIG-ICA11 was implemented to obtain the subject level timeseries for each of these networks. Hilbert transform7 was then applied only to the EMD derived Intrinsic mode functions whose frequency spanned between 0.01 Hz and 0.16 Hz (Nyquist frequency, fNQ) to obtain the instantaneous energy and frequency profiles as a function of time for each subject and each brain network. Groupwise comparisons were then performed for each brain network for both log(mean energy) and log(period) features and the significant comparisons were identified using ANCOVA with age, education, and gender as covariates followed by Scheffe’s post hoc test. The mean marginal Hilbert spectrum representing the variation of amplitude over the range of frequencies was also calculated per group for IMF1-3.Results
Figure 1 shows the results of EMD applied to the timeseries of the posterior DMN (pDMN) network of the CN group where IMF1-3 whose frequency is between 0.01 Hz and fNQ were shortlisted for subsequent Hilbert spectral analysis. Each dot in Figure 1C is a subject and the IMF5-11 to the right of the vertical drift frequency line is due to scanner artifacts and IMF4 due to its affinity to the drift frequency are not considered for further analysis. Figure 2C and 2A shows that AD has the least energy for IMF2 followed by CN and then MCI as shown by the large effect sizes (0.9 for CN vs AD and 1.04 for MCI vs AD) and no significant differences between CN and MCI (d = -0.13 for CN vs MCI) were observed. Also, 2B and 2D show the AD group operating at a significantly higher frequency compared to the CN and MCI group shown by effect sizes (0.75 for CN vs AD and 0.89 for MCI vs AD). This reduction in energy and increase in frequency in AD are still significant after adjusting for covariates (age, education, and gender) shown by the significant p-values in the ANCOVA results and Scheffe’s post-hoc test in Table 1. This reduction in energy and the high frequency shift in AD was consistent across all other networks in IMF2,3 besides somatomotor, auditory networks, and left frontoparietal and anterior DMN networks respectively (Table 2).Discussion
We used EMD to analyze the differences in energy period profiles between CN, MCI, and AD and identified IMF1-3 had characteristic frequencies between 0.01 Hz and fNQ. The IMF2 and(or) IMF3 show significantly reduced energy and a high frequency shift in the AD for most of the resting state brain networks. Also, MCI was observed to have the most energy highlighting the compensatory brain mechanism present in the early stages of AD12.Conclusion
We have demonstrated that an adaptive time frequency analysis technique based on EMD and Hilbert spectrum can identify the significant temporal differences in the energy and period characteristics manifested across the AD disease spectrum in classic resting state brain networks.Acknowledgements
This study was funded by NIH-RF1AG071566.
References
- Binnewijzend M, Schoonheim MM, Sanz-Arigita E, et al. Resting-state fMRI changes in Alzheimer’s disease and mild cognitive impairment. Neurobiology of Aging. 2012;33(9):2018-2028.
- Greicius MD, Srivastava G, Reiss AL, Menon V. Default-mode network activity distinguishes Alzheimer’s disease from healthy aging: Evidence from functional MRI. Proceedings of the National Academy of Sciences of the United States of America. 2004;101(13):4637-4642.
- You-Jun L, Yao H, Lin P, et al. Frequency-Dependent altered functional connections of default mode network in Alzheimer’s disease. Frontiers in Aging Neuroscience. 2017;9.
- Stallone A, Cicone A, Materassi M. New insights and best practices for the successful use of Empirical Mode Decomposition, Iterative Filtering and derived algorithms. Scientific Reports. 2020;10(1).
- Cordes D, Kaleem M, Yang Z, et al. Energy-Period profiles of brain networks in Group FMRI Resting-State Data: A comparison of Empirical mode decomposition with the Short-Time Fourier Transform and the Discrete Wavelet Transform. Frontiers in Neuroscience. 2021;15.
- Cordes D, Zhuang X, Kaleem M, et al. Advances in functional magnetic resonance imaging data analysis methods using Empirical Mode Decomposition to investigate temporal changes in early Parkinson’s disease. Alzheimer’s & Dementia: Translational Research & Clinical Interventions. 2018;4(1):372-386.
- Huang NE, Shen Z, Long S, et al. The empirical mode decomposition and the Hilbert spectrum for nonlinear and non-stationary time series analysis. Proceedings of the Royal Society A: Mathematical, Physical and Engineering Sciences. 1998;454(1971):903-995.
- Flandrin, P, et al. Empirical mode decomposition as a filter bank, IEEE Sig. Proc. Letters 2004, 11(2), 112-114.
- Farrell, M. E., Jiang, S., Schultz, A. P., et al. Defining the lowest threshold for Amyloid-PET to predict future cognitive decline and amyloid accumulation. Neurology, 96(4), e619-e631.
- Hyvärinen, A. 1999. Fast and Robust Fixed-Point Algorithms for Independent Component Analysis. IEEE Transactions on Neural Networks 10(3):626-634.
- Du Y, Fan Y. Group information guided ICA for fMRI data analysis. NeuroImage. 2013;69:157-197.
Liang J, Li Y, Líu H, et al. Increased intrinsic default-mode network activity as a compensatory mechanism in aMCI: a resting-state functional connectivity MRI study. Aging. 2020;12(7):5907-5919.
Figures
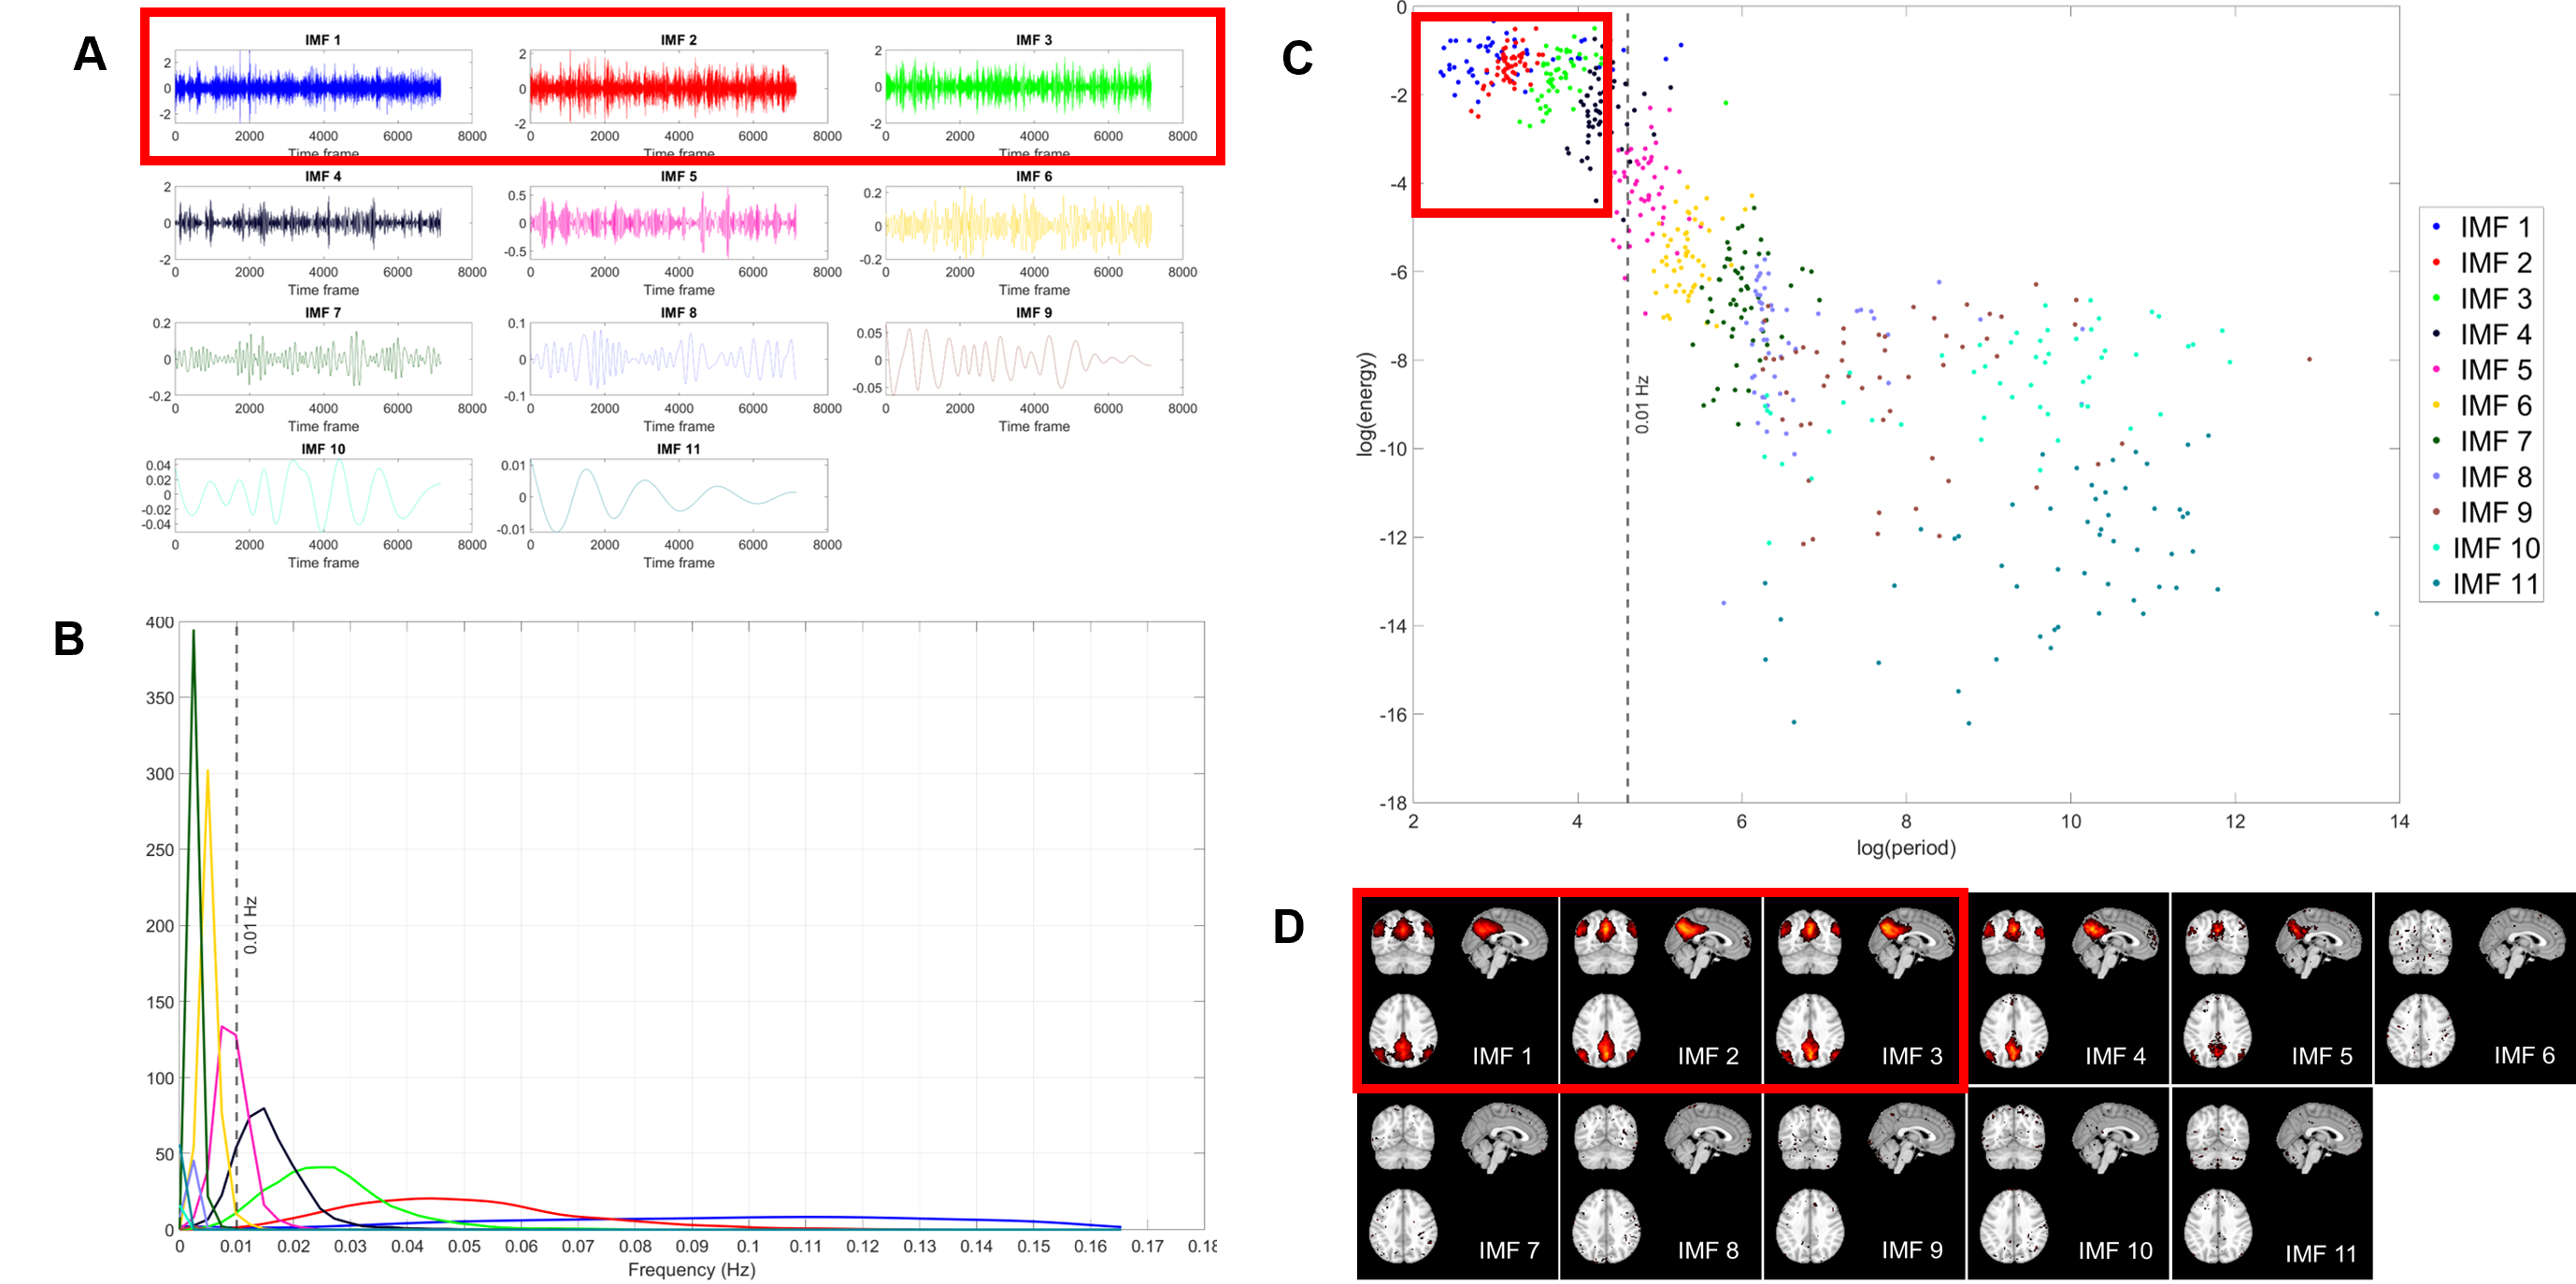
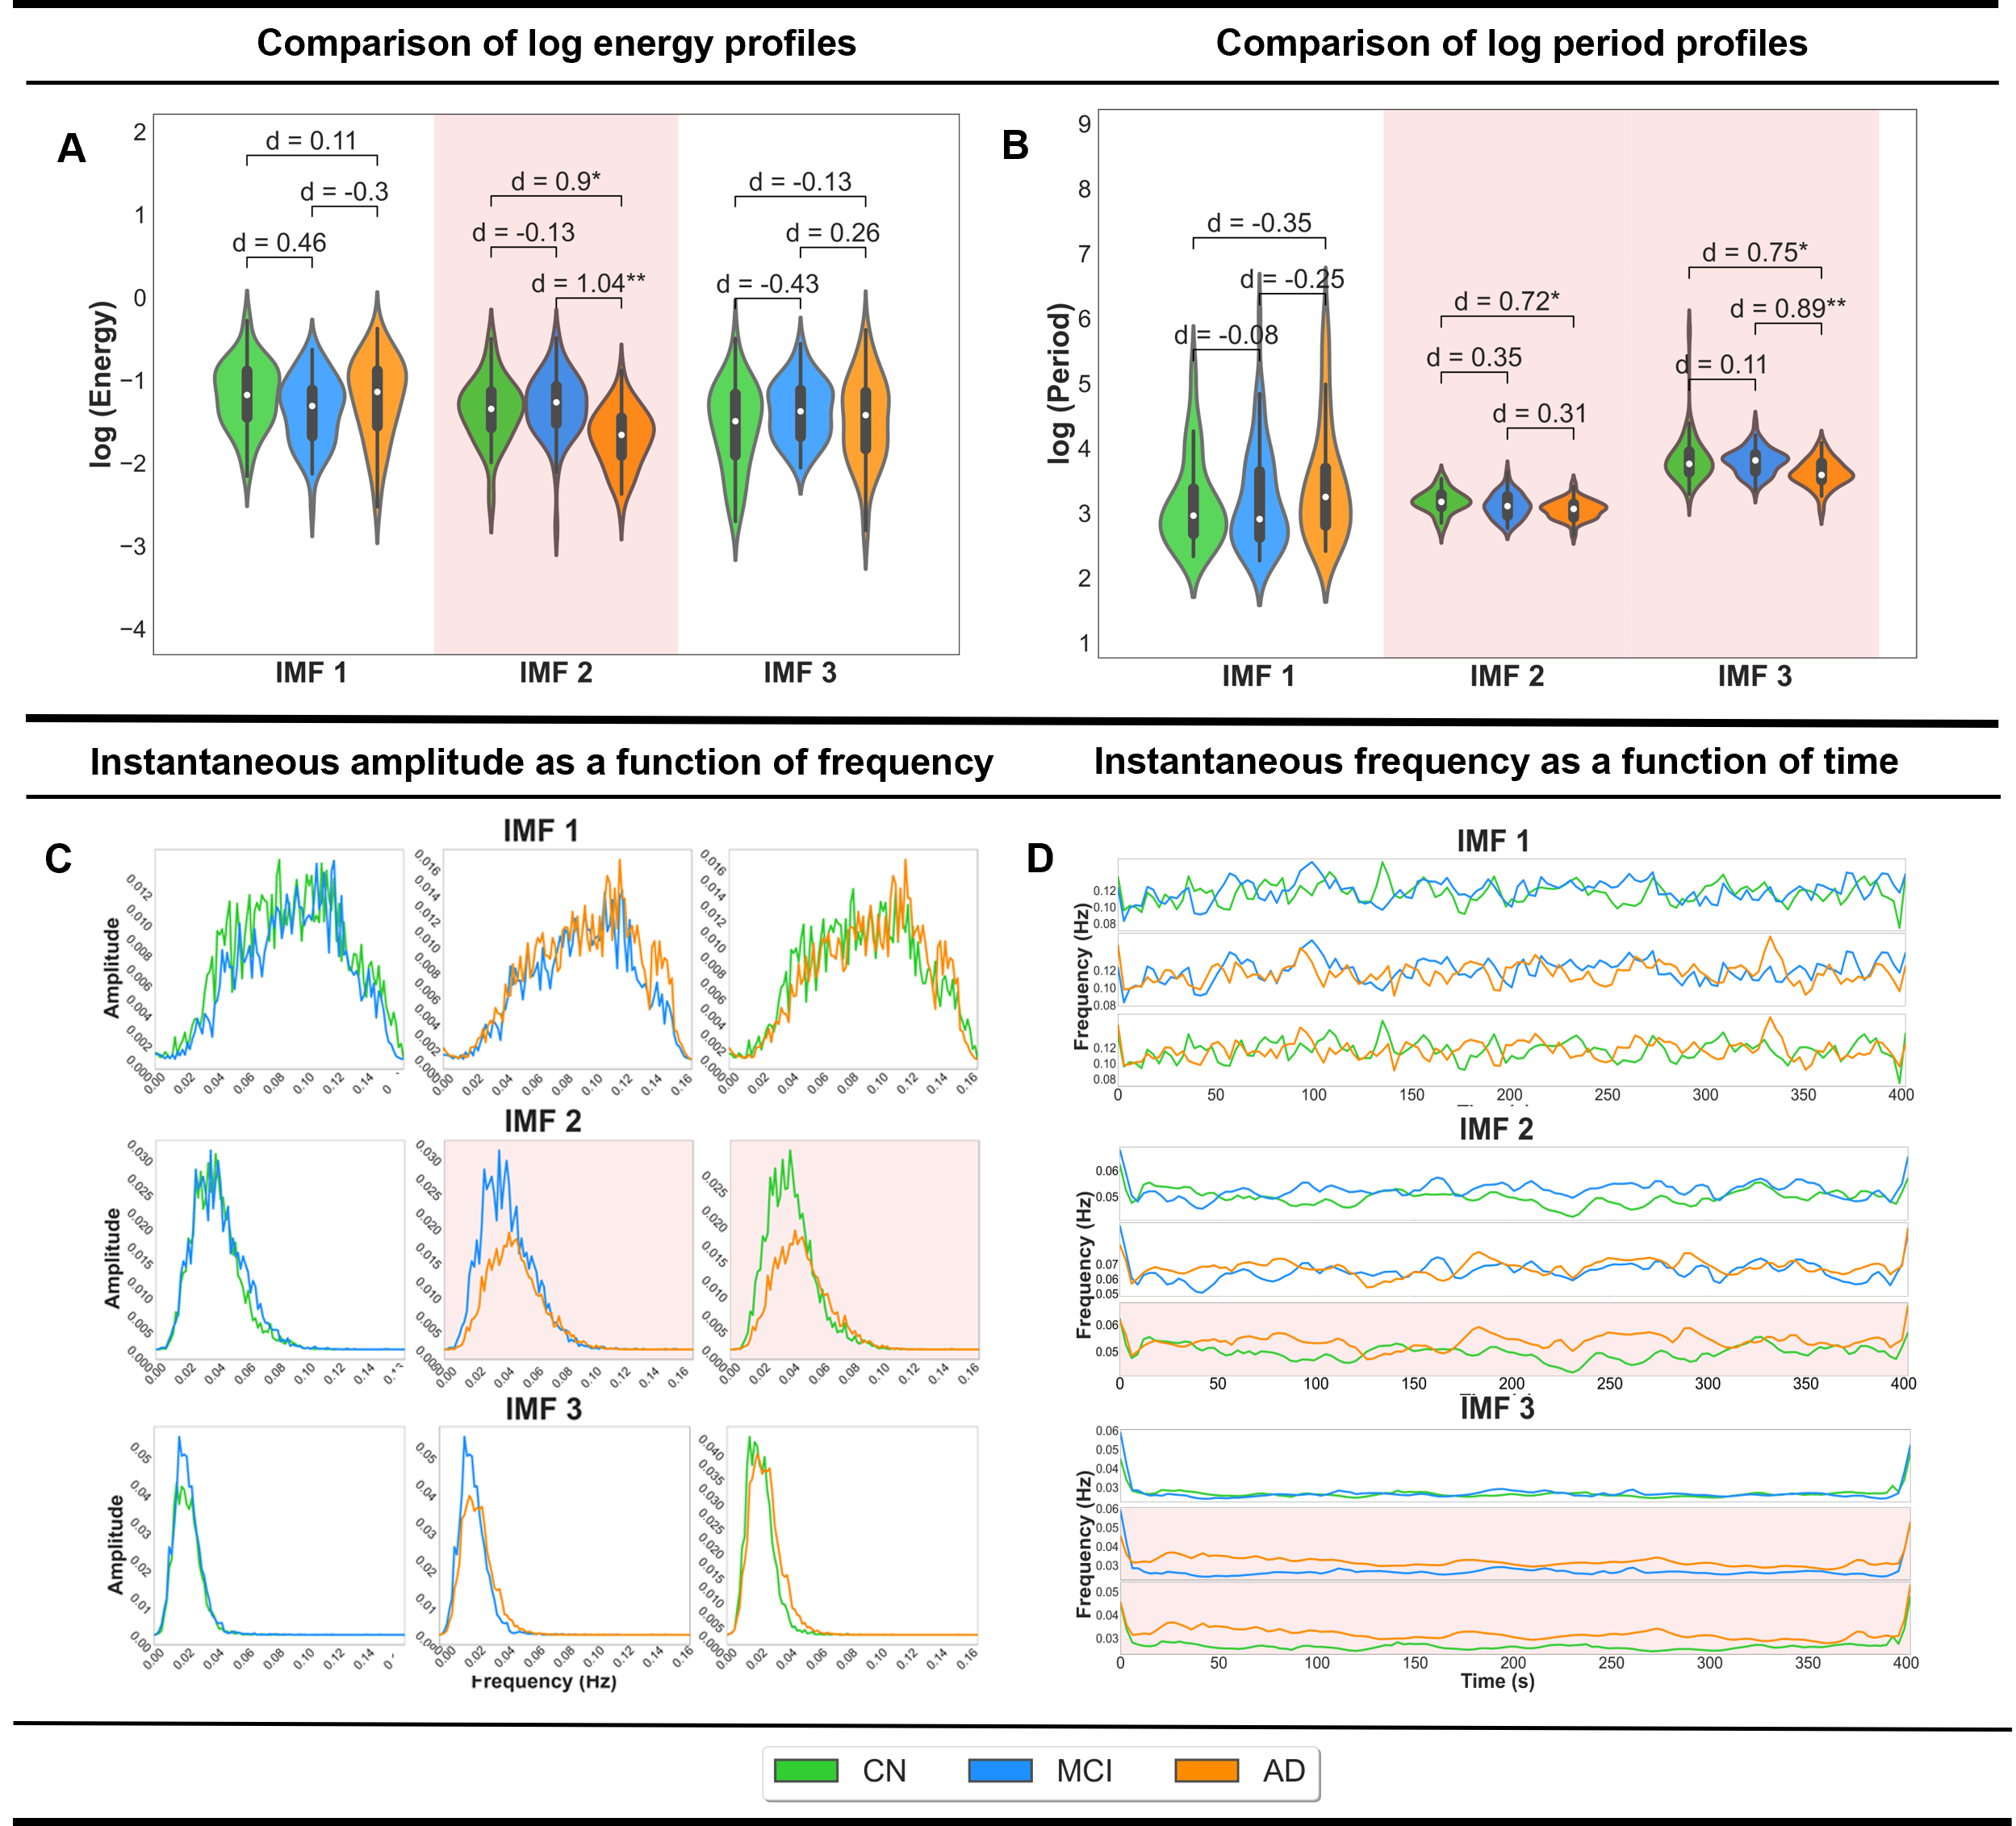
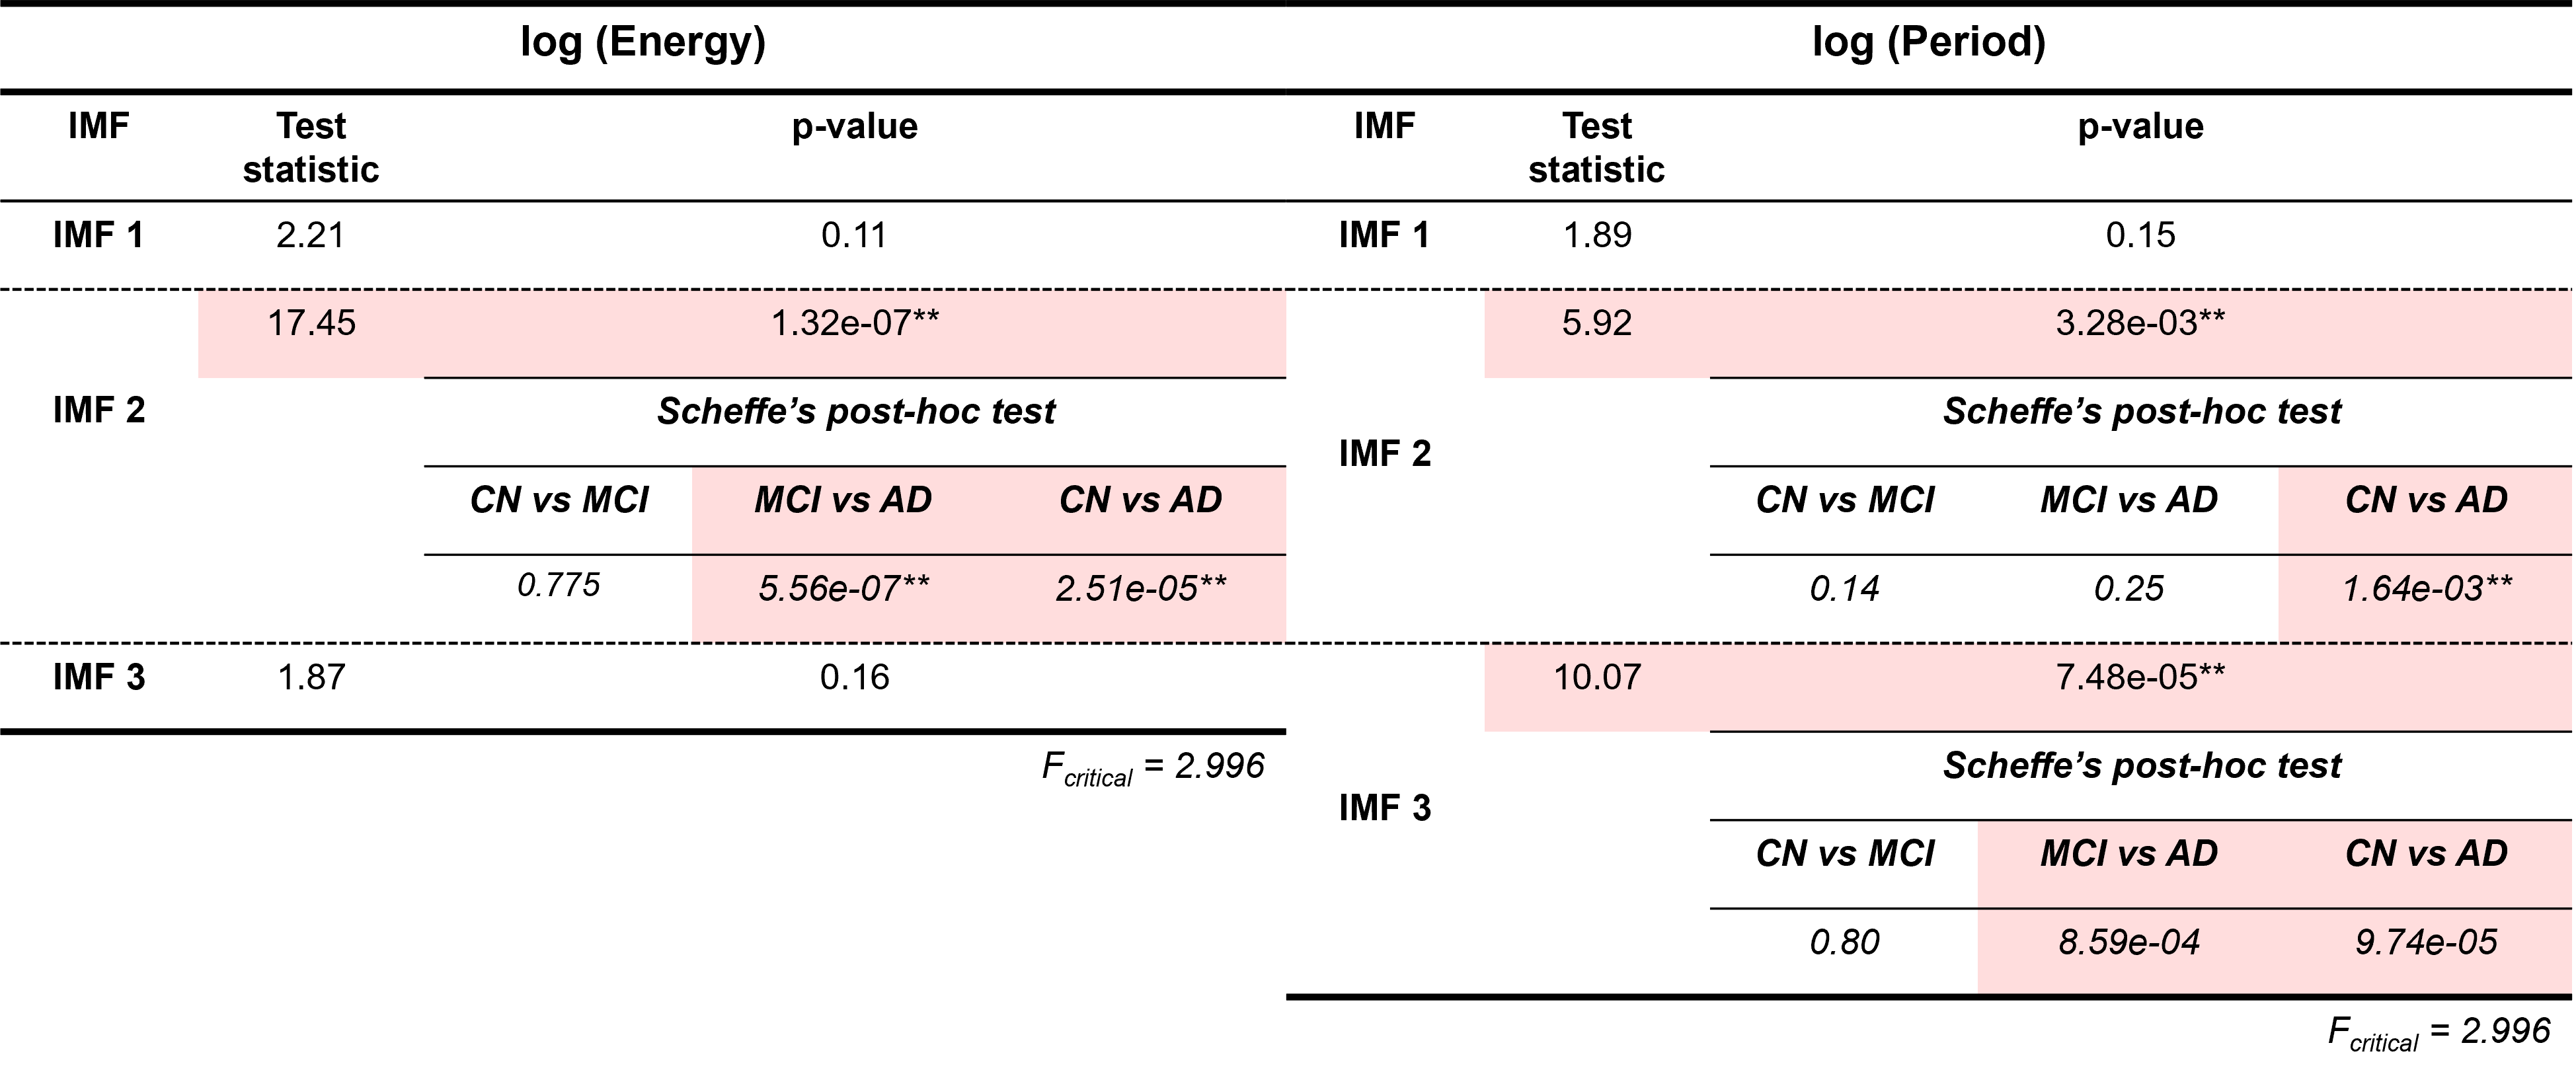
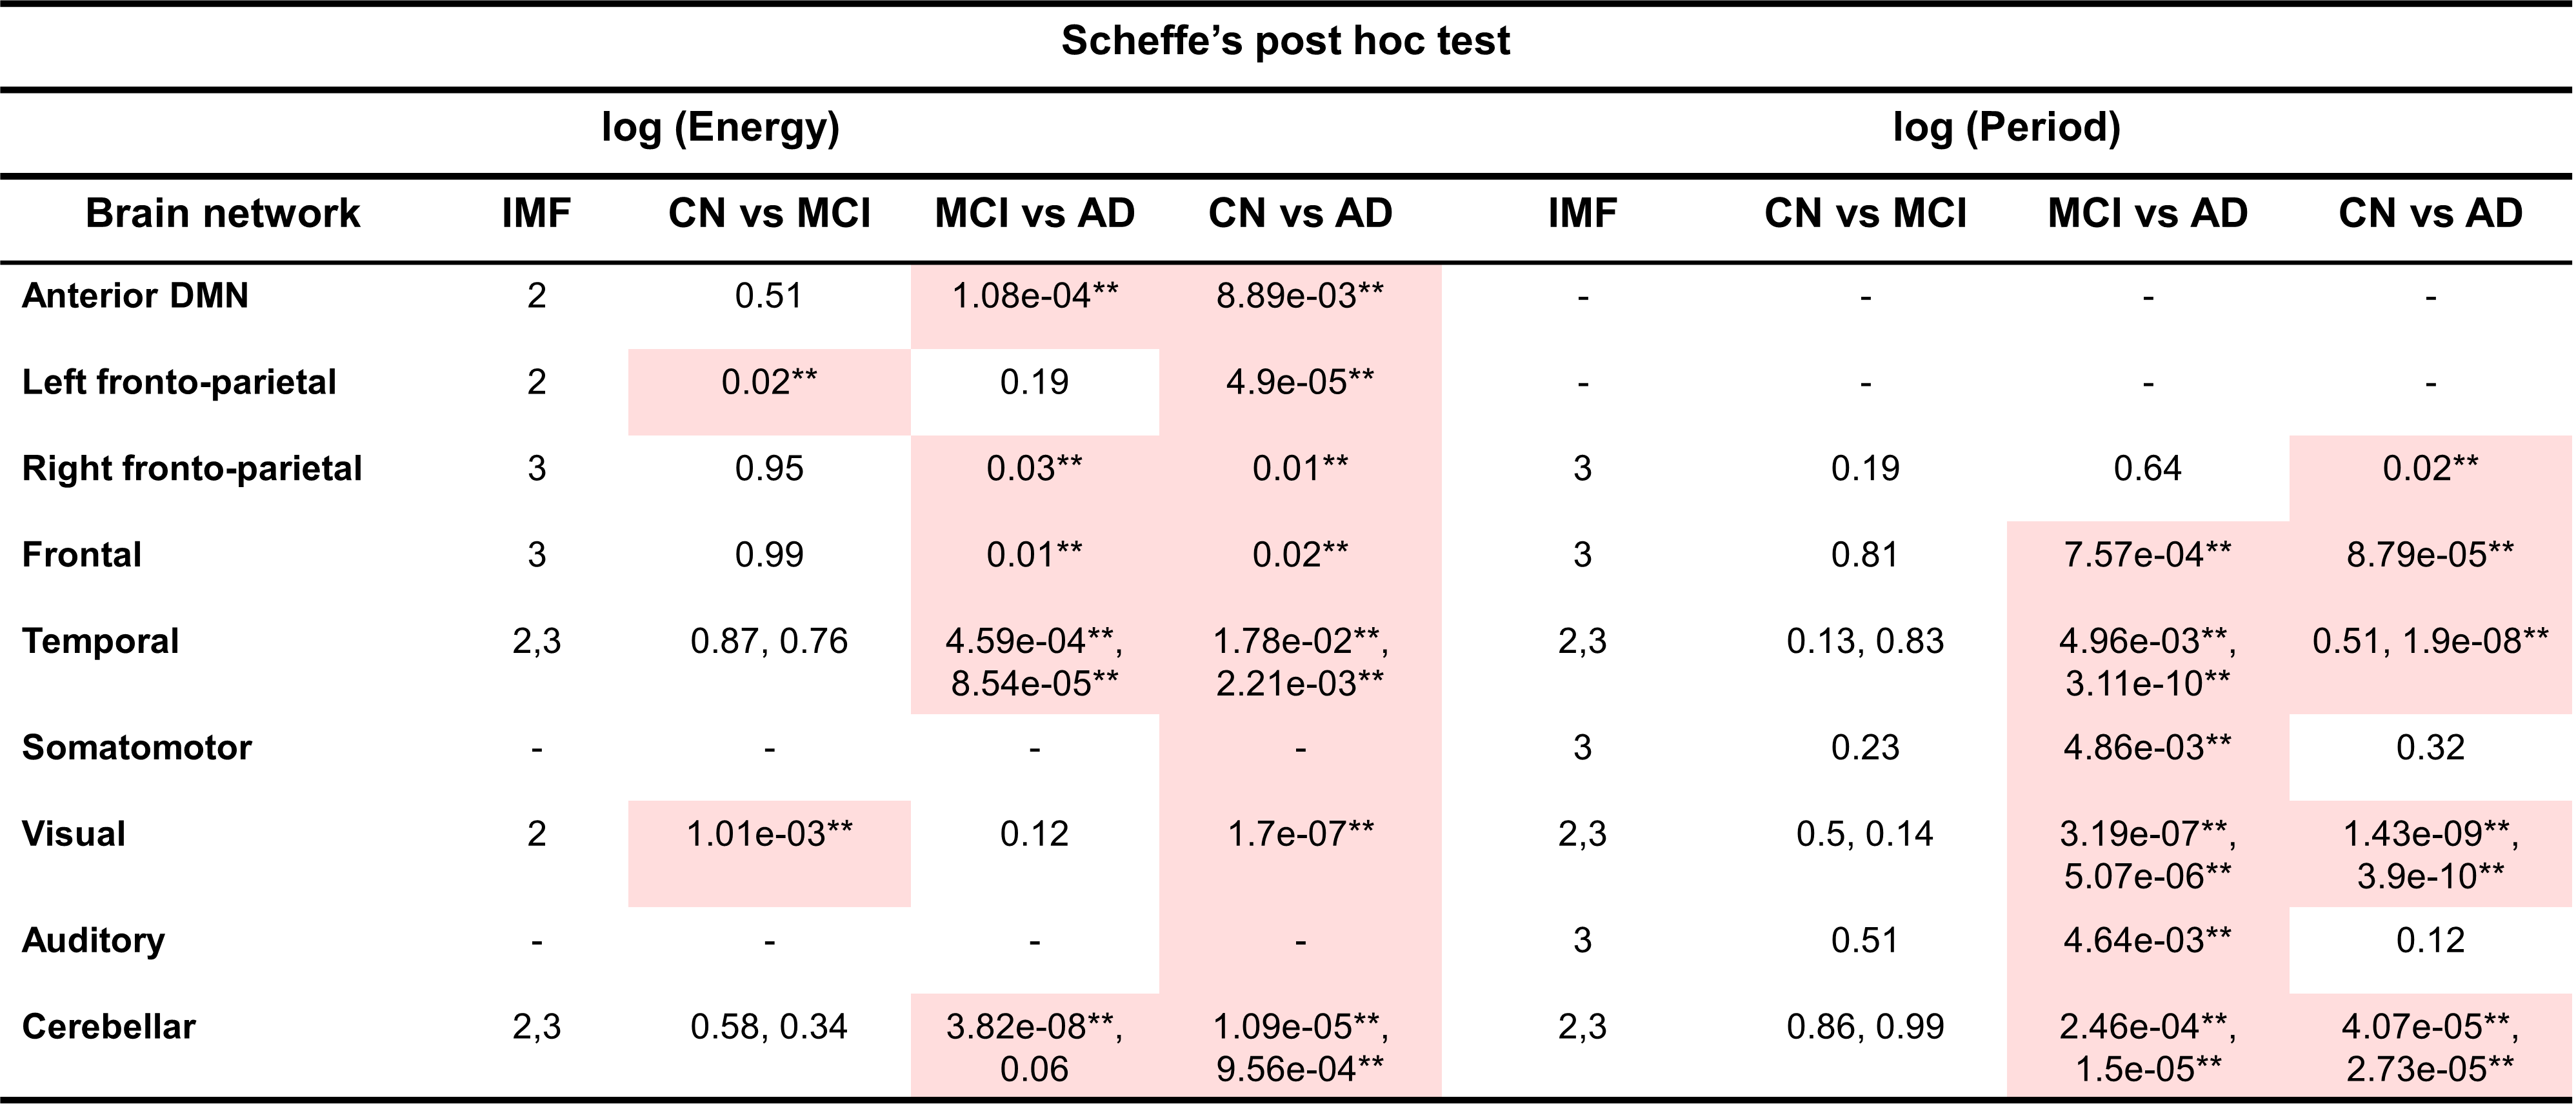
Table 2. p-values from Scheffe’s post hoc results for the IMFs which have significant group differences are shown for both log(energy) and log(period) highlighted by red and **. AD shows a universal reduction in energy for all brain networks except for the motor and auditory networks and a high frequency shift compared to MCI or(and) CN except for anterior DMN and left frontoparietal networks.