1122
Hyperactive Cerebellum in Alzheimer’s Disease1Pennsylvania State University College of Medicine, Hershey, PA, United States
Synopsis
Keywords: Functional Connectivity, Alzheimer's Disease
Motivation: Cerebellar involvement in Alzheimer’s disease (AD) has not been studied to the extent that cortical neuropathological changes have been. Historical and recent histopathological literature demonstrates cerebellar AD pathology while functional investigations have demonstrated disrupted intrinsic cortical – cerebellar connectivity in AD.
Goal(s): Investigate metabolic activity and functional connectivity of the cerebellum with the default mode network, dorsal attention network, and primary olfactory cortex.
Approach: Characterizing the cerebellum’s metabolic activity using 18F-fluorodeoxyglucose positron data from the Alzheimer’s Disease Neuroimaging Initiative.
Results: In contrast to known parietal and temporal lobe FDG hypo-metabolism in AD, significant FDG hyper-metabolism was found in the cerebellum.
Impact: Results show that resting state functional connectivity of cerebellar regions (that show hyper FDG metabolic activity) is impaired across brain-wide networks. Future work focusing on inhibitory control of the cerebellum as a potential pathway of AD pathogenesis is warranted.
Introduction
There are a few studies demonstrating impaired cortical – cerebellar connectivity in Alzheimer's disease (AD)1–3. Transgenic mouse studies have clearly shown amyloid-β (Aβ) deposition in the cerebellum, in some cases before plaque formation4. Here, we analyzed 18F-fluorodeoxyglucose (FDG) positron emission tomography (PET) and resting-state functional MRI (rs-fMRI) data in AD, mild-cognitive impaired (MCI), and age-matched cognitively normal (CN) subjects in a database for the Alzheimer’s Disease Neuroimaging Initiative* (ADNI). Our focus was on the intrinsic functional connectivity of the cerebellum with the default mode network (DMN), dorsal attention network (DAN), and the primary olfactory cortex (POC). We hypothesized that the resting state functional connectivity of cerebellar regions with differential FDG metabolic activity would show impaired brain-wide network connectivity in MCI and AD groups.Methods
A group of 274 ADNI subjects (CN=80, MCI=149, AD=45) with FDG-PET scans were analyzed in this study. Each 30-minute FDG time series was motion-corrected and averaged across all frames. FDG volumes were partially volume corrected with a Van-Cittert deconvolution technique to improve quantitative accuracy and recover PET signal in cortical grey matter. Each average was spatially normalized to a Montreal Neurological Institute (MNI) tracer template, reoriented to the anterior commissure, then co-registered with the same subjects’ T1 using SPM12. DMN and DAN masks were downloaded from neurovault.org. Functional connectivity and statistical analyses were performed in DPABI. A group analysis was performed in SPM12 and two cerebellar ROIs comparing AD > CN (p<0.05 FWE, k=20) were subsequently used as seeds for an analysis in DPABI. These ROIs were used to generate the SUVR values used for a correlation analysis.Results
The SPM group analysis of PET data identified crus II, vermis lobule 6 and right cerebellum 4,5 as hyperactive (increased glucose metabolism) in MCI and AD, respectively, when compared to CN (see Figure 1 for the cerebellum 4,5R seed region). Cerebellum 4,5 R and vermis lobule 6 are negatively correlated with regions in the pons and Brodmann Area 25 for both MCI and AD cohorts. CN showed no negative correlation, but positive ones were shown in the Left Precuneus, Right Angular Gyrus, and Left Post Cingulate. Subsequent analyses identified brain regions within the DMN, DAN, and POC that are correlated with hyperactive cerebellar regions (Figure 2). Resting state analyses, using the crus II ROI, detected impaired connectivity of hyperactive cerebellar regions with frontal regions of the DMN, and also the POC (Figure 3). Neuropsychological testing data and biomarker data was also collected and averaged across the entire cohort. The results are shown in Figure 4 and Figure 5.Discussion
Amyloid-β (Aβ) deposition in the cerebellum can affect synaptic transmission and plasticity. The hyper-metabolism in the AD cerebellum, therefore, may reflect connectivity disruptions to local and brain-wide networks. Hyper-metabolism in the cerebellum can adversely impact its inhibitory dynamics — providing a testable hypothesis to explain the susceptibility of brain network disruption for both MCI and AD, when compared to CN.Acknowledgements
This study was supported by NIH grants R01AG070088, R01NS099630, and R21AG064486.References
1. Guo W, Liu F, Chen J, et al. Resting-state cerebellar-cerebral networks are differently affected in first-episode, drug-naive schizophrenia patients and unaffected siblings. Sci Rep. 2015;5:17275. doi:10.1038/srep17275
2. Tang F, Zhu D, Ma W, Yao Q, Li Q, Shi J. Differences Changes in Cerebellar Functional Connectivity Between Mild Cognitive Impairment and Alzheimer’s Disease: A Seed-Based Approach. Frontiers in Neurology. 2021;12:987. doi:10.3389/fneur.2021.645171
3. Hunt A, Schönknecht P, Henze M, Seidl U, Haberkorn U, Schröder J. Reduced cerebral glucose metabolism in patients at risk for Alzheimer’s disease. Psychiatry Research: Neuroimaging. 2007;155(2):147-154. doi:10.1016/j.pscychresns.2006.12.003
4. Lee SP, Falangola MF, Nixon RA, Duff K, Helpern JA. Visualization of β-Amyloid Plaques in a Transgenic Mouse Model of Alzheimer’s Disease Using MR Microscopy Without Contrast Reagents. Magn Reson Med. 2004;52(3):538-544. doi:10.1002/mrm.20196
Figures
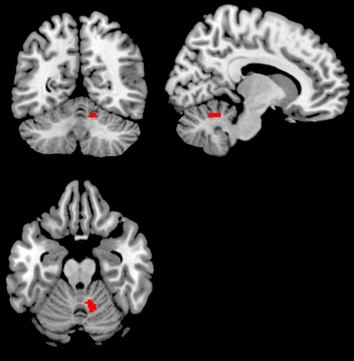
Figure 1) Cerebellar ROI set to p<0.05 FWE and k=20 when viewing AD>CN cohorts in SPM. This creates a seed region used for subsequent analyses.
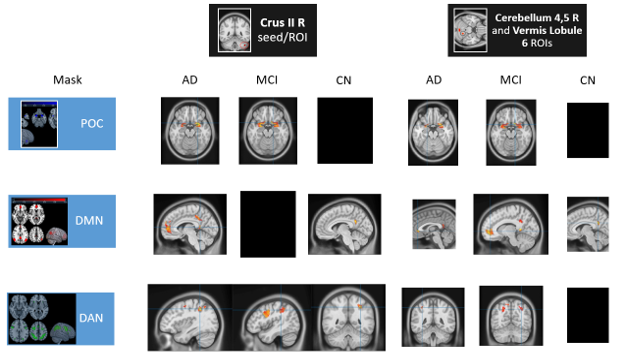
Figure 2) Correlations between hyperactive cerebellar regions and the Primary Olfactory Cortex (POC), Default Mode Network (DMN), and Dorsal Attention Network (DAN), (p<0.001, k = 20). Black boxes indicate a lack of significant activation.
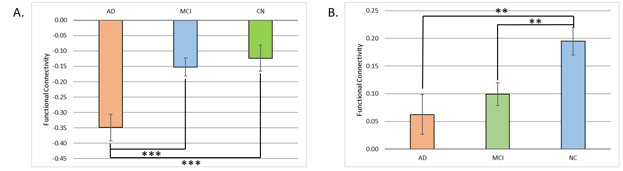
Figure 3) Resting state functional connectivity between the CRUS II seed ROI and the frontal regions within the DMN (A) and the POC (B). ** p <0.01; *** p < 0.001
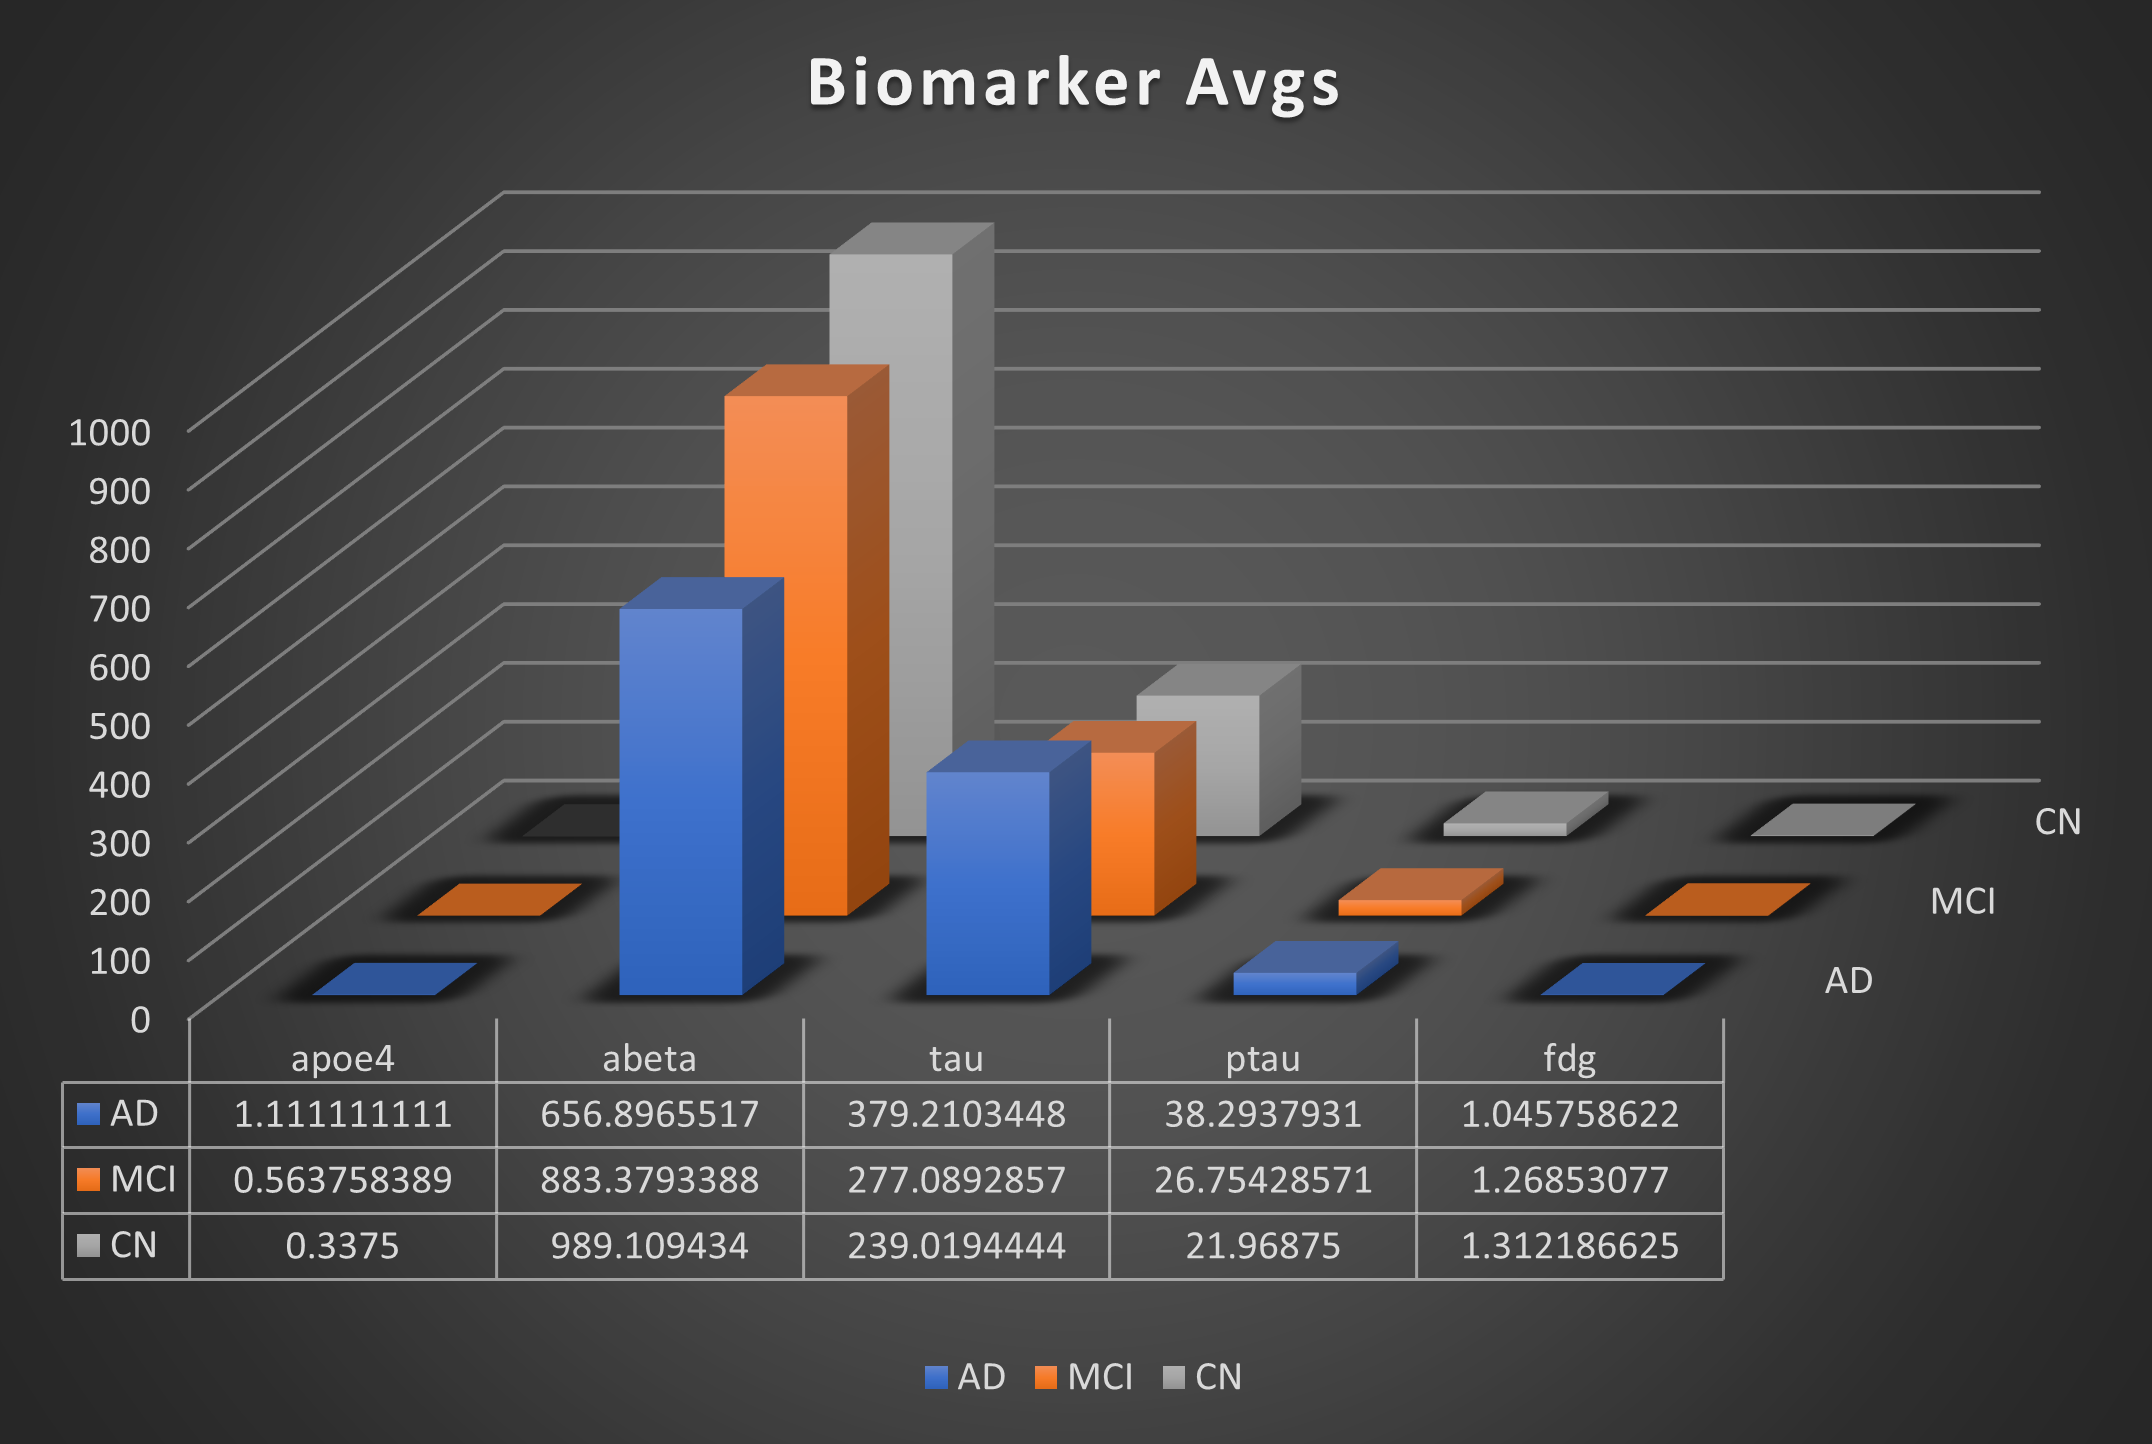
Figure 4) Averages of biomarkers in the graph above show clear correlations based on diagnosis, and when progressing from CNàMCIàAD: APOe4 increases, A-Beta levels decrease, P-tau and Tau levels increase.
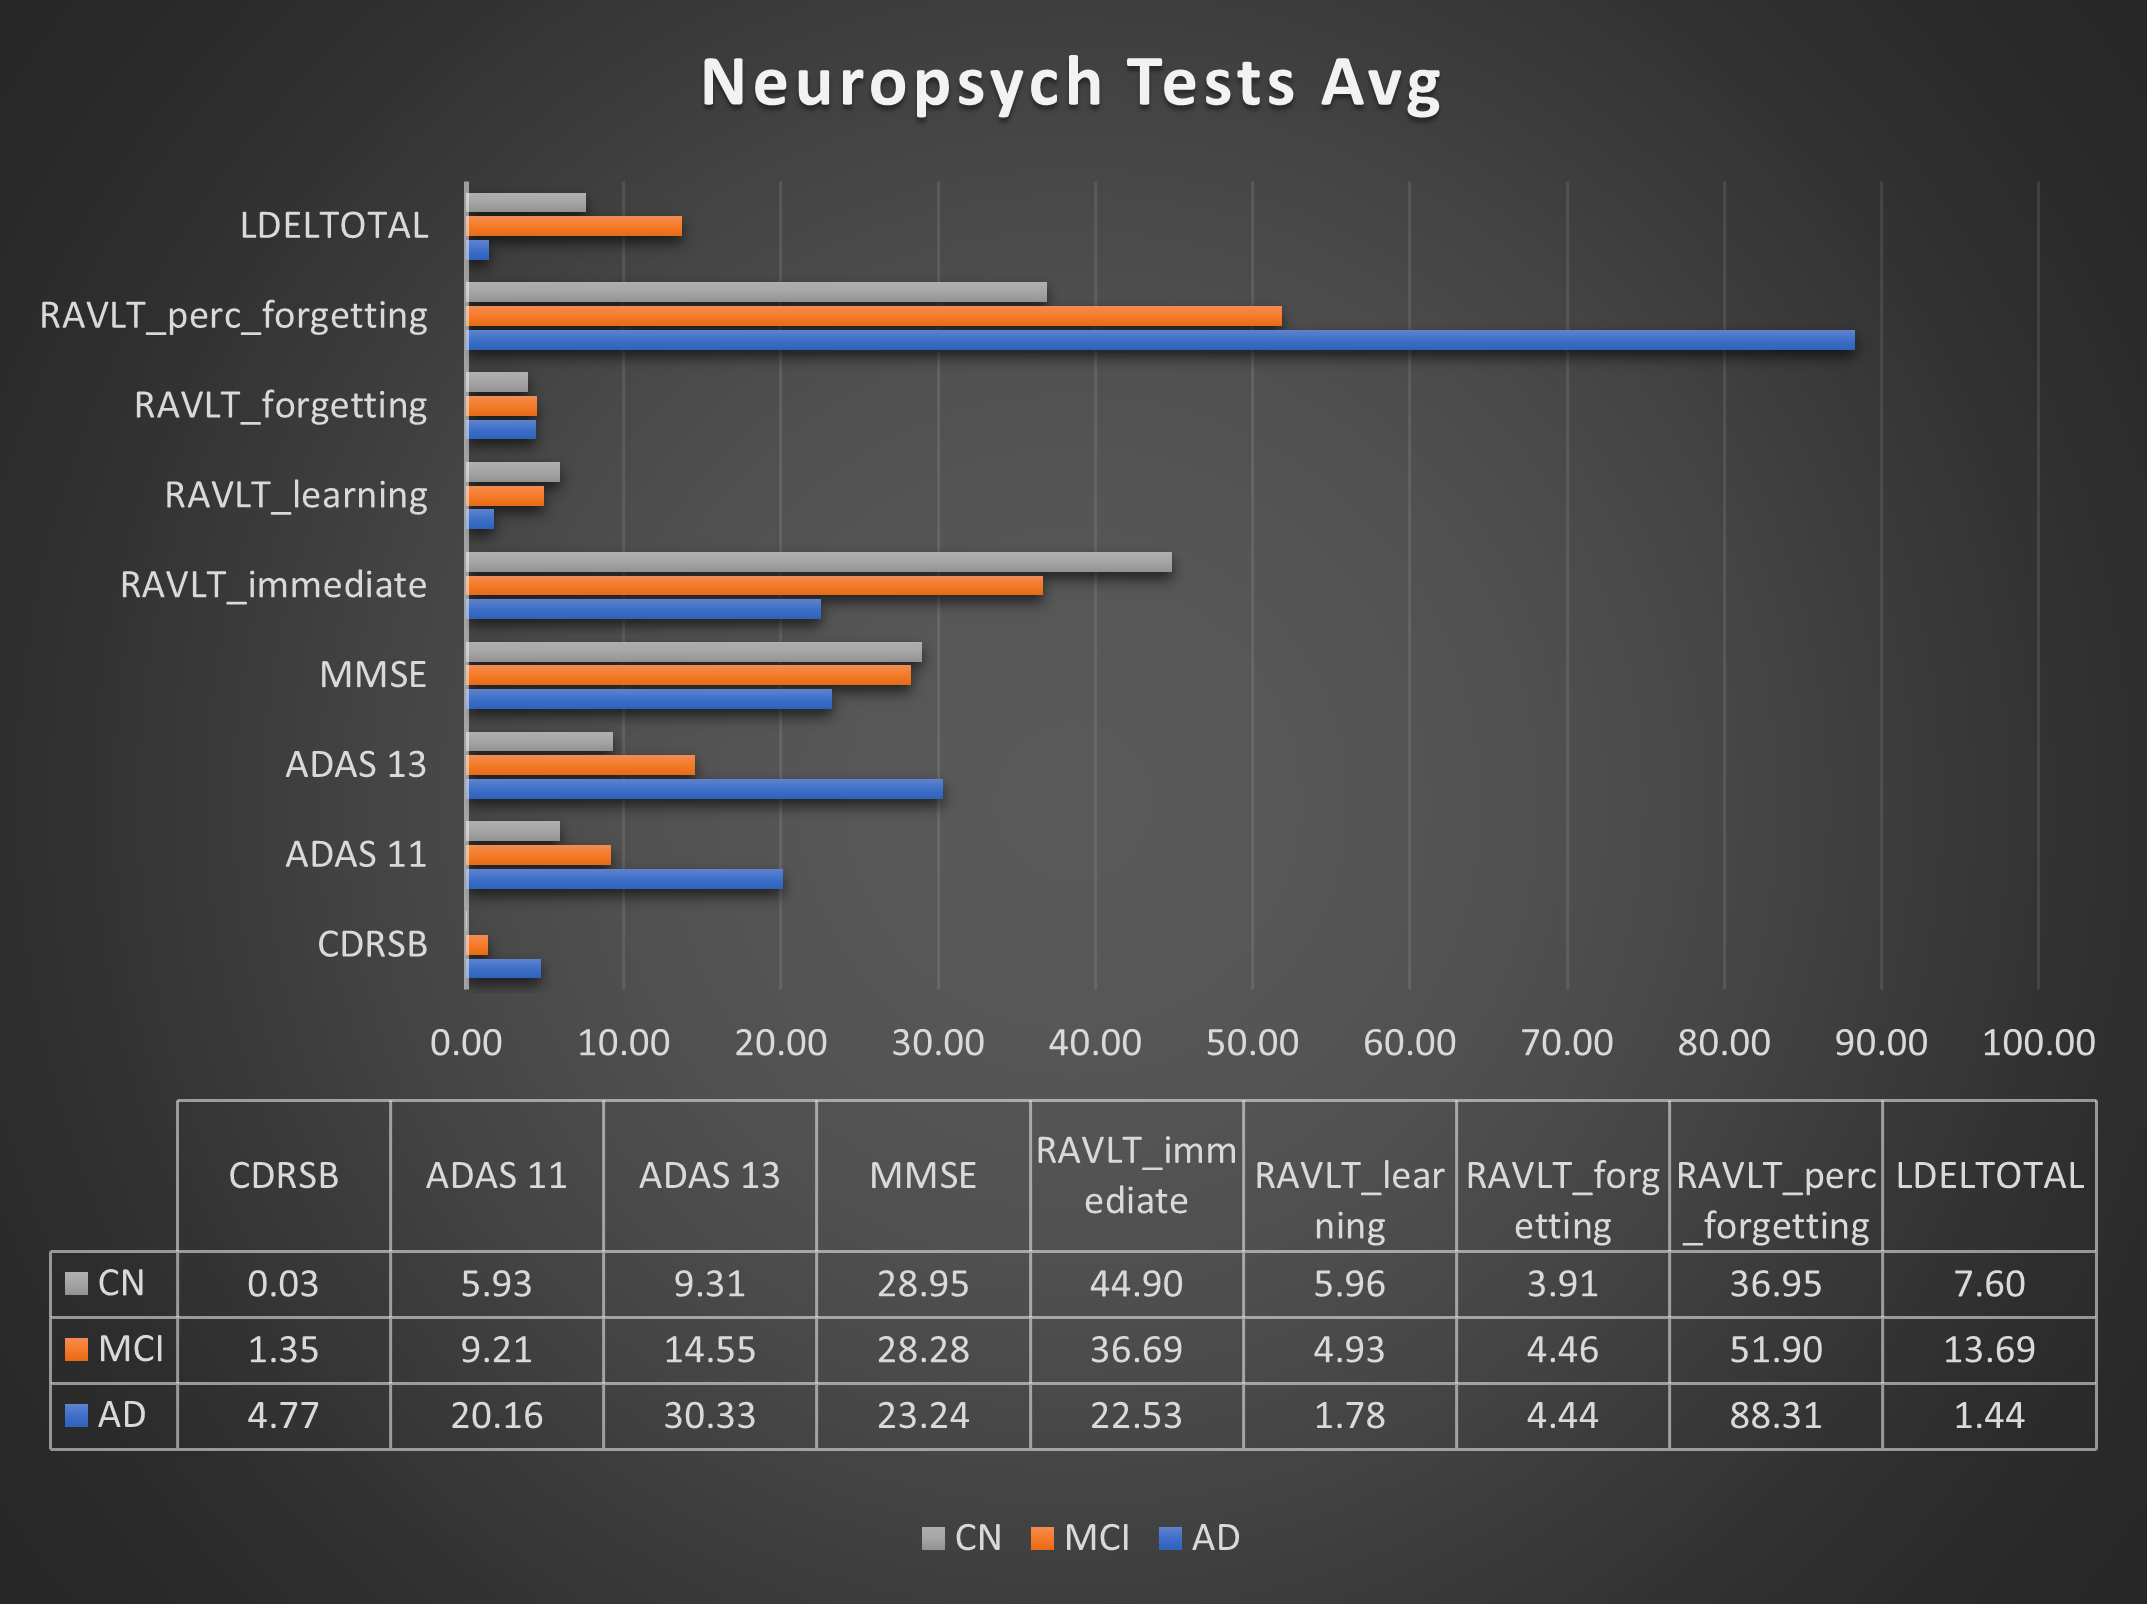
Figure 5) Summary of averages across AD, MCI and CN cohorts. A comparison of scores should tell us which metrics are most useful when creating a prognosis for MCI to AD conversion. The ADAS 11 and 13, LDEL, CDR-SB and the RAVLT % forgetting metrics are the most useful for distinguishing between the three cohorts.