1121
Investigating the Effect of Central Thalamic Deep Brain Stimulation on Sleep in Alzheimer’s Disease Model1National Yang Ming Chiao Tung University, Taipei City, Taiwan, 2Biomedical Translation Research Center, Academia Sinica, Taipei City, Taiwan, 3Abbott Neuromodulation, Austin, TX, United States, 4Department of Neurology, Hualien Tzu Chi Hospital, Buddhist Tzu Chi Medical Foundation, Hualien, Taiwan, 5Department of Neurology, Tzu Chi University, Hualien, Taiwan
Synopsis
Keywords: Functional Connectivity, Alzheimer's Disease, intermittent theta-burst stimulation (iTBS)
Motivation: In Alzheimer's disease (AD), the neuropsychiatric inventory is strongly affected by sleep disorders, and vice versa. Central thalamic deep brain stimulation (CT-iTBS) has improved memory and altered the hypothalamic function which may impact the orexinergic system and sleep.
Goal(s): Investigating the therapeutic effect of CT-iTBS on sleep, orexinergic system, and cognitive function in AD.
Approach: Applied functional magnetic resonance imaging, electrocorticogram-electromyogram, behavioral tasks, and ELISA to assess the impact of CT-iTBS in 3xTgAD mouse model.
Results: CT-iTBS significantly improved sleep fragmentation, functional connectivity, cognitive function, and orexin receptors and concentrations in 3xTgAD mice.
Impact: We discovered that CT-iTBS may play an important role in modulating sleep, the orexinergic system, and cognitive function in AD. Improved outcomes pave the future direction of treating sleep disorders in Alzheimer's disease.
Introduction
The prevalence of sleep disorders in neurodegenerative diseases is high, especially in Parkinson’s disease and Alzheimer’s disease (AD)1,2. Previous studies have shown multiple types of sleep disorders were associated with Alzheimer's disease and progressed as the disease worsened3. The orexinergic system had been found to modulate and regular wake-sleep cycle4-6. Lots of evidence shows that the orexinergic system had an important role in activating and modulating memory and motivated behavior function7,8. Recently, intermittent theta-burst stimulation (iTBS) has been hypothesized to alter cognitive functions in a more efficacious way. By delivering in rhythmic bouts of frequency at 3-8 Hz, iTBS recapitulates natural brain rhythm to immediately provoke theta oscillations in the brain, which have profound functional relevance to cognition9. The central thalamus (CT), a signal hub in the brain, had been considered to be the target for enhancing cognitive functions10. In this study, we used functional magnetic resonance imaging (fMRI), electrocorticogram-electromyogram (ECoG/EMG), behavioral tasks, and orexin to evaluate the therapeutic effect of CT-iTBS in 3xTgAD mice on sleep.Methods
8-month-old male C57BL/6 mice (weight 20 ± 5 g, N = 14) were used as healthy controls, and age-match male 3×TgAD mice (weight 20 ± 5 g, N = 28) were used as sham controls and DBS group. All mice received implantation surgery with two MR-compatible neural probes into the bilateral CT (AP: − 1.56 mm, ML: ± 0.7 mm, DV: − 3.0 mm). Also, half of mice in the three groups placed screw electrodes over the skull to record the ECoG signals. After seven days of recovery, implanted mice in three groups were placed in a plastic cage (30 cm diameter and 38 cm height) for 30 min/day with/without iTBS (Biphasic electrical current of 150 µA with a pulse width of 100 µs and burst width of 100 ms at 5 Hz burst rate and 200 Hz intra-burst rate (10 pulses per burst)) and then performed behavioral tasks. Open field task (OFT) and novel object recognition (NOR) over three days to evaluate anxiety and cognitive function. To investigate functional connectivity (FC) alteration with CT-iTBS, brain images were obtained using a Bruker 7 Tesla MRI scanner (Bruker Biospec 70/30 USR, Ettlingen, Germany). The gradient-echo planar imaging (GE-EPI) sequence (TR = 2,000 ms, TE = 20 ms, FOV = 20 × 20 mm2, matrix size = 80 × 80, bandwidth = 200 kHz, 14 coronal slices, and thickness = 0.5 mm) was used to obtain the resting-state fMRI (rsfMRI) images. There were 260 dynamics for 10 dummy scans and 250 rsfMRI images in the GE-EPI images. The FMRIB Software Library v5.0 (FSL 5.0; www.fmrib.ox.ac.uk/fsl) and the Analysis of Functional NeuroImages (AFNI) software (http://afni.nimh.nih.gov/afni) were used to perform a ROI-based analysis of FC between regions such as the prefrontal cortex (PFC), CT, hippocampus (HIPP), and hypothalamus (HYPO). The Allen mouse brain11 ROIs were also resliced to match the affined GE-EPI datasets in dimension. To compare the FC caused by CT-iTBS quantitatively, the measured FC between distinct brain areas was normalized. Then, sacrificed and randomly divided equally for IHC staining (Anti-Orexin receptor 1 (OXR1, AOR-001, Alomone)) and ELISA (Mouse Orexin A/Hypocretin-1 ELISA Kit (NBP2-80231, Novus-Biologicals)).Results
In behavioral tasks, DBS group showed significantly higher PI, total distance, and time spent in the inner zone compared with sham controls (Fig. 1). The rsfMRI results revealed a significant increase in functional connectivity (FC) between PFC, CT, HIPP, and HYPO following CT-iTBS treatment (Fig. 2). Meanwhile, we measured fragmentation index (FI), calculated as total number of awakenings divided by total sleep time12. The FI in dark phase showed significantly higher in sham controls compared with healthy controls and DBS group (Fig. 3). Additionally, the concentration of orexin-1 in HYPO was significantly lower in sham controls and increased after CT-iTBS treatment (Fig. 4).Discussion
We found CT-iTBS improved the performance of behavioral tasks related to anxiety and cognitive function, enhanced FC, decreased FI, and enhanced concentration of orexin-1 in HYPO. In previous studies, the DBS mechanism has focused on manipulating brain networks10,13-15. CT-iTBS was associated with corticolimbic and thalamocortical networks, which are related to modulate consciousness, sleep/wake cycle, and cognitive function10,16. Orexin neuron loss and lower concentration were found in AD patients17 related to sleep and memory7,18.Conclusion
In this study, we applied the CT-iTBS in the 3×TgAD mice model, demonstrating the differences in behavioral performance, FC, sleep fragmentation, and orexin in healthy controls, sham controls, and DBS group. Our findings support the importance of CT as a therapeutic target for improving sleep, orexinergic system and cognitive function in AD individuals.Acknowledgements
This work is financially supported by the National Science and Technology Council under Contract numbers of NSTC 111-2314-B-303-026, 111-2221-E-A49 -049 -MY2, 112-2622-8-A49-010-TE2, 112-2321-B-A49-009-. Partial support for the work also is provided by “Key and Novel Therapeutics Development Program for Major Diseases” project of Academia Sinica, Taiwan, R.O.C. under Grant number AS-KPQ-111-KNT.References
1. Moe KE, Vitiello MV, Larsen LH, Prinz PN. Symposium: Cognitive processes and sleep disturbances: Sleep/wake patterns in Alzheimer's disease: relationships with cognition and function. J Sleep Res. 1995;4(1):15-20.
2. Trenkwalder C. Sleep dysfunction in Parkinson's disease. Clin Neurosci. 1998;5(2):107-114.
3. Chokroverty S. Sleep and Neurodegenerative Diseases. Semin Neurol. 2009;29(04):446-467.
4. Sakurai T. The neural circuit of orexin (hypocretin): maintaining sleep and wakefulness. Nature Reviews Neuroscience. 2007;8(3):171-181.
5. Liguori C. Orexin and Alzheimer’s Disease. In: Lawrence AJ, de Lecea L, eds. Behavioral Neuroscience of Orexin/Hypocretin. Cham: Springer International Publishing; 2017:305-322.
6. Sakurai T, Mieda M, Tsujino N. The orexin system: roles in sleep/wake regulation. Annals of the New York Academy of Sciences. 2010;1200(1):149-161.
7. Wang C, Wang Q, Ji B, et al. The Orexin/Receptor System: Molecular Mechanism and Therapeutic Potential for Neurological Diseases. Frontiers in Molecular Neuroscience. 2018;11.
8. Yang L, Zou B, Xiong X, et al. Hypocretin/Orexin Neurons Contribute to Hippocampus-Dependent Social Memory and Synaptic Plasticity in Mice. The Journal of Neuroscience. 2013;33(12):5275.
9. Solomon EA, Sperling MR, Sharan AD, et al. Theta-burst stimulation entrains frequency-specific oscillatory responses. Brain stimulation. 2021;14(5):1271-1284.
10. Li S-J, Lo Y-C, Lai H-Y, et al. Uncovering the Modulatory Interactions of Brain Networks in Cognition with Central Thalamic Deep Brain Stimulation Using Functional Magnetic Resonance Imaging. Neuroscience. 2020;440:65-84.
11. Lein ES, Hawrylycz MJ, Ao N, et al. Genome-wide atlas of gene expression in the adult mouse brain. Nature. 2007;445(7124):168-176.
12. Morrell MJ, Finn L, Kim H, Peppard PE, Badr MS, Young T. Sleep fragmentation, awake blood pressure, and sleep-disordered breathing in a population-based study. Am J Respir Crit Care Med. 2000;162(6):2091-2096.
13. McIntyre CC, Hahn PJ. Network perspectives on the mechanisms of deep brain stimulation. Neurobiology of Disease. 2010;38(3):329-337.
14. Montgomery EB, Gale JT. Mechanisms of action of deep brain stimulation (DBS). Neuroscience & Biobehavioral Reviews. 2008;32(3):388-407.
15. Miocinovic S, Somayajula S, Chitnis S, Vitek JL. History, Applications, and Mechanisms of Deep Brain Stimulation. JAMA Neurology. 2013;70(2):163-171.
16. Gottshall JL, Adams ZM, Forgacs PB, Schiff ND. Daytime Central Thalamic Deep Brain Stimulation Modulates Sleep Dynamics in the Severely Injured Brain: Mechanistic Insights and a Novel Framework for Alpha-Delta Sleep Generation. Frontiers in Neurology. 2019;10.
17. Fronczek R, van Geest S, Frölich M, et al. Hypocretin (orexin) loss in Alzheimer's disease. Neurobiology of Aging. 2012;33(8):1642-1650.
18. Berhe DF, Gebre AK, Assefa BT. Orexins role in neurodegenerative diseases: From pathogenesis to treatment. Pharmacology Biochemistry and Behavior. 2020;194:172929.Figures
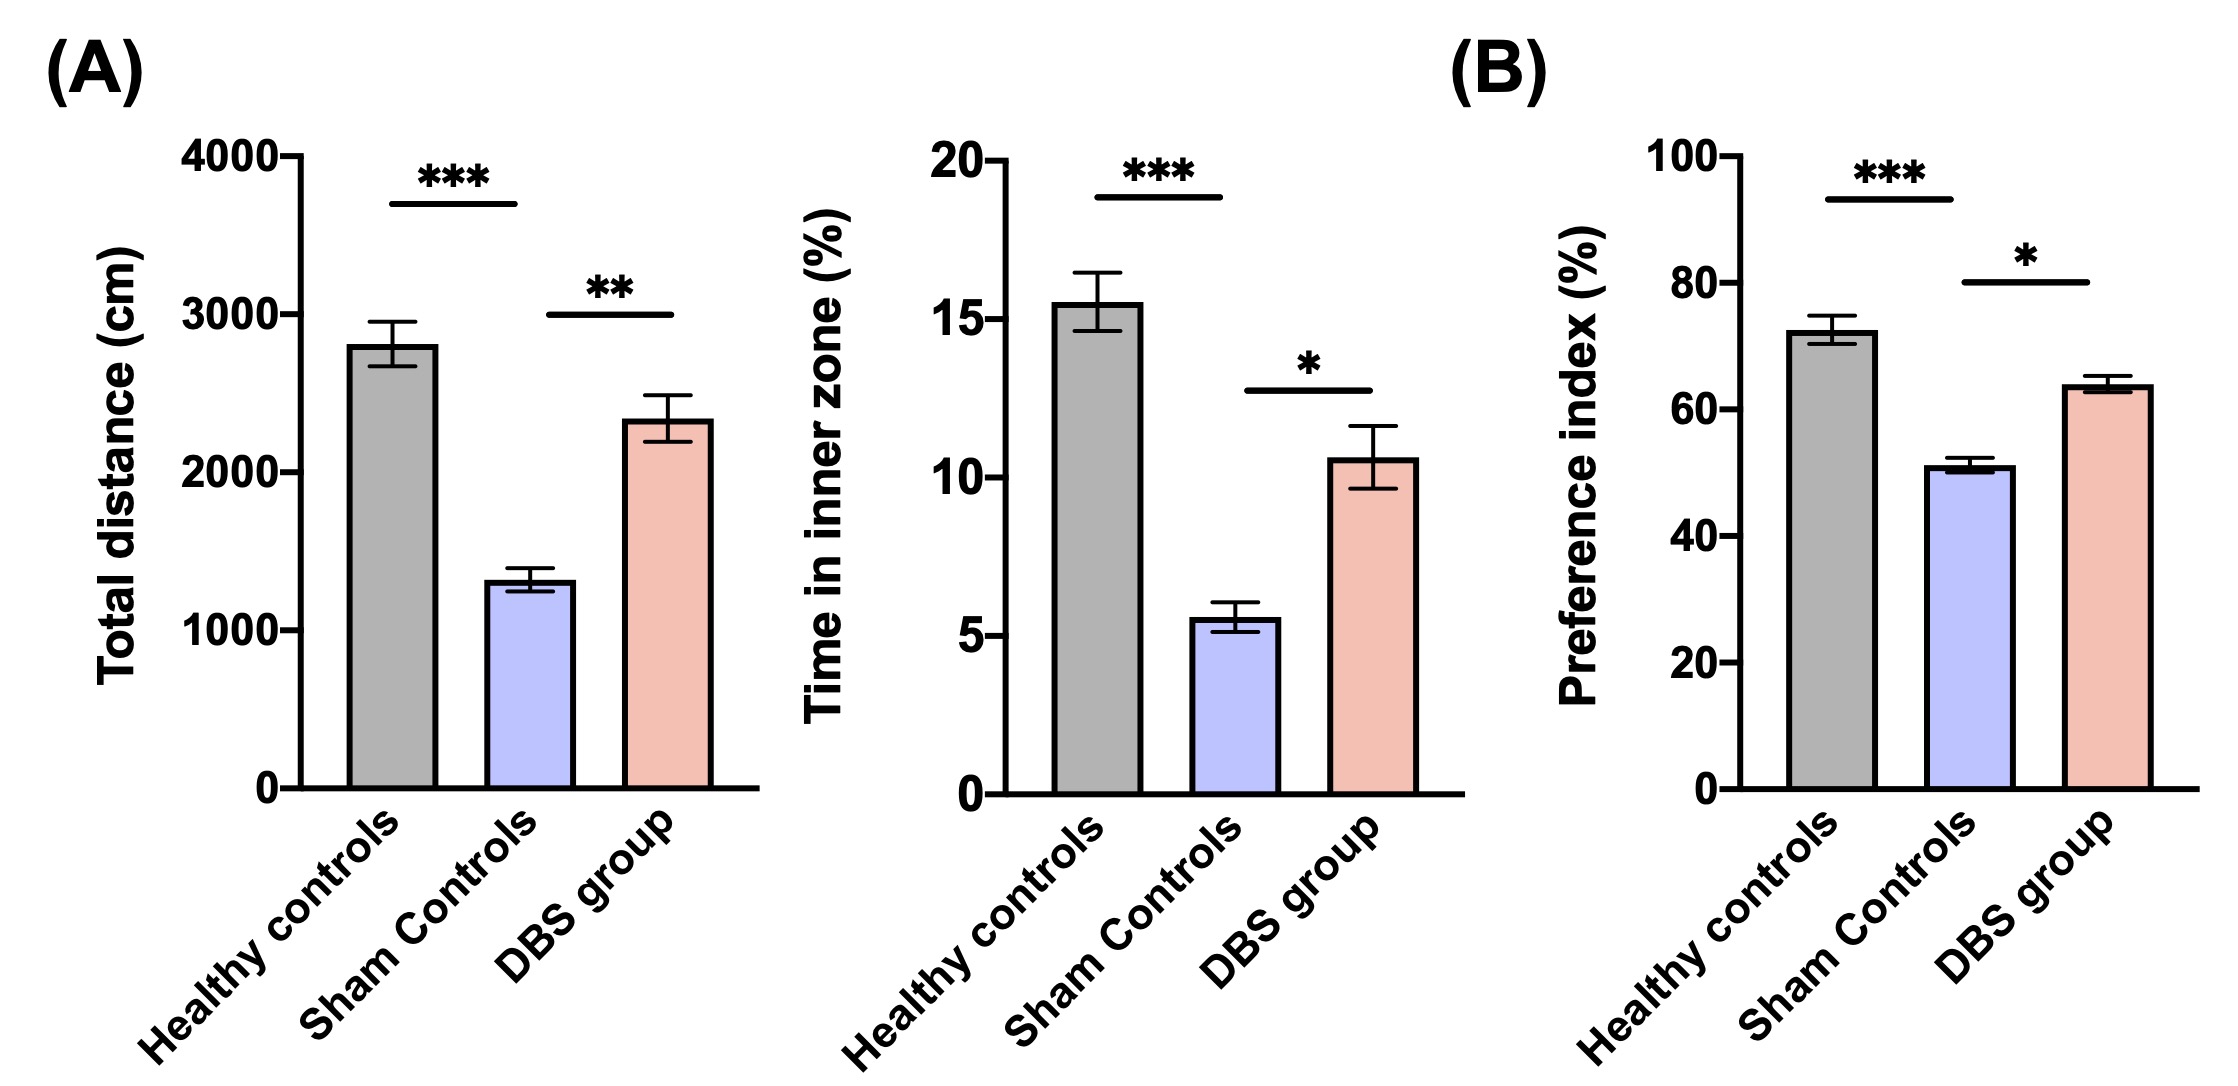
*,**, and *** indicated significant differences with p < 0.05, p < 0.01, and p < 0.001, respectively, and the data were analyzed using the Kruskal-Wallis test (Mean ± SEM).
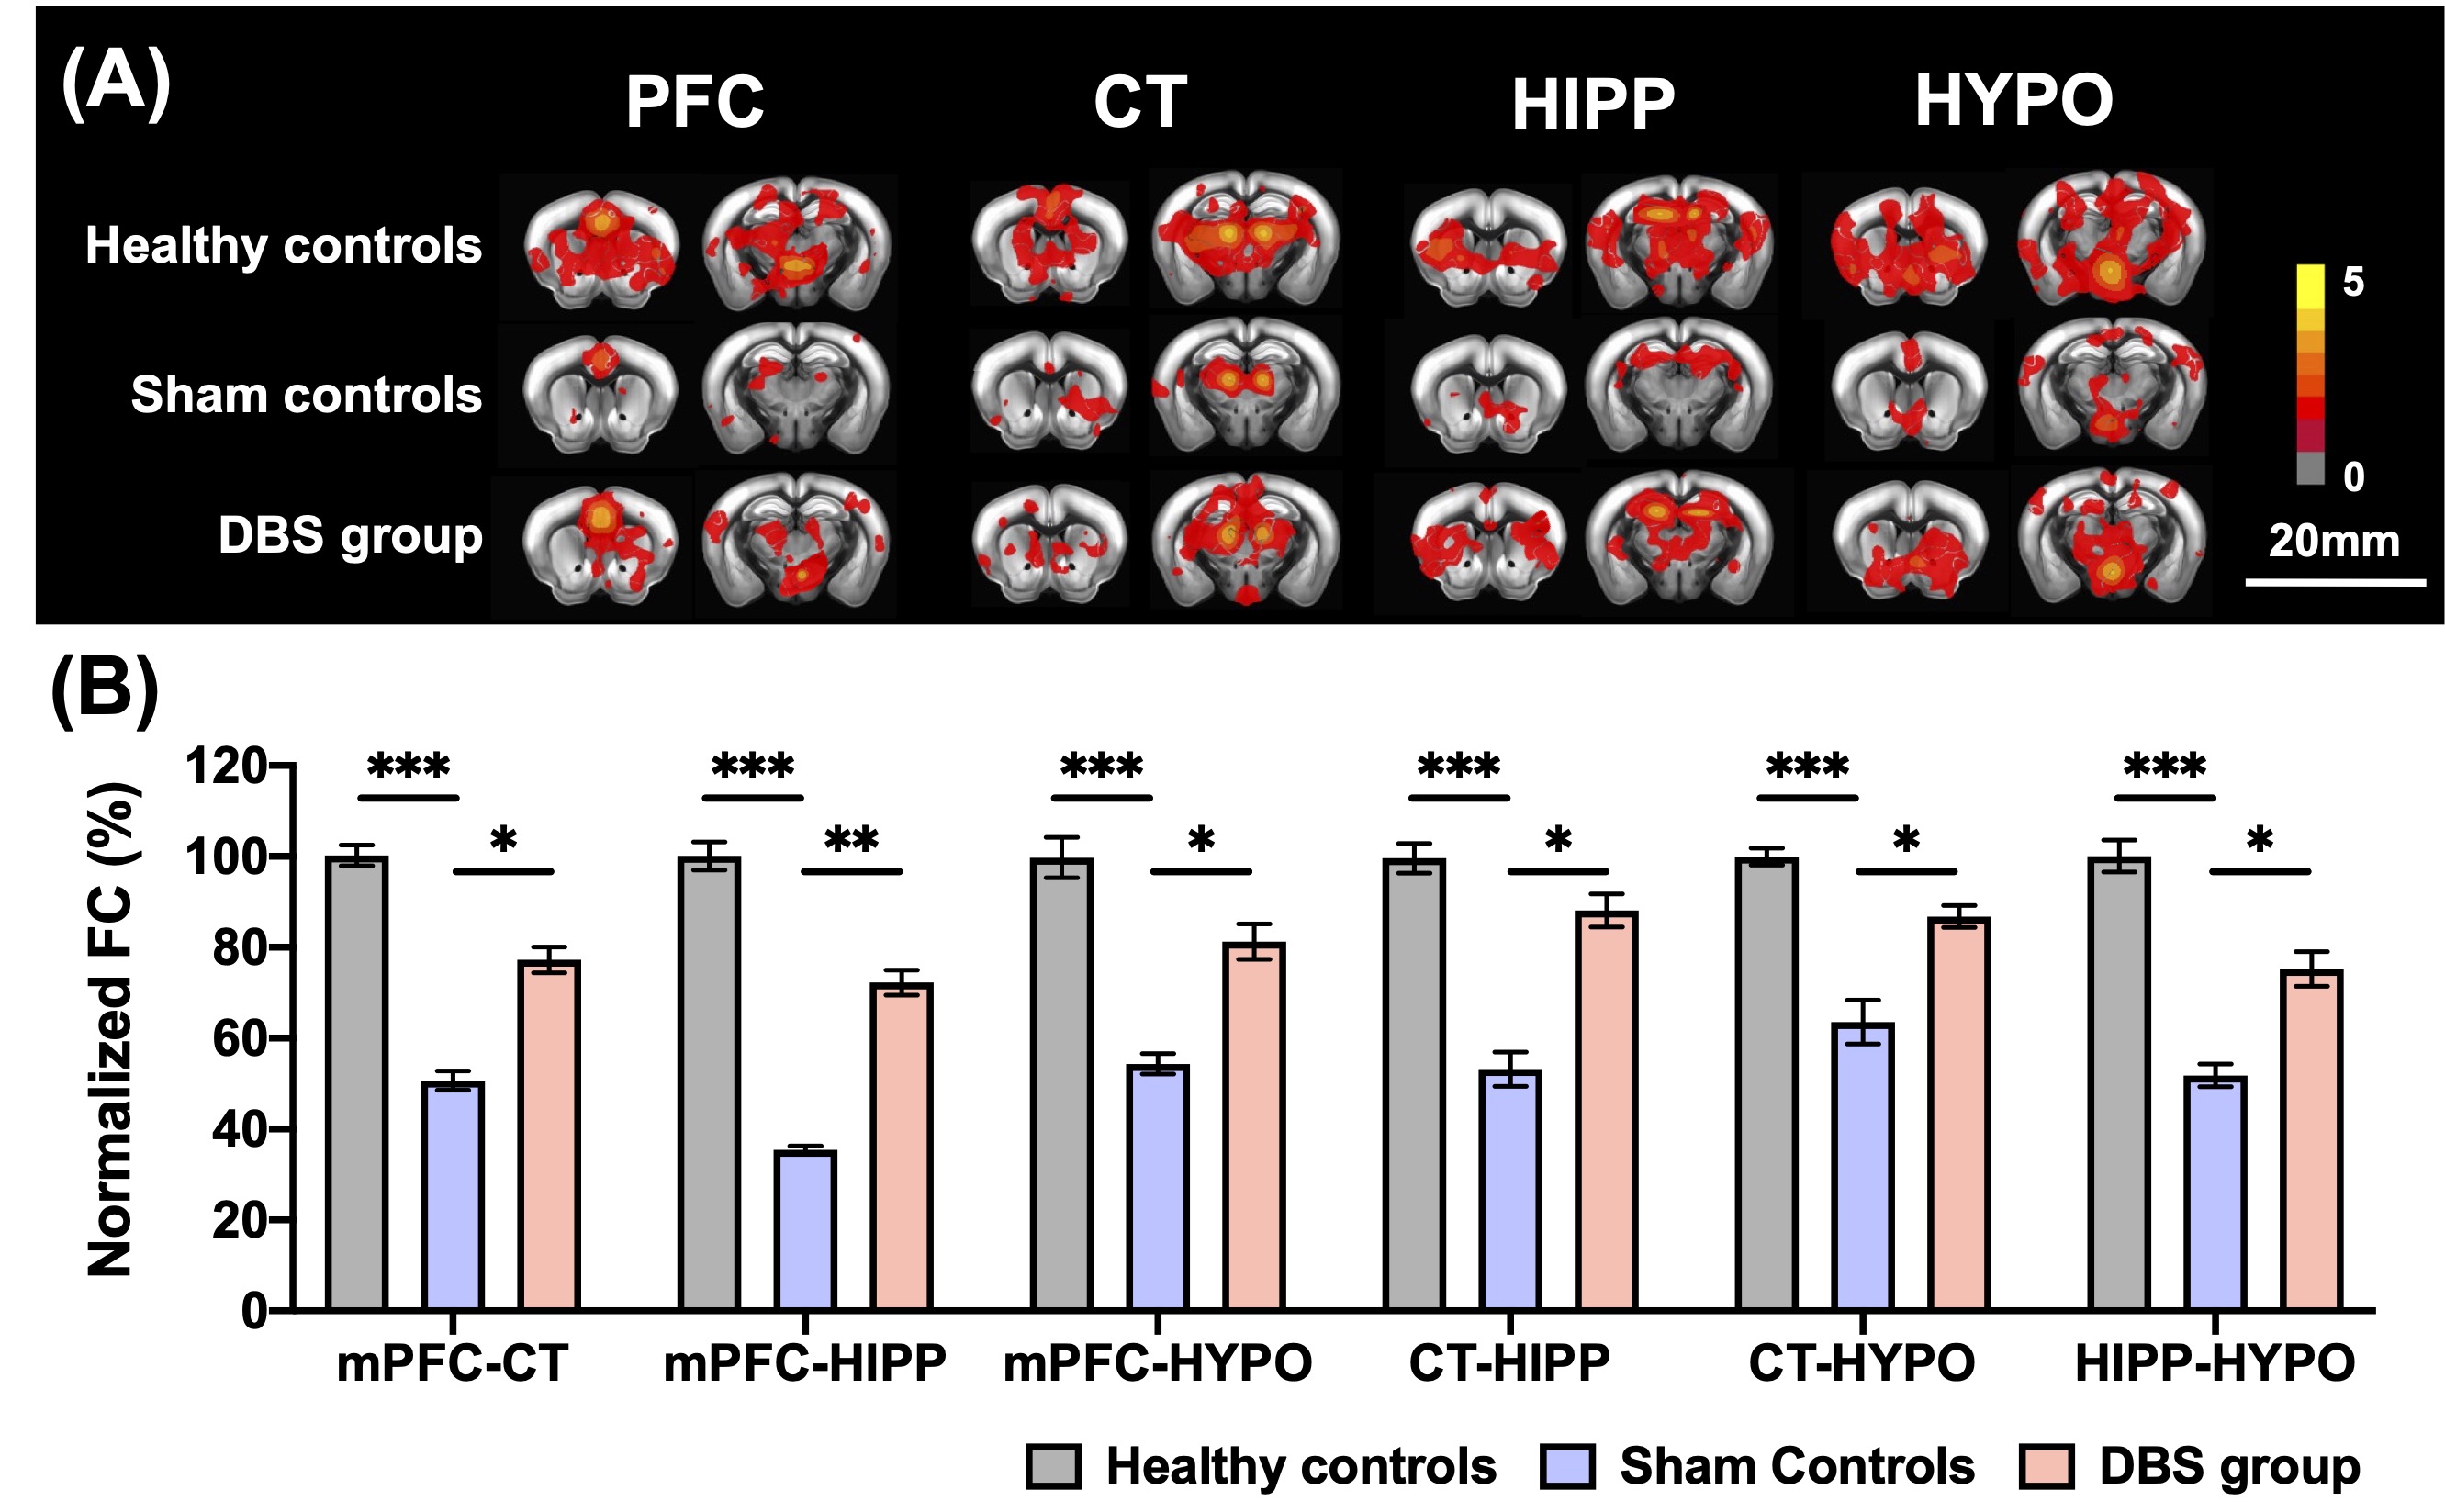
Figure 2. (A) The group comparisons of cross-correlation maps on PFC, CT, HIPP, HYPO for healthy controls, sham controls, and DBS group. (B) The percentage of normalized FC between ROIs to all the other ROIs after CT-iTBS in AD mice. The DBS group showed a widespread enhancement of FC compared with sham controls. * , ** , and *** indicated significant differences with p < 0.05, p < 0.01, and p < 0.001, respectively, and the data were analyzed using the Kruskal-Wallis test (Mean ± SEM).
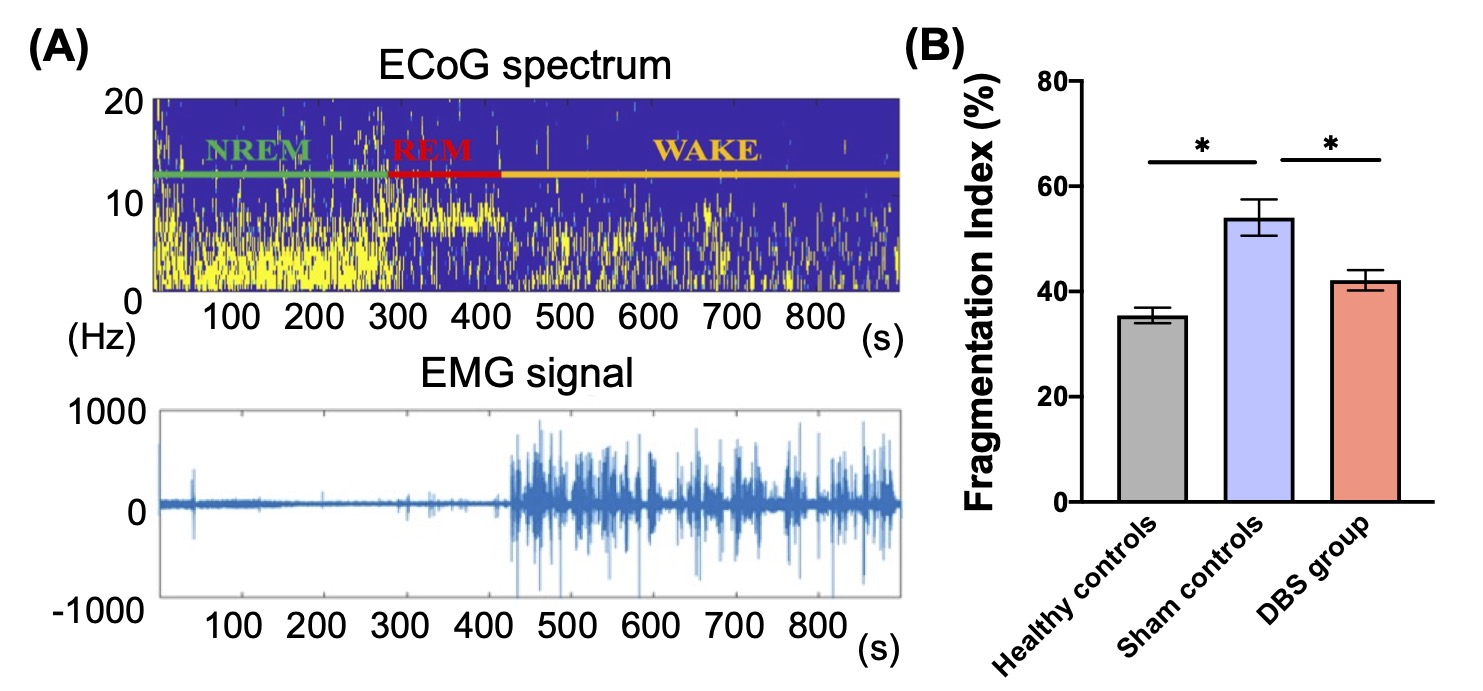
Figure 3. (A) The representative session of the ECoG spectrum and EMG signal were recorded to identify the timing of wake, NREM, and REM sleep states. (B) The fragmentation index in the dark phase showed a significant increase in sham controls compared with healthy controls and DBS group.
* indicated significant differences with p < 0.05, and the data were analyzed using the Kruskal-Wallis test (Mean ± SEM).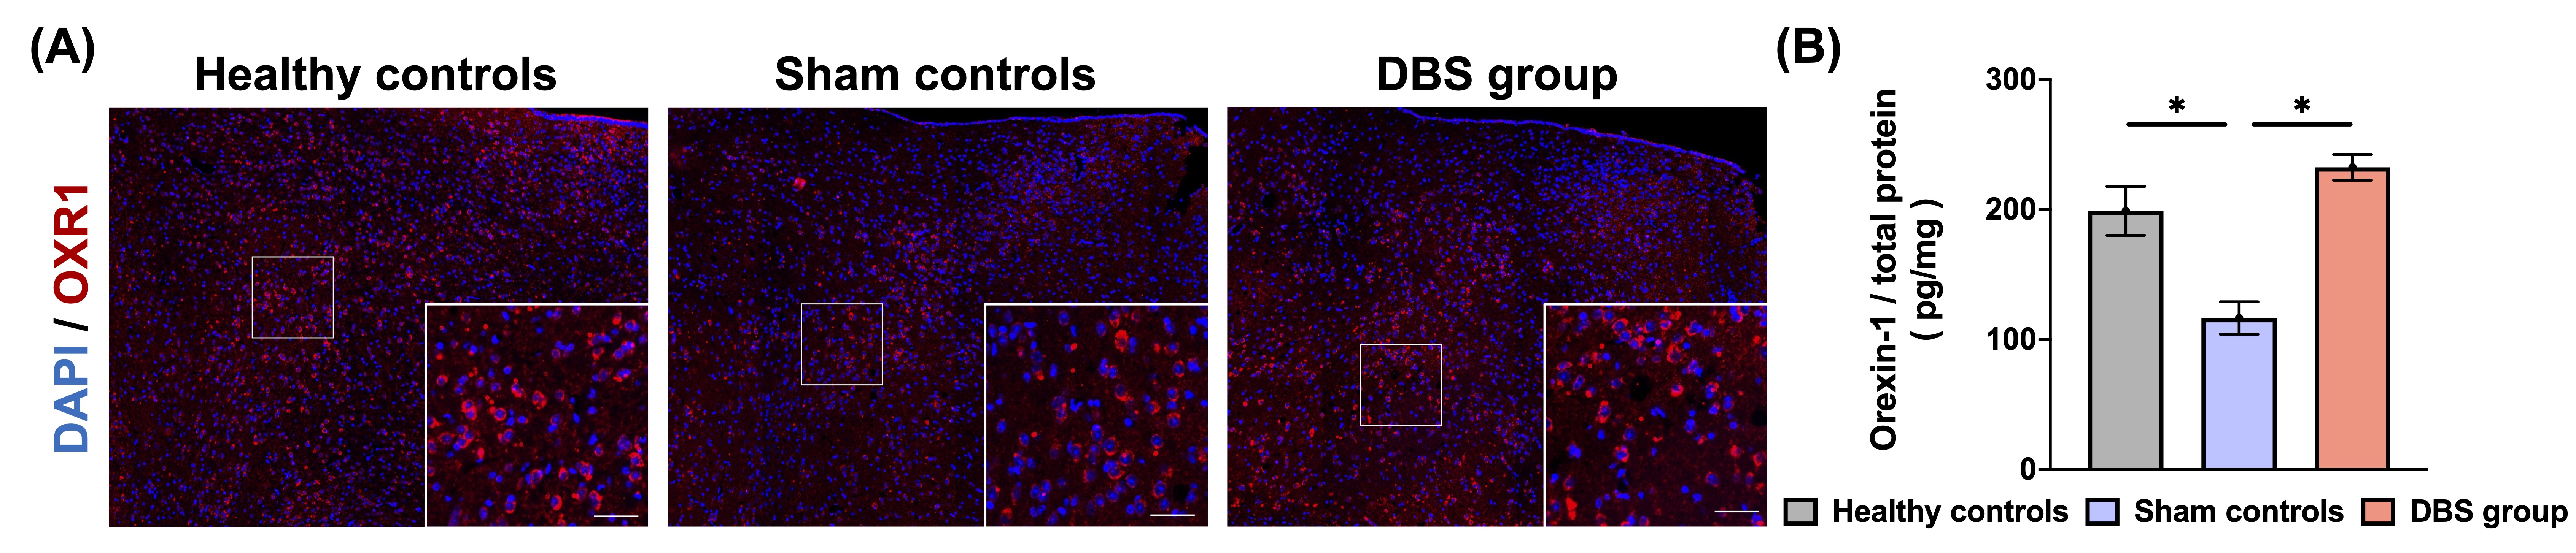
Figure 4. (A) Immunostaining of orexin receptor 1 antibody (OXR1) on HYPO in three groups. Scale bar: 200 𝜇m; inset 40 𝜇m. (B) In DBS group, the concentration of orexin 1 in HYPO was significantly higher than in sham controls.
* indicated significant differences with p < 0.05, and the data were analyzed using the Kruskal-Wallis test (Mean ± SEM).