1114
Decreased global signal topography in recurrent major depressive disorder1Key Laboratory for Biomedical Engineering of Ministry of Education,Department of Biomedical Engineering, College of Biomedical Engineering & Instrument Science, Zhejiang University, Hangzhou, China
Synopsis
Keywords: Functional Connectivity, fMRI (resting state), Major depressive disorder; Global signal topography
Motivation: Global signal (GS) distribution changes remain unclear in major depressive disorder (MDD).
Goal(s): This study aimed to explore abnormal GS topography in MDD, and its underlying structural mechanism and relationship with clinical assessments.
Approach: We used resting-state fMRI and T1-weighted data from the REST-meta-MDD consortium, and calculated the GS correlation (GSCORR) and gray matter volume (GMV).
Results: We found decreased GS topography in sensorimotor networks in recurrent MDD, and altered GMV-GSCORR coupling in cingulo-opercular and frontoparietal/occipital networks in first-episode and recurrent MDD, respectively. The alterations of GS topography in temporal lobe and cerebellum correlated with HAMD/HAMA scores, which were partially mediated by GMV.
Impact: Our findings demonstrated that first-episode and recurrent MDD showed different alterations in GS topography, which were associated with cortical GMV and clinical symptoms of patients, contributing to the understanding of relationship between global and local neuronal activities in MDD.
Introduction
The global signal (GS) is the averaged signal of the gray matter voxels, reflecting an overall fluctuation of the global BOLD activity1. Traditional fMRI studies usually considered GS as a non-neuronal signal2, since it is linked to the artifacts of head motion, hardware, respiratory, and other unknown effects3. However, recent studies have suggested that GS or its topography is related to human cognition and behavior4,5 and clinical diseases1,6.Although previous studies have reported abnormal GS topography in individuals with MDD7,8, they included a small sample size and did not focus on differences between first-episode and recurrent MDD. The present study used the Chinese REST-meta-MDD database to investigate the alteration of GS topography in MDD, and its underlying structural mechanism and association with clinical assessments.
Methods
We screened R-fMRI and T1-weighted data of 821 MDD patients and 757 normal controls (NCs) from the REST-meta-MDD consortium. These subjects were divided into four paired subgroups: 177 recurrent MDD (RMDD) and 392 NCs, 227 first-episode drug-naïve (FEDN) MDD and 388 NCs, 117 FEDN and 72 RMDD, and 100 first-episode on medication (FEM) and 227 FEDN.Individual-level MRI images were preprocessed at each site using a standardized DPARSF processing parameters9. After that, GS was extracted for each subject by averaging the time series of voxels within a whole-brain grey matter mask. Then, gray matter volume (GMV) map for each subject was obtained by segmenting T1-weighted image. Next, the Dos-160 atlas (which includes 160 cortical parcellations and six brain networks)10 was used to extract averaged time series of each region and each network. Their correlations with global signal (GSCORR) were calculated using Pearson correlation coefficient3. Finally, we extracted averaged GMV of each region and each network, and the product of GSCORR and GMV was defined as the structural-functional coupling here.
We used linear mixed models to compare differences between groups in GSCORR, GMV, and their coupling in whole-brain, network and regional levels, respectively. Then, we evaluated correlations between GSCORR and clinical assessments using a partial correlation analysis and explored whether such relationships were modulated by the GMV using a mediation analysis. FDR correction was performed for the p-value.
Results
Figure 1A shows the averaged GSCORR map for each group. RMDD showed decreased GSCORR value in whole brain (Figure 1B) and in occipital network compared with both NC and FEDN (Figure 2). At the regional level (Figure 3), compared with NC, total MDD and RMDD both showed decreased GSCORR in the temporal lobe, precentral gyrus, parietal lobe, and post occipital sulcus. RMDD also showed decreased GSCORR in the ventral prefrontal cortex (vmPFC) and inferior temporal lobe compared with FEDN. The FEDN showed a higher GSCORR value than FEM in the superior parietal lobe.Moreover, total MDD and RMDD both showed decreased GMV-GSCORR couplings in occipital and frontoparietal networks compared with NC, but total MDD and FEDN showed an increase in cingulo-opercular network. FEDN showed increased couplings in sensorimotor network compared with FEM. At the regional level, total MDD altered couplings in frontoparietal area, occipital lobeand cerebellum. No significant difference was observed among subgroups (Figure 4). We observed significant positive correlations between anxiety scores and GSCORR in middle temporal gyrus, and between depression scores and GSCORR in cerebellum and superior temporal gyrus in total MDD patients (Figure 5A). The GMV (GSCORR) in temporal lobe partially modulated the relationship between GSCORR (GMV) in this region and depression score (Figure 5B).
Discussion and Conclusion
This study revealed that RMDD showed decreased GSCORR in whole brain, occipital network, and MDD-related regions compared with NC and FEDN, such findings were not observed between FEDN and NC and FEDN and FEM, suggesting that these changes may be associated with depression severity rather than drug effect. Consistent with previous reports, patients with MDD presented decreased GS topography8, reflecting the decreased whole brain functional coherence in MDD, and RMDD showed reduced global and local efficiency than NC and FEDN11.Moreover, the GMV-GSCORR coupling was disrupted in occipital and frontoparietal networks of FEDN and cingulo-opercular network of RMDD respectively, indicating FEDN and RMDD had different effects on structural-functional couplings of brain networks, which agreed with previous findings12. The correlations between GSCORR and clinical assessments further indicated that GS topography may have a potential as a biomarker to predict depression or anxiety of MDD patients, and its impairments were partially modulated by gray matter structure from mediation analysis. Collectively, first-episode and recurrent MDD showed different alterations in GS topography, related to cortical GMV and clinical symptoms of patients.
Acknowledgements
This work is supported by the Chu Kochen Honors College Foundation.
References
1 Chen P, Zhao K, Zhang H, et al. Altered global signal topography in Alzheimer’s disease. eBioMedicine. 2023;89:104455.
2 Aquino KM, Fulcher BD, Parkes L, Sabaroedin K, Fornito A. Identifying and removing widespread signal deflections from fMRI data: Rethinking the global signal regression problem. NeuroImage. 2020;212:116614.
3 Power JD, Barnes KA, Snyder AZ, Schlaggar BL, Petersen SE. Spurious but systematic correlations in functional connectivity MRI networks arise from subject motion. NeuroImage. 2012;63(2):999.
4 Chen X, Liao X, Dai Z, et al. Topological analyses of functionalconnectomics: a crucial role of global signal removal, brain parcellation, and null models. Hum Brain Mapp. 2018;39(11):4545–4564.
5 Fox MD, Zhang D, Snyder AZ, Raichle ME. The global signal and observed anticorrelated resting state brain networks. J Neurophysiol. 2009;101(6):3270–3283.
6 Gulino G, Scalabrini A, Paolini M, Palladini M, Benedetti F. Global signal topography of the depressive syndrome in bipolar disorder. European Psychiatry. 2023;66(S1):S549-S549.
7 Scalabrini A, Vai B, Poletti S, et al. All roads lead to the default-mode network—global source of DMN abnormalities in major depressive disorder. Neuropsychopharmacol. 2020;45(12):2058-2069.
8 Han S, Wang X, He Z, et al. Decreased static and increased dynamic global signal topography in major depressive disorder. Progress in Neuro-Psychopharmacology and Biological Psychiatry. 2019;94:109665.
9 Yan CG, Chen X, Li L, et al. Reduced default mode network functional connectivity in patients with recurrent major depressive disorder. PNAS. 2019;116(18):9078-9083.
10 Dosenbach N U F, Nardos B, Cohen A L, et al. Prediction of individual brain maturity using fMRI. Science. 2010;329(5997): 1358-1361.
11 Yang H, Chen X, Chen ZB, et al. Disrupted intrinsic functional brain topology in patients with major depressive disorder. Mol Psychiatry. 2021;26(12):7363-7371.
12 Jiang H, Zhu R, Tian S, et al. Structural–functional decoupling predicts suicide attempts in bipolar disorder patients with a current major depressive episode. Neuropsychopharmacol. 2020;45(10):1735-1742.
Figures
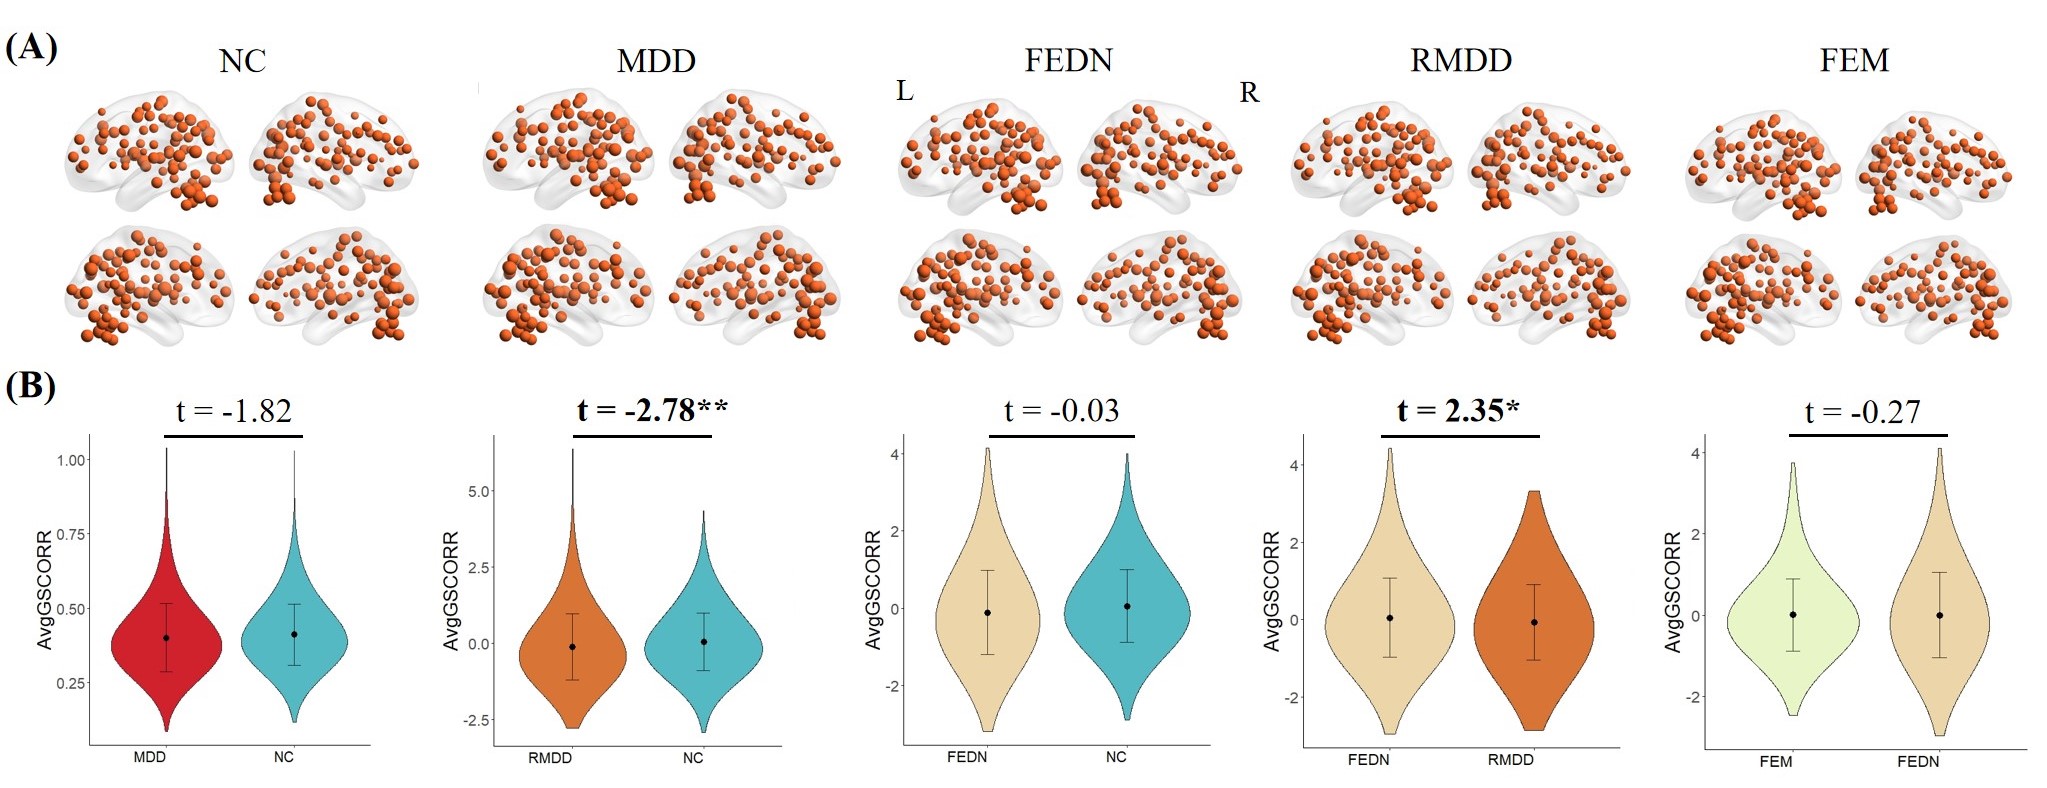
Figure 1 (A) Averaged GSCORR values for each group. The size of the node represents the averaged value of GSCORR in the brain region. (B) GSCORR differences between groups at the whole brain level. The positive and negative t values represented higher and lower GSCORR values in the former group than the latter group, respectively. Recurrent MDD showed decreased GSCORR compared with both NC and FEDN. MDD: major depressive disorder; NC: normal control; FEDN: first-episode drug-naïve; RMDD: recurrent major depressive disorder; FEM: first-episode on medication. *: P < 0.05; **: P < 0.01.
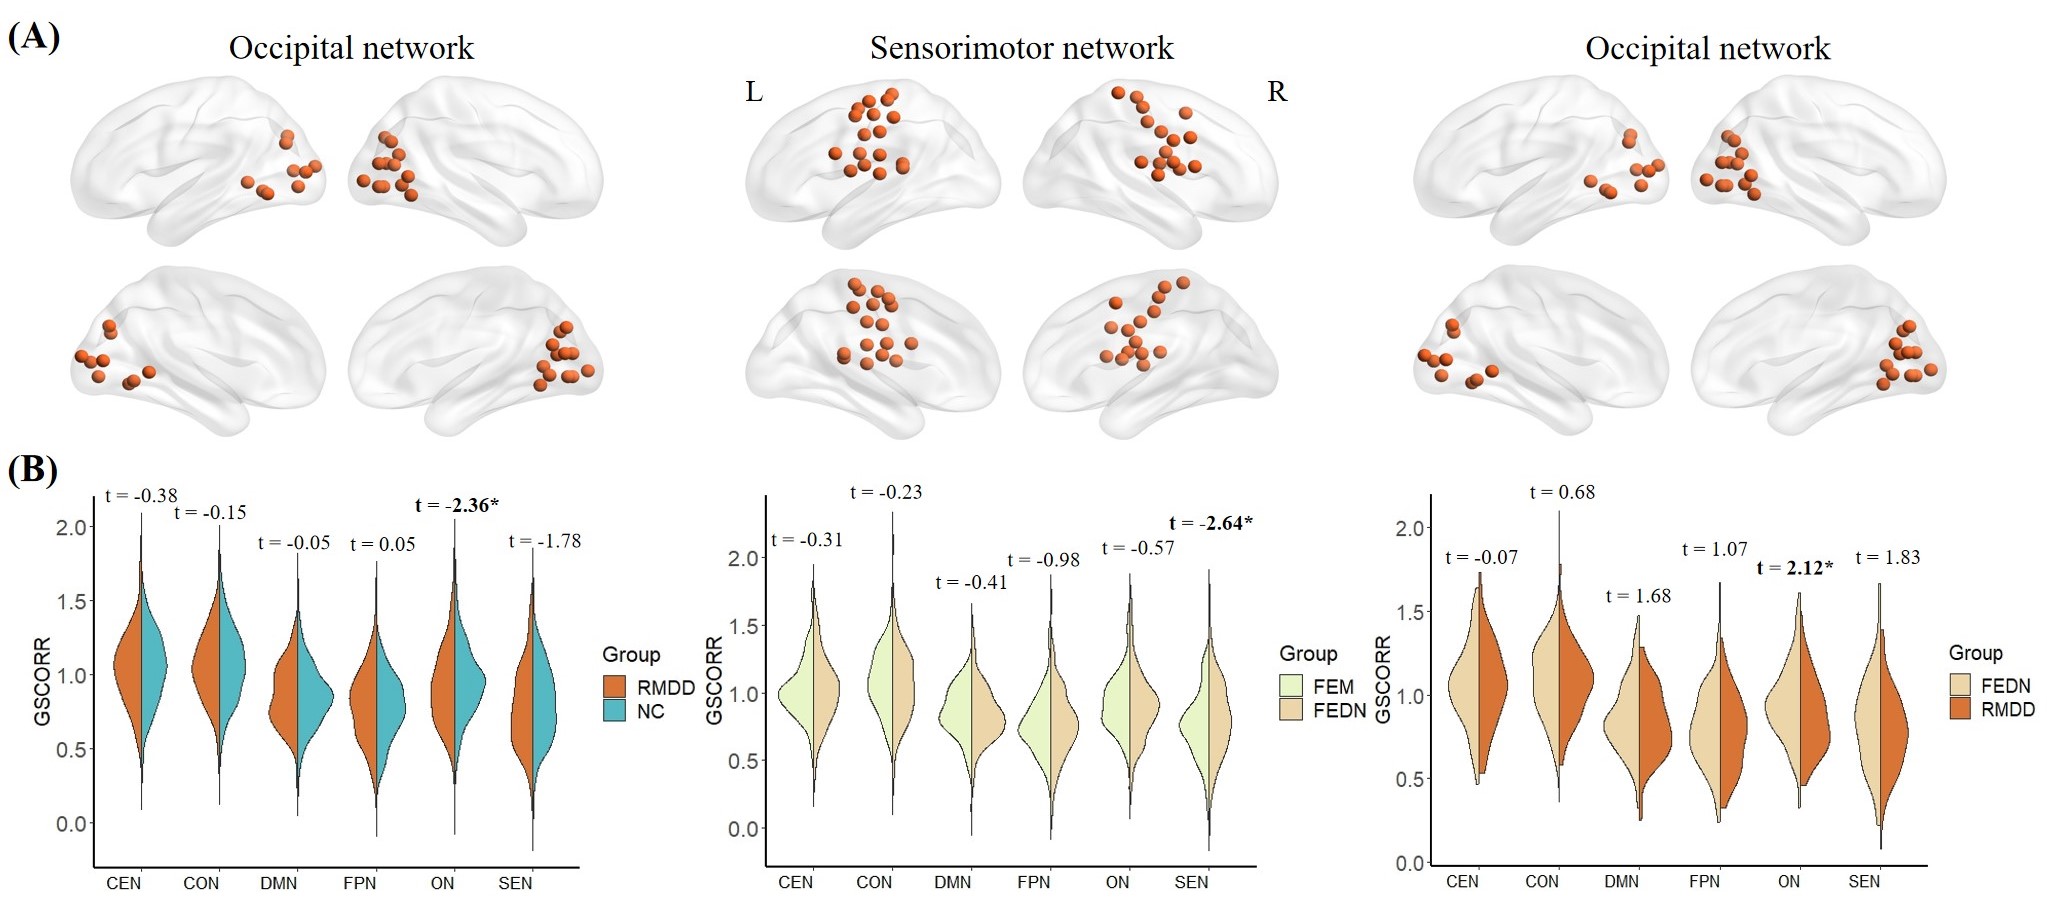
Figure 2 (A) Illustration of occipital and sensorimotor networks. (B) GSCORR differences between groups at the brain network level. The violins showed distributions of GSCORR values for each network in each group. RMDD showed decreased GSCORR in the occipital network compared with both NC and FEDN, while FEM showed decreased GSCORR in the sensorimotor network compared with FEDN. CEN: cerebellum network; CON: cingulo-opercular network; DMN: default mode network; FPN: frontal-parietal network; ON: occipital network; SEN: sensorimotor network.*: P < 0.05.
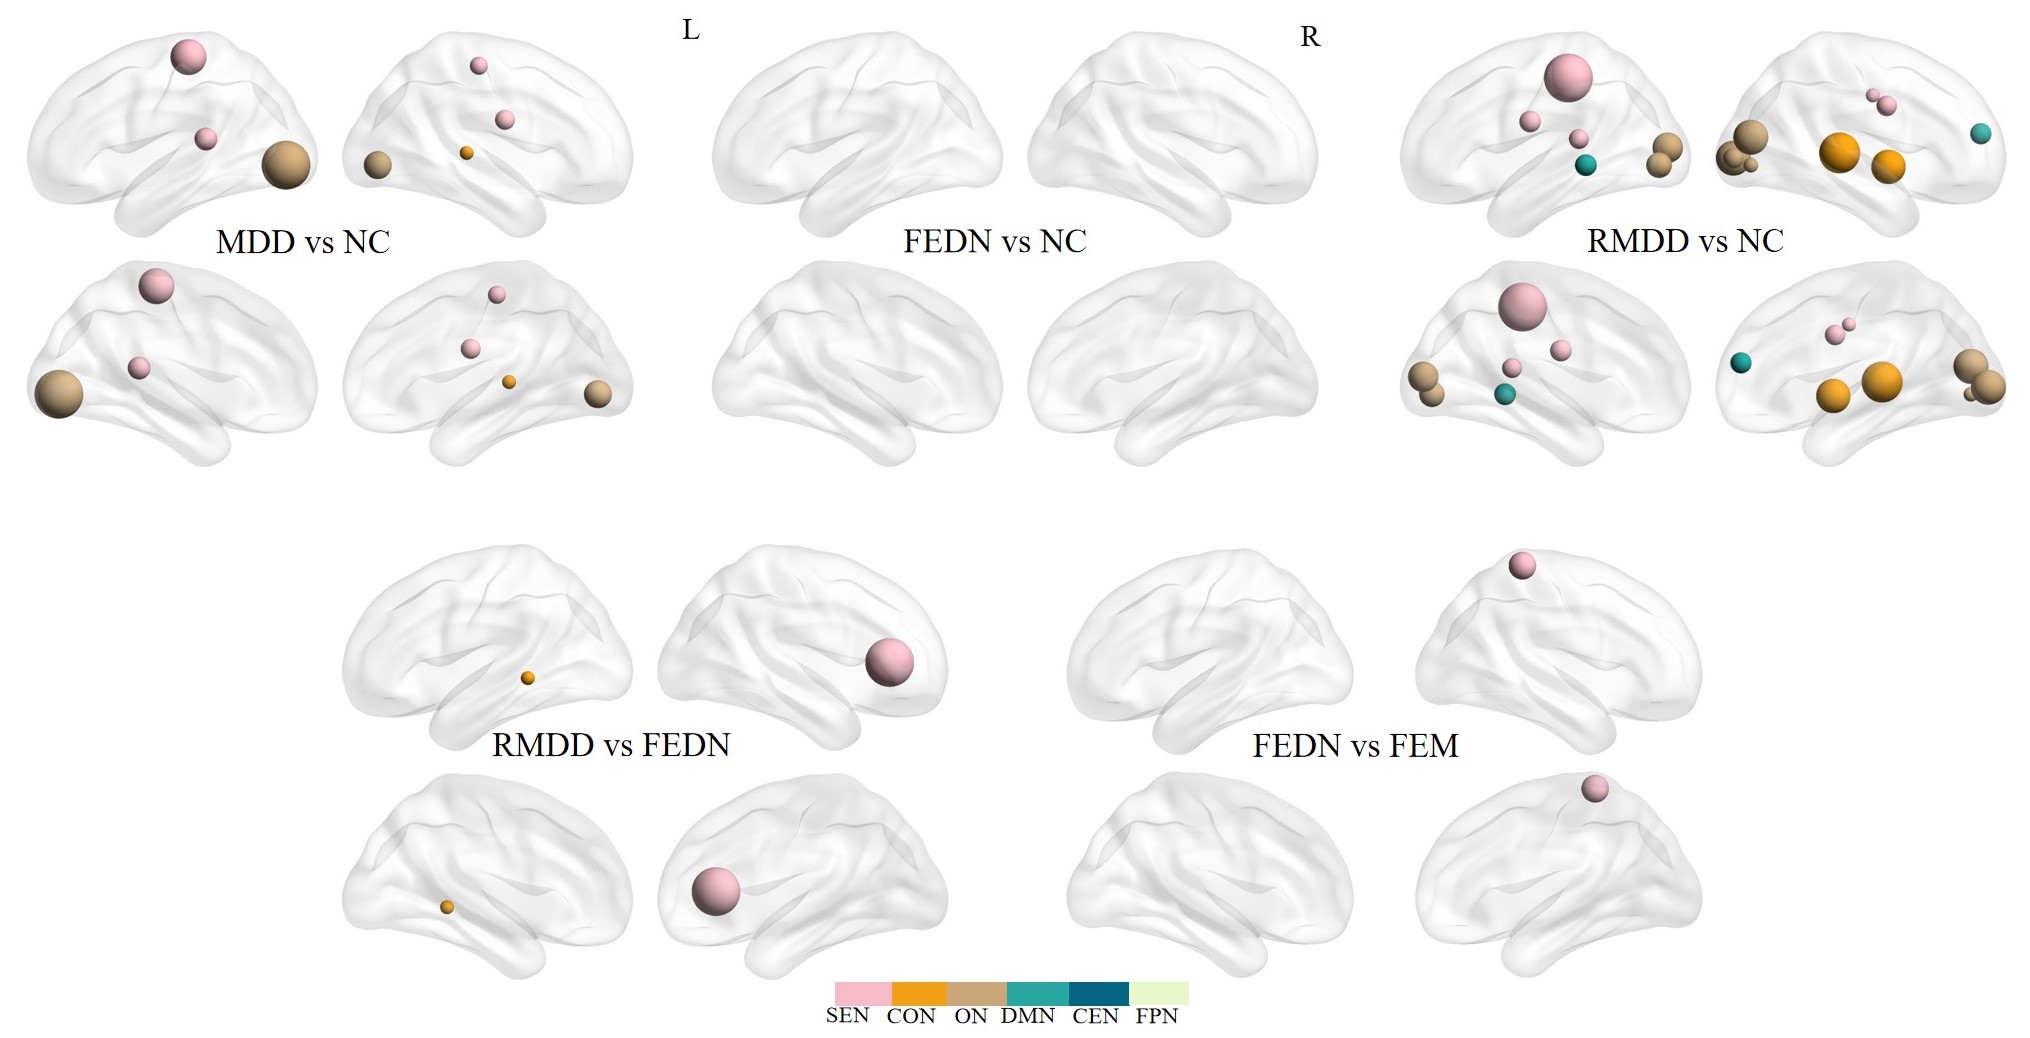
Figure 3 GSCORR differences between groups at the regional level. The regions that survived after FDR correction (P < 0.05) are shown. The size of the nodes represents the t-value derived from LMM. Total MDD and RMDD both showed decreased GSCORR in regions within sensorimotor and occipital networks, and RMDD also showed reduced GSCORR in regions within the cingulo-opercular network and default mode network compared with NC. FEDN showed increased GSCORR in regions within sensorimotor and occipital networks compared with FEM and RMDD.
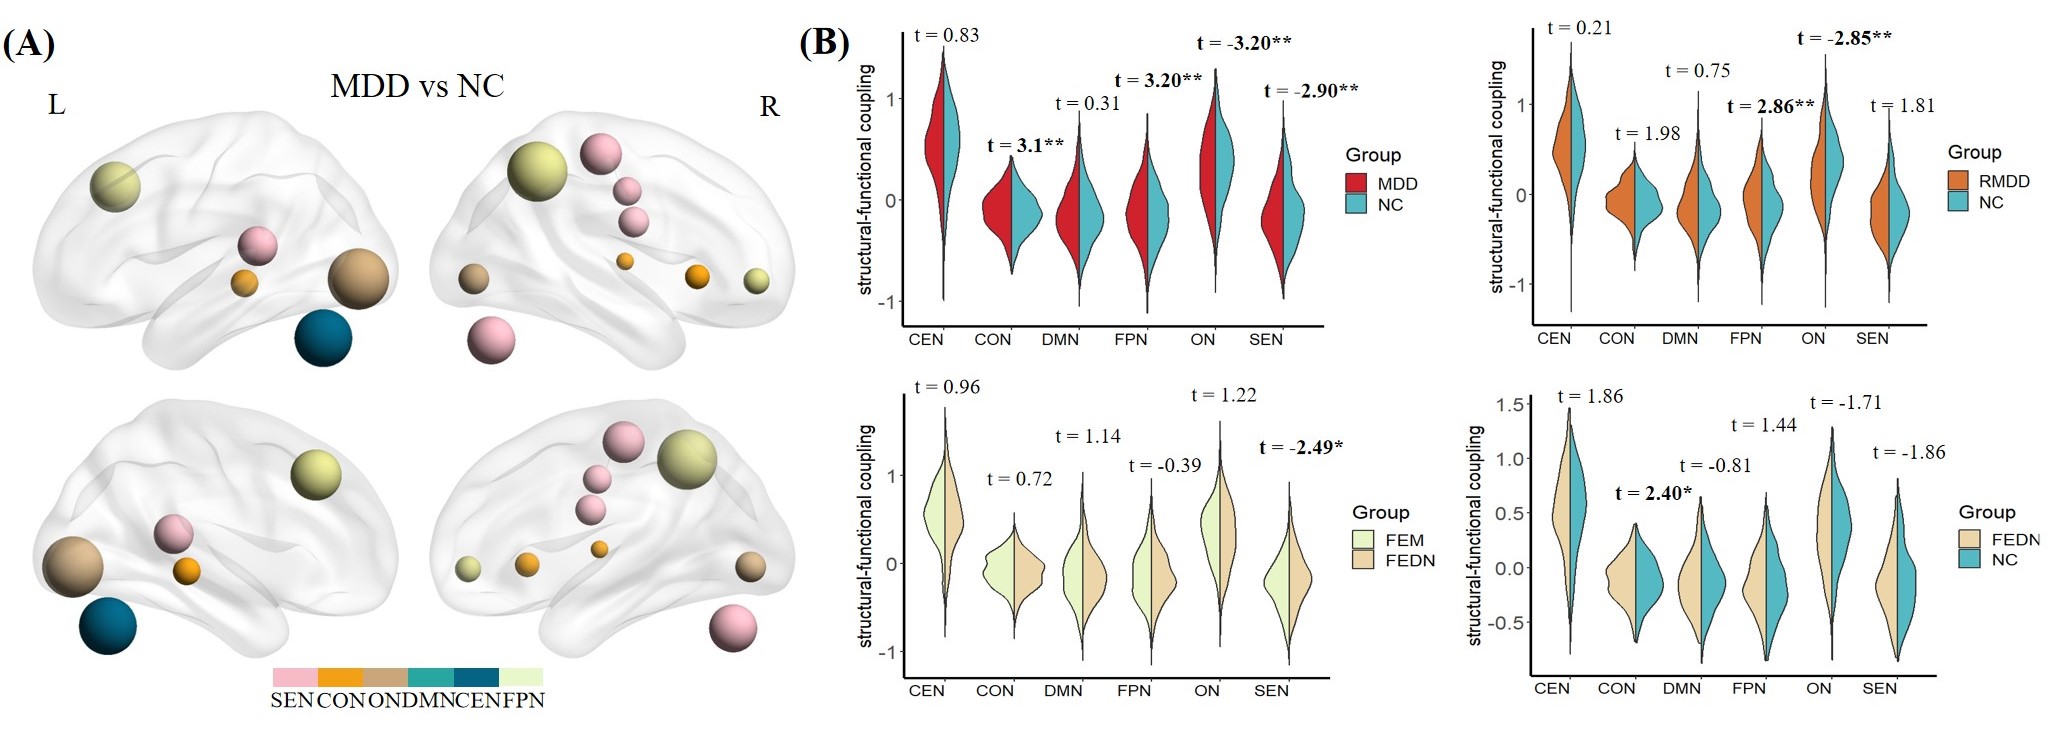
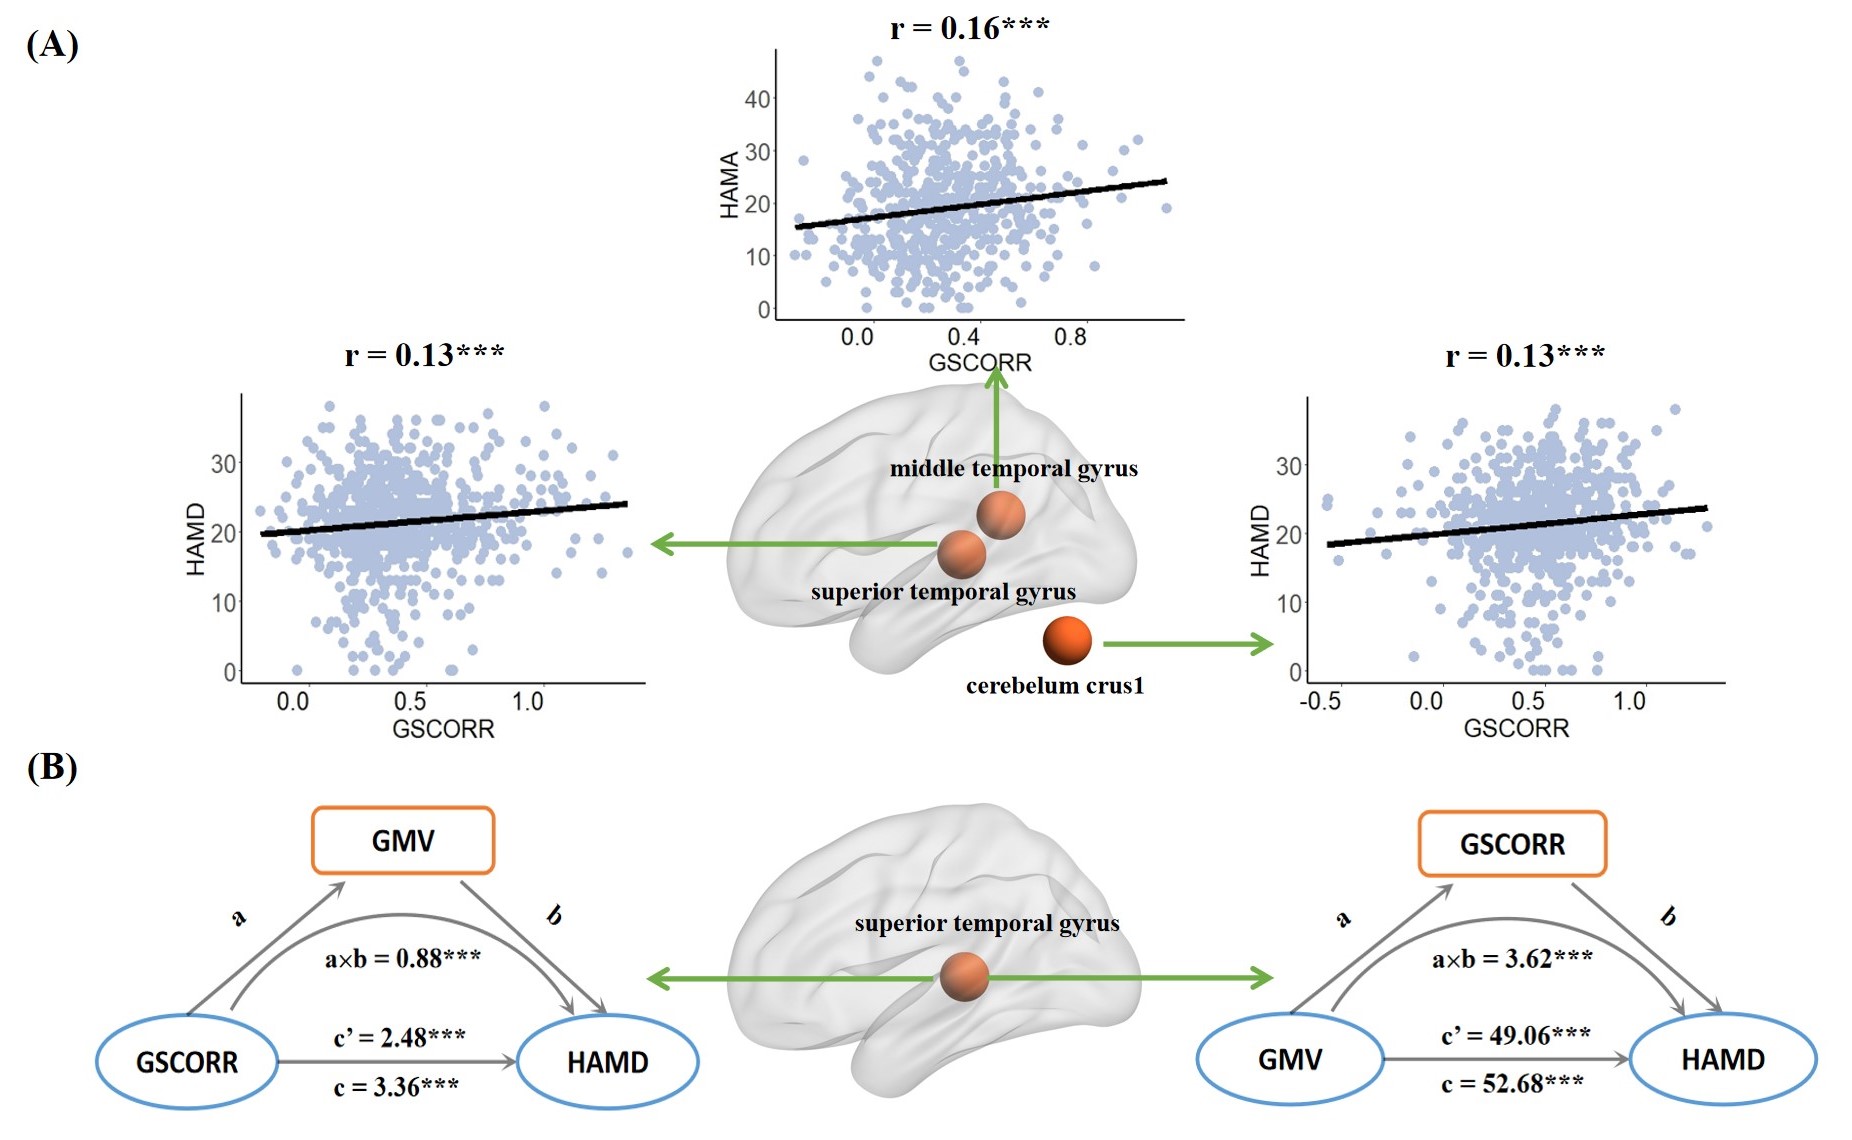
Figure 5 (A) Relationships between HAMD/HAMA scores and GSCORR. We observed significant positive correlations between HAMD score and GSCORR in superior temporal lobe and cerebellum, and between HAMA score and GSCORR in middle temporal lobe across total MDD patients. (B) Mediation effect. The GMV/GSCORR in the superior temporal region showed an indirect effect on the relationship between GSCORR/GMV in this region and HAMD score. ***: P < 0.001.