1111
Integration of myelin-sensitive biophysical features in virtual brain models: towards healthy and pathological Brain Digital Twins1Department of Brain & Behavioral Sciences, University of Pavia, Pavia, Italy, 2Digital Neuroscience Centre, IRCCS Mondino Foundation, Pavia, Italy, 3NMR Research Unit, Queen Square MS Centre, Department of Neuroinflammation, UCL Queen Square Institute of Neurology, Faculty of Brain Sciences, University College London, London, United Kingdom, 4Radiomics Group, Vall d’Hebron Institute of Oncology, Vall d’Hebron Barcelona Hospital Campus, Barcelona, Spain, 5Department of Medical Physics and Biomedical Engineering, Centre for Medical Image Computing (CMIC), University College London, London, United Kingdom, 6E-Health Center, Universitat Oberta de Catalunya, Barcelona, Spain, 7Department of Clinical and Experimental Epilepsy, UCL Queen Square Institute of Neurology, Faculty of Brain Sciences, University College London, London, United Kingdom
Synopsis
Keywords: Functional Connectivity, Brain Connectivity, Brain modeling, The Virtual Brain, conduction velocity
Motivation: The Virtual Brain (TVB) is a neuroinformatic platform used to perform brain dynamic simulations integrating subject-specific imaging data. In standard TVB the input conduction velocity is fixed, making it insensitive to local effective measures of myelin content.
Goal(s): Here we parameterized signal conduction velocity for TVB simulations.
Approach: Considering myelin role in efficient neural conduction, myelin measures were integrated into TVB.
Results: Making TVB sensitive to myelin content highlights variations in simulation outcomes with potential improvements in capturing spatiotemporal dynamics of brain activity. This advancement opens perspectives for realizing more accurate subject-specific simulations, representing a new step towards brain digital twinning.
Impact: Brain Digital Twin technologies will transform personalized medicine, providing a better understanding of pathophysiological underpinnings of diseases. Our study demonstrates how simulating brain activity with The Virtual Brain model improves when integrating subject-specific neural conduction values, calculated from myelin measures.
Introduction
The Virtual Brain (TVB) is a neuroinformatic platform able to perform whole-brain dynamic simulations1,2. TVB integrates large-scale subject-specific features with mesoscopic models of brain activity, promoting personalized medicine towards the generation of Brain Digital Twins3.One of TVB inputs is conduction velocity (CV), used to calculate the signal propagation delay along axons. Typically, CV is fixed and is not related to myelin content, even if myelin plays a crucial role in efficient neuronal conduction4,5.
This study used diffusion and myelin-sensitive (i.e., quantitative magnetization transfer, qMT6,7) MRI techniques to parameterize CV in TVB simulations, aiming to improve TVB results and assess sensitivity to pathological changes against the standard TVB. These evaluations were performed in a cohort of patients who experienced long-COVID symptoms8.
Methods
Subjects and MRI acquisitionDemographic and MRI details are summarized in Figure1. All subjects underwent an MRI protocol using a Philips Ingenia 3T scanner.
Conduction velocity estimation
Images were preprocessed to reduce noise and remove artefacts. Figure2 shows the pipeline for calculating g-ratio7,9 maps from qMT scans10,11 and maps from diffusion-weighted data fitted with Neurite Orientation Dispersion and Density Imaging12. CV is related to g-ratio (g) through13: $$CV = {p}\times{AxD}\times{\sqrt{-\lg{(g)}}} $$
where p = 16.994. The axonal diameter (AxD) is obtained from an open source atlas14.
Connectivity matrices creation
An ad-hoc atlas of 124 regions was created15. A 30 million streamlines whole-brain anatomically-constrained probabilistic tractography was executed16 and combined with the parcellation atlas to compute subject-specific structural connectivity matrices. Three matrices were created, weighted by connection strength (i.e. number of streamlines), connection distance, and CV. A personalized conduction delay matrix was obtained from distance and CV matrices (Figure3).
Resting state fMRI volumes were combined with the ad-hoc atlas to extract BOLD time-series for each node. Subject-specific experimental static functional connectivity (FC) and dynamic functional connectivity (FCD) matrices were reconstructed17.
TVB simulation
Whole-brain activity was simulated through the Wong-Wang model18. Simulations were performed with both standard TVB input (connection strength and distance matrices) and myelin-integrated input (connection strength and delay matrices).
TVB simulations provided parameters describing the excitatory/inhibitory (E/I) balance, including global coupling (G), inhibitory (Ji) and excitatory (JNMDA) synaptic strength, and recurrent excitation (w+). These parameters were extracted with TVB model optimization (Figure3), which consisted of an iterative parameter tuning to minimize the following cost function: $$cost = (1-PCC)+KS$$
where PCC is the Pearson correlation coefficient between empirical and simulated FC, and KS is the Kolmogorov-Smirnov distance between empirical and simulated FCD.
Statistical analysis
After confirming data normality, differences between parameters extracted with standard TVB and myelin-integrated TVB were assessed with a paired t-test and linear correlation analysis. A General Linear Model (GLM) test (covariate: age) was performed between healthy controls (HC) and long-COVID patients to evaluate clinical sensitivity of the optimized parameters, for both TVBs.
Results
No significant differences were detected between PCC, KS and the cost function computed with the two TVB methods, even if KS was generally lower for myelin-integrated TVB (Figure4). Furthermore, the paired t-test revealed that only Ji was different (p<0.05) between the two TVB methods, and that the extracted parameters were not correlated (R2<0.1, Figure5). When performing the GLM test, no parameters showed significant differences between groups.Discussion and Conclusion
For the first time, personalized conduction delays have been integrated in TVB simulations. Myelin-integrated TVB shows a trend of improved KS (i.e., lower) scores compared to the standard TVB suggesting that CV parameterization enhances the ability to capture FC temporal changes. Furthermore, parameters extracted with standard TVB and myelin-integrated TVB are different (i.e., Ji) and do not show a correlation between them. These results demonstrate that personalized delays influence the E/I balance, and indicate that personalized CVs particularly impact on inhibition. Future work should explore the physiological significance of Ji variation. Moreover, the integration of subject-specific AxD maps should improve the ability of TVB to capture spatiotemporal dynamics of basal activity, potentially impacting on the pathological sensitivity of the extracted parameters. The fact that neither TVB methods show significant differences between HC and long-COVID patients could be due to the high level of heterogeneity typical of the long-COVID condition. Given that there is a suggestion of myelin being affected in long-COVID patients19, we will apply this myelin-specific approach to a larger sample size.In conclusion, the present study shows that integrating subject-specific myelin measures (i.e., CV parameterization) into TVB improves spatiotemporal representation of basal activity, impacting on the E/I balance. Thus, tailoring relevant features to regulate internodal communication can be a step towards the realization of the Brain Digital Twin.
Acknowledgements
EL is a PhD student enrolled in the National PhD in Artificial Intelligence, XXXVIII cycle, course on Health and life sciences, organized by Università Campus Bio-Medico di Roma. EG receives funding from TDC Technology Dedicated to Care. FG receives the support of a fellowship from ”la Caixa” Foundation (ID 100010434). The fellowship code is “LCF/BQ/PR22/11920010”. FP received a Guarantors of Brain fellowship 2017–2020. FP is supported by the National Institute for Health Research (NIHR), the Biomedical Research Centre initiative at University College London Hospitals (UCLH). RS receives funding from the BRC (BRC1130/HEI/RS/11041). H2020 Research and Innovation Action Grants Human Brain Project 785907 and 945539 (SGA2 and SGA3) to ED'A and FP. Moreover, the project was supported by the MNL Project “Local Neuronal Microcircuits” of the Centro Fermi (Rome, Italy) to ED'A. This work was also supported by #NEXTGENERATIONEU (NGEU) and funded by the Ministry of University and Research (MUR), National Recovery and Resilience Plan (NRRP), project MNESYS (PE0000006) - A Multiscale integrated approach to the study of the nervous system in health and disease (DN. 1553 11.10.2022). CGWK receives funding from Horizon2020 (Research and Innovation Action Grants Human Brain Project 945539 (SGA3)), BRC (#BRC704/CAP/CGW), MRC (#MR/S026088/1), Ataxia UK, Rosetrees Trust (#PGL22/100041 and #PGL21/10079). CGWK is a shareholder in Queen Square Analytics Ltd.
References
1. Sanzleon, P. et al. The virtual brain: A simulator of primate brain network dynamics. Front Neuroinform 7, (2013).
2. Schirner, M. et al. Brain Modelling as a Service: The Virtual Brain on EBRAINS. ArXiv preprint (2021).
3. D’Angelo, E. & Jirsa, V. The quest for multiscale brain modeling. Trends Neurosci 45, 777–790 (2022).
4. Drakesmith, M. et al. Estimating axon conduction velocity in vivo from microstructural MRI. Neuroimage203, (2019).
5. Mancini, M., Tian, Q., Fan, Q., Cercignani, M. & Huang, S. Y. Dissecting whole-brain conduction delays through MRI microstructural measures. Brain Struct Funct 226, 2651–2663 (2021).
6. Wolff, S. D. & S, B. R. "Magnetization transfer contrast (MTC) and tissue water proton relaxation in vivo. Magn Reson Med 10, 135–144 (1989).
7. Mancini, M. et al. An interactive meta-analysis of MRI biomarkers of Myelin. Elife 9, 1–23 (2020).
8. Soriano, J. B., Murthy, S., Marshall, J. C., Relan, P. & Diaz, J. V. A clinical case definition of post-COVID-19 condition by a Delphi consensus. The Lancet Infectious Diseases vol. 22 e102–e107 Preprint at https://doi.org/10.1016/S1473-3099(21)00703-9 (2022).
9. Stikov, N. et al. In vivo histology of the myelin g-ratio with magnetic resonance imaging. Neuroimage 118, 397–405 (2015).
10. Battiston, M. et al. Fast bound pool fraction mapping via steady-state magnetization transfer saturation using single-shot EPI. Magn Reson Med 82, 1025–1040 (2019).
11. Cercignani, M. et al. Characterizing axonal myelination within the healthy population: a tract-by-tract mapping of effects of age and gender on the fiber g-ratio. Neurobiol Aging 49, 109–118 (2017).
12. Fick, R. H. J., Wassermann, D. & Deriche, R. The Dmipy Toolbox: Diffusion MRI Multi-Compartment Modeling and Microstructure Recovery Made Easy. Front Neuroinform 13, (2019).
13. Rushton, W. A. H. A Theory of the Effects of Fibre Size in Medullated Nerve. Journal of Physiology 115, 101–122 (1951).
14. Gast, H. et al. A Method for In-Vivo Mapping of Axonal Diameter Distributions in the Human Brain Using Diffusion-Based Axonal Spectrum Imaging (AxSI). Neuroinformatics 21, 469–482 (2023).
15. Monteverdi, A. et al. Subject-specific features of excitation/inhibition profiles in neurodegenerative diseases. Front Aging Neurosci 14, (2022).
16. Smith, R. E., Tournier, J. D., Calamante, F. & Connelly, A. Anatomically-constrained tractography: Improved diffusion MRI streamlines tractography through effective use of anatomical information. Neuroimage 62, 1924–1938 (2012).
17. Hansen, E. C. A., Battaglia, D., Spiegler, A., Deco, G. & Jirsa, V. K. Functional connectivity dynamics: Modeling the switching behavior of the resting state. Neuroimage 105, 525–535 (2015).
18. Deco, G. et al. How local excitation-inhibition ratio impacts the whole brain dynamics. Journal of Neuroscience 34, 7886–7898 (2014).
19. Fernández-Castañeda, A. et al. Mild respiratory COVID can cause multi-lineage neural cell and myelin dysregulation. Cell 185, 2452-2468.e16 (2022).
Figures
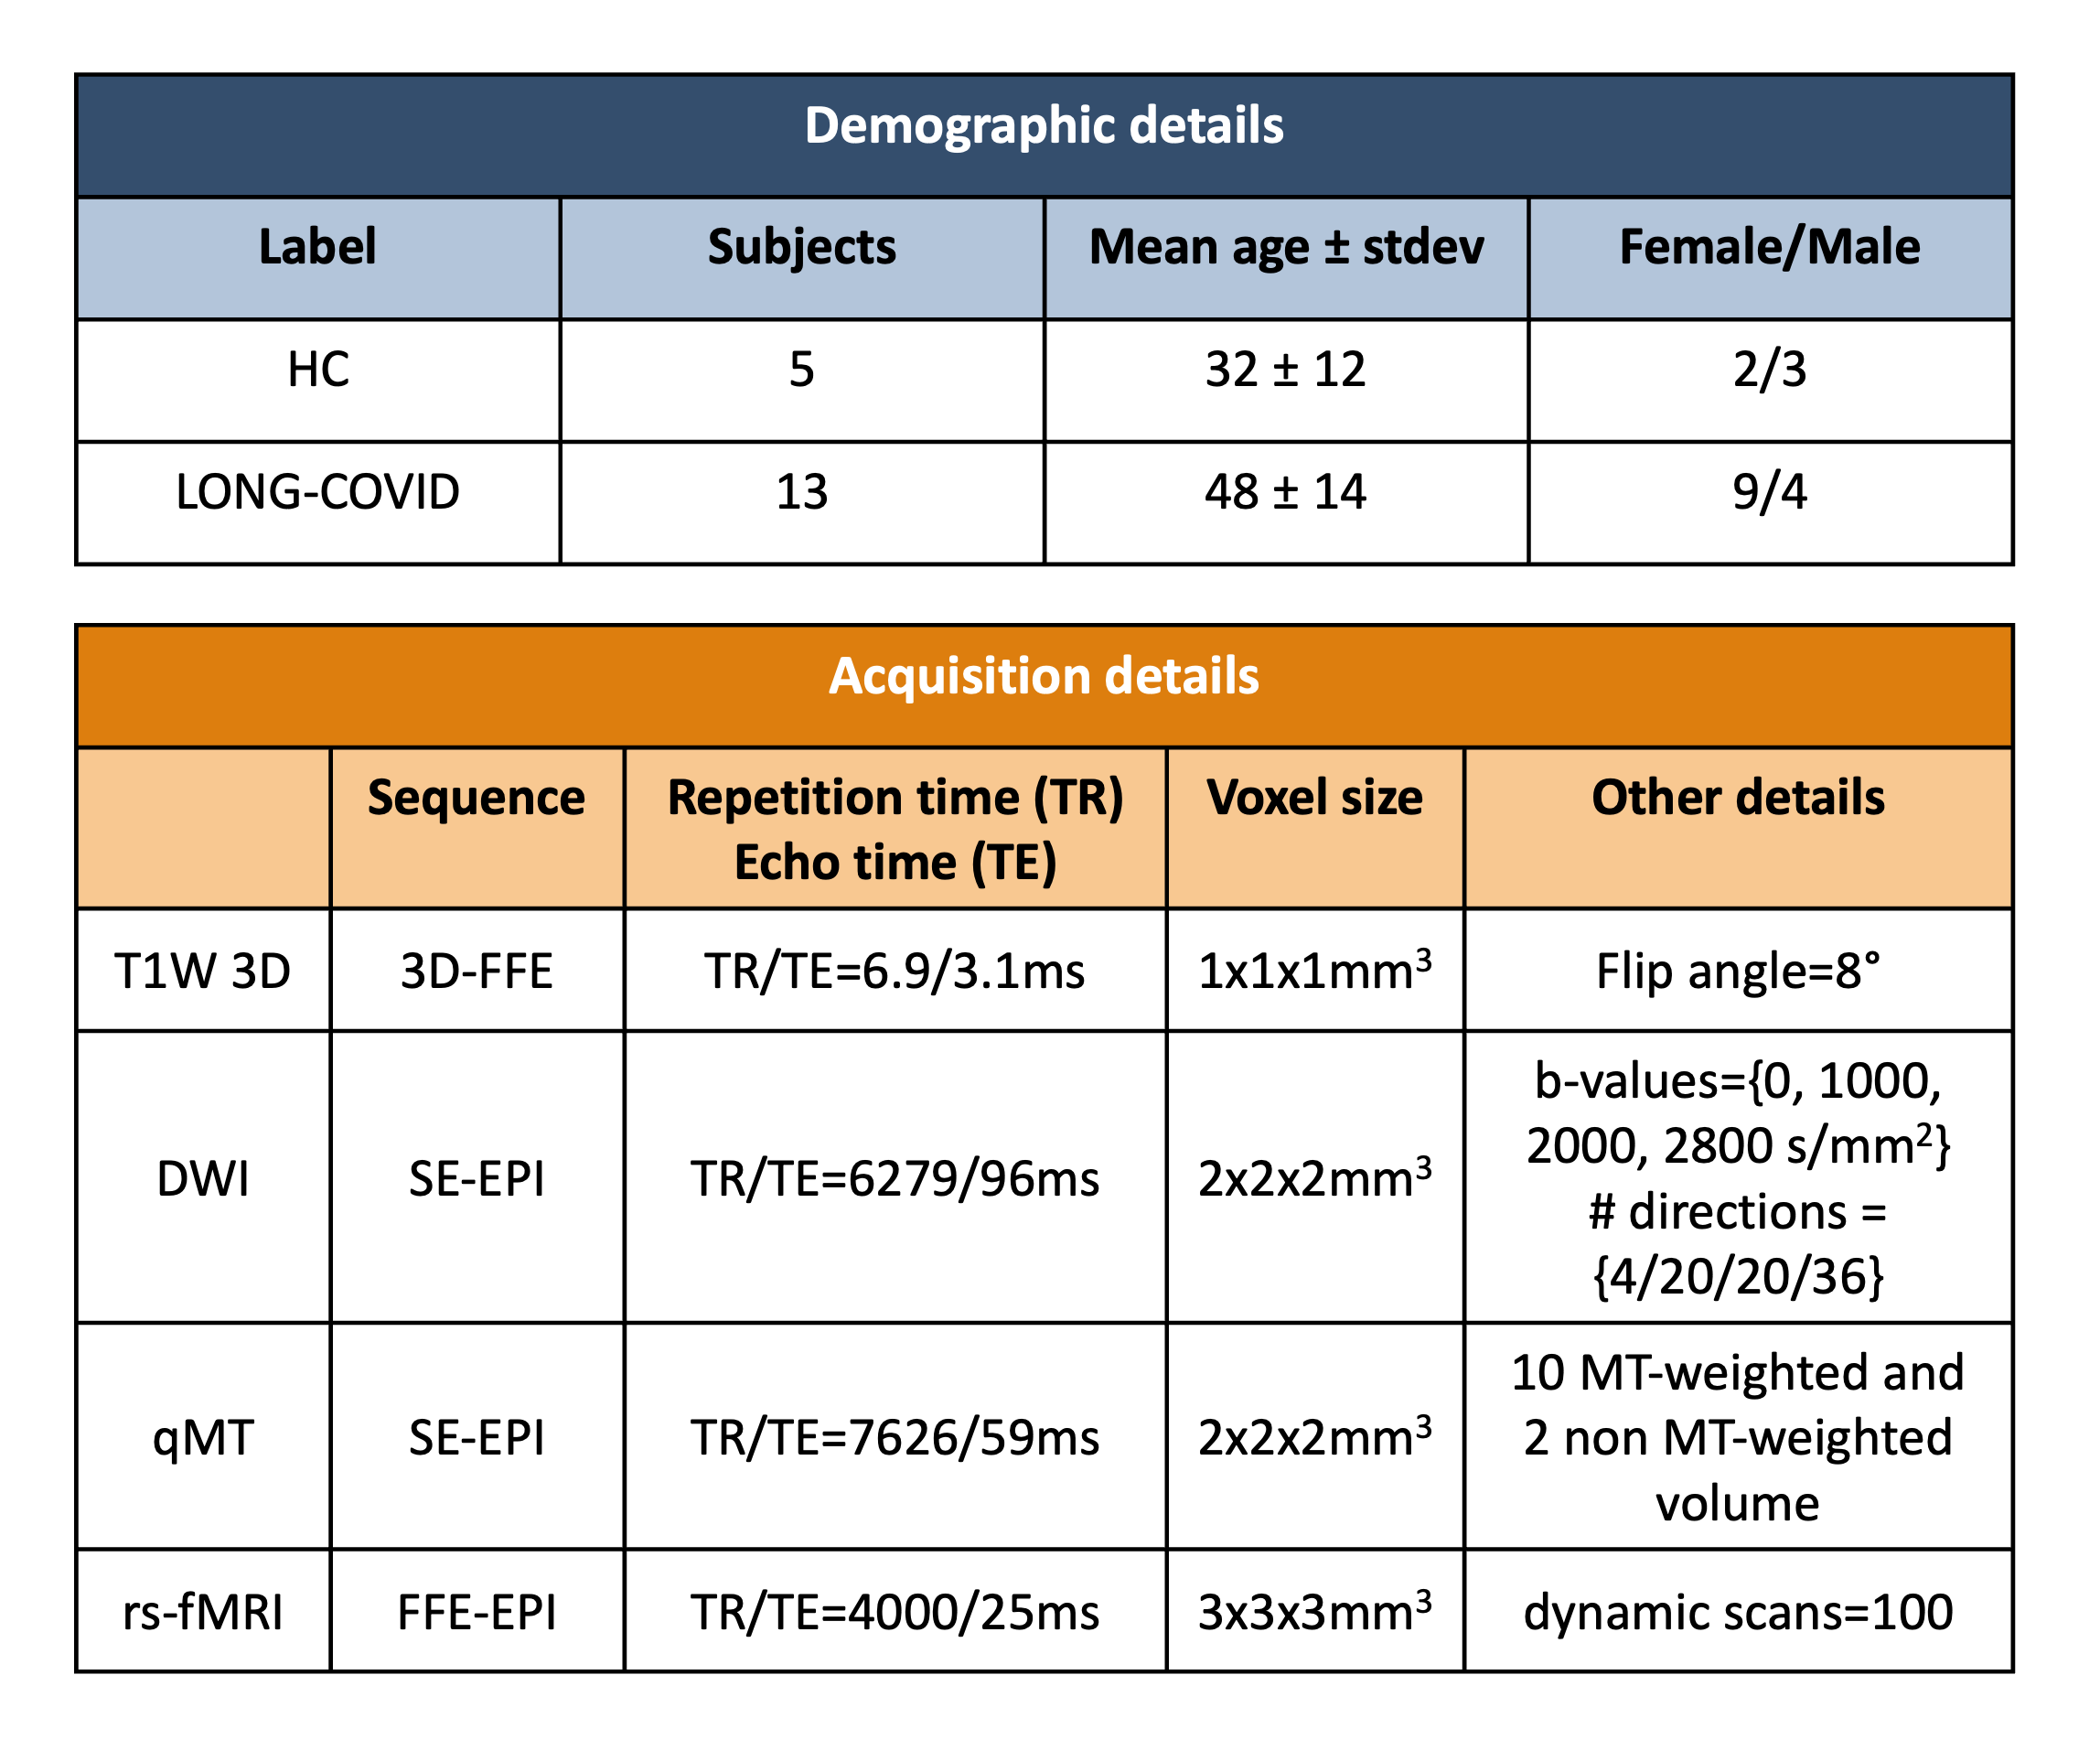
Figure1 | Demographic description and MRI protocol. The “Demographic details” table shows the number of subjects, age and gender. HC = healthy controls.
The “Acquisition details” table shows the MRI acquisition protocol. T1W = T1 weighted, DWI = diffusion-weighted imaging; qMT = quantitative magnetization transfer, rs-fMRI = resting state functional MRI.
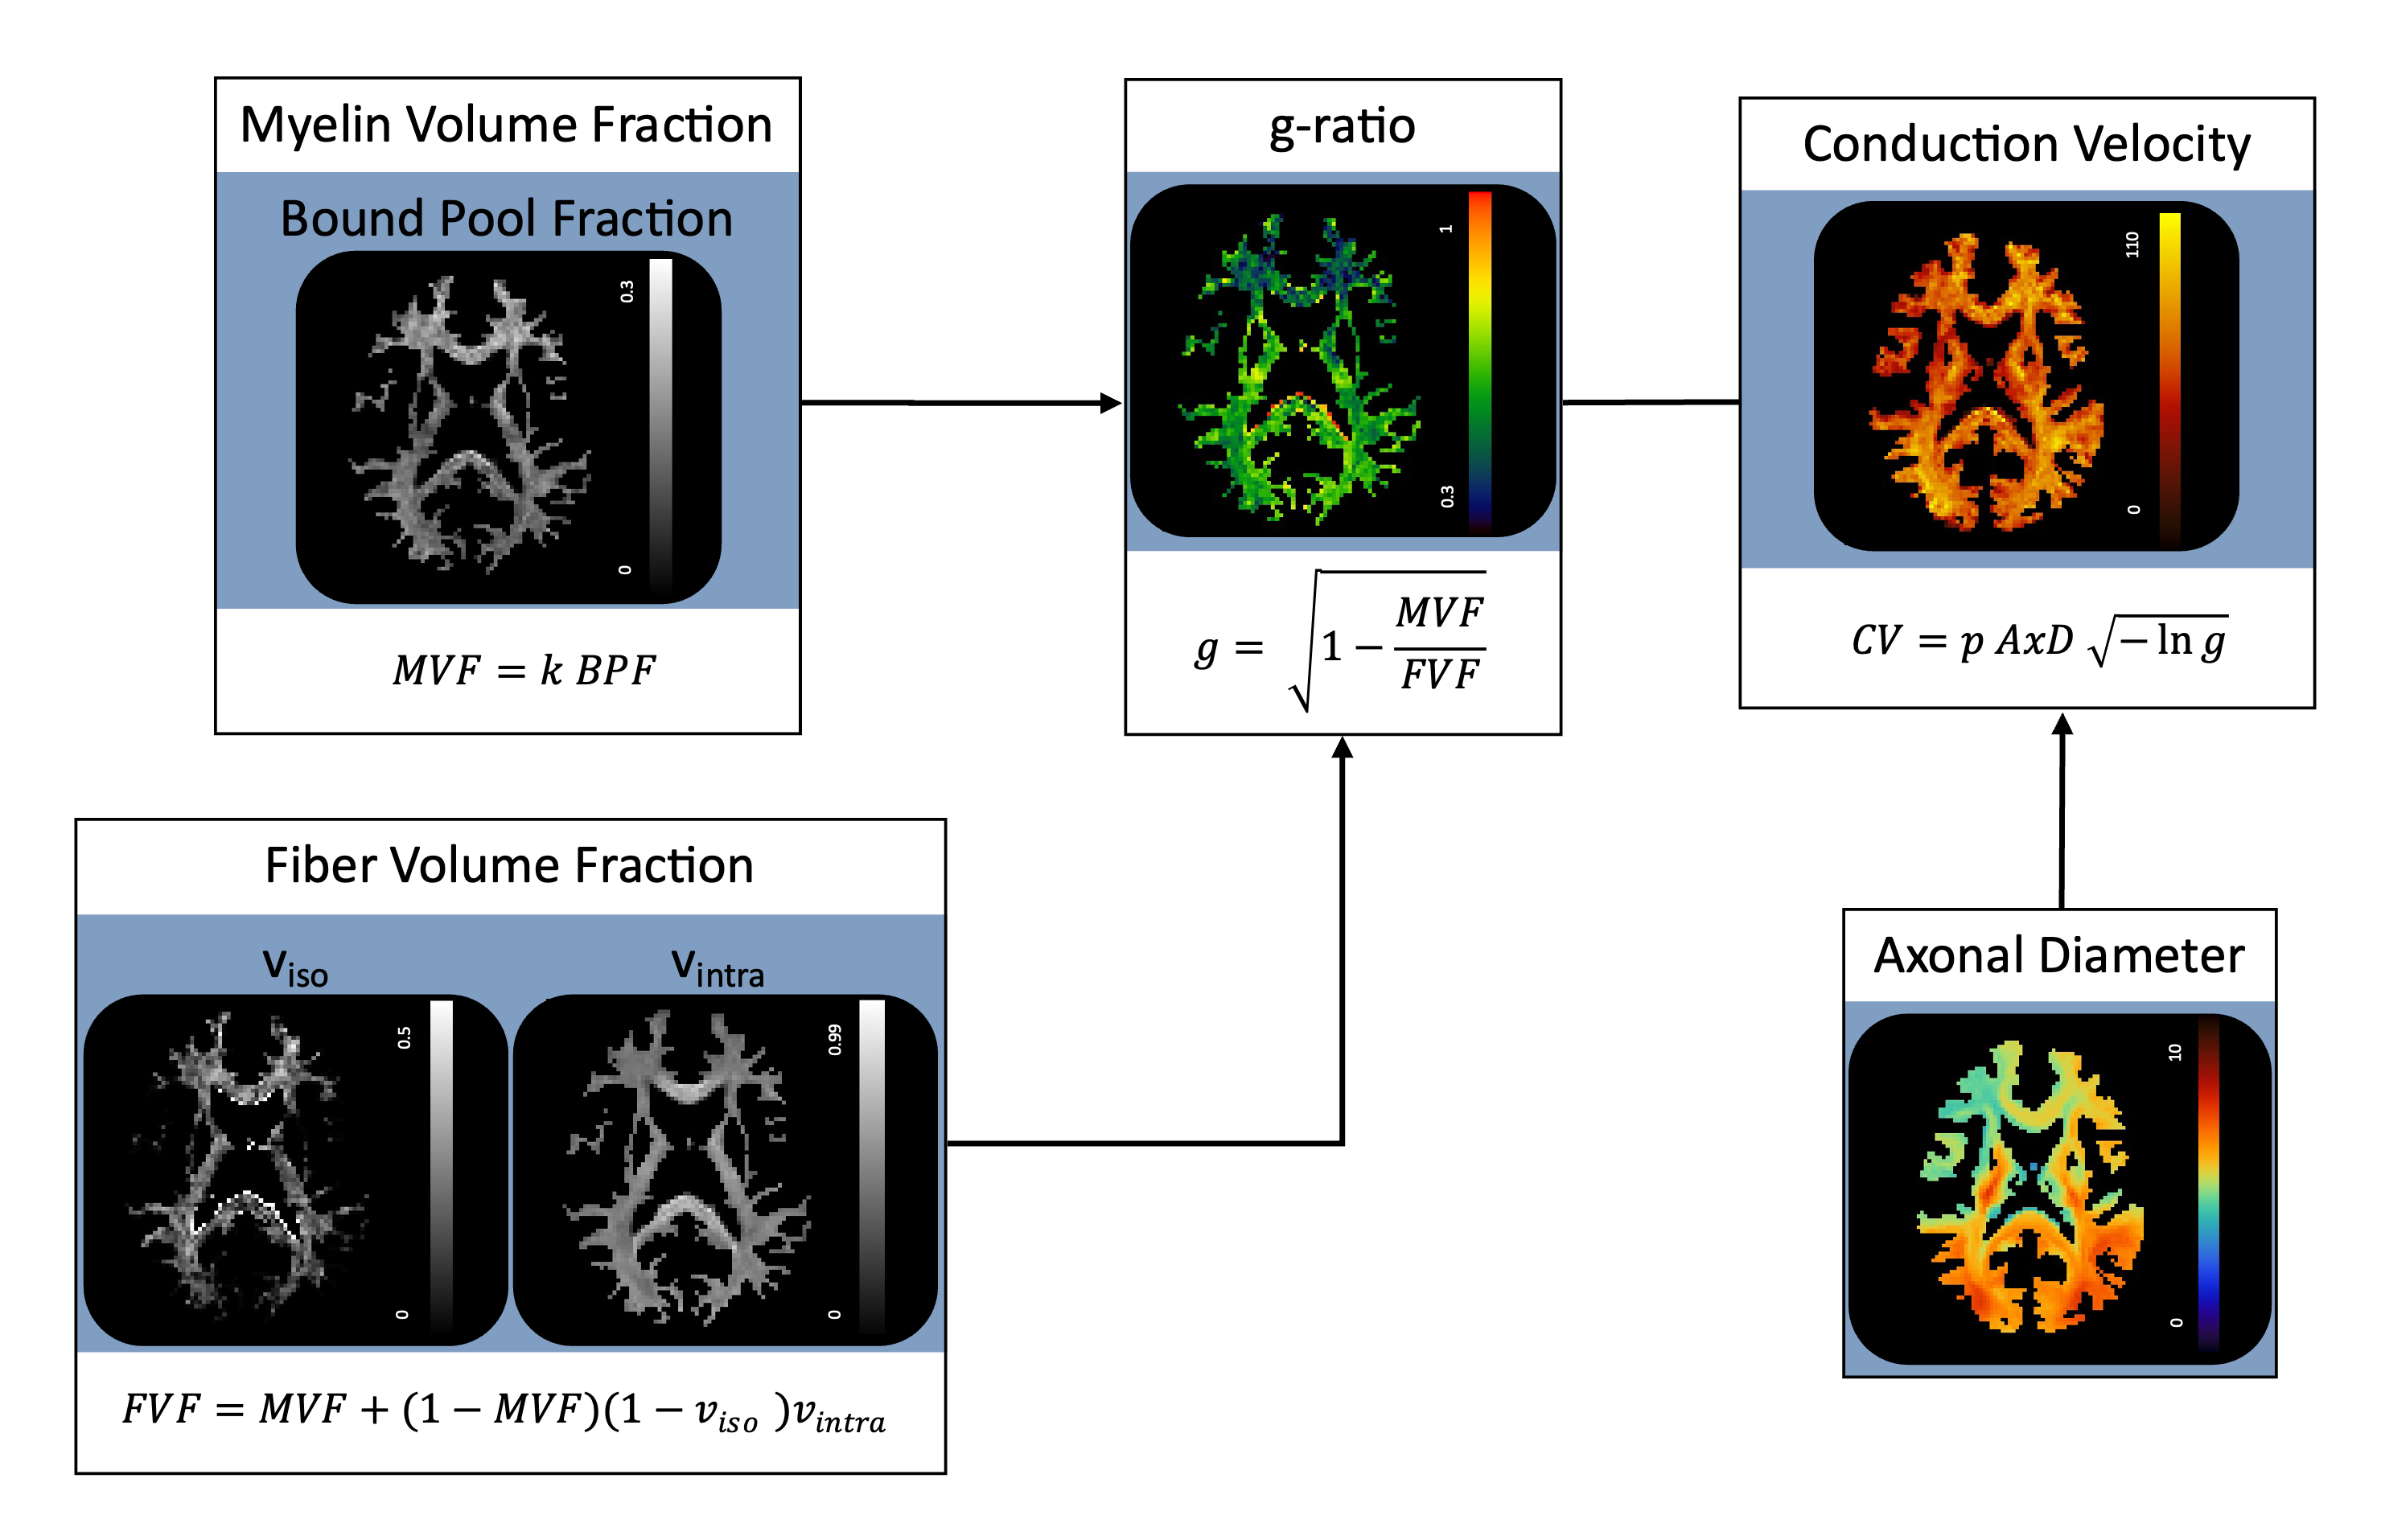
Figure2 | Conduction velocity (CV) map calculation. Bound Pool Fraction (BPF) maps were obtained from Quantitative Magnetization Transfer scans, while diffusion-weighted data were fitted with Neurite Orientation Dispersion and Density Imaging to obtain isotropic and intra-cellular volume fraction (viso, vintra) maps. Myelin Volume Fraction (MVF) and Fiber Volume Fraction (FVF) were calculated, k = 3.63 for this specific protocol. g-ratio (g) was obtained from MVF and FVF. Signal CV was computed from g-ratio maps and axonal diameter (AxD) map from an atlas, p = 16.99.
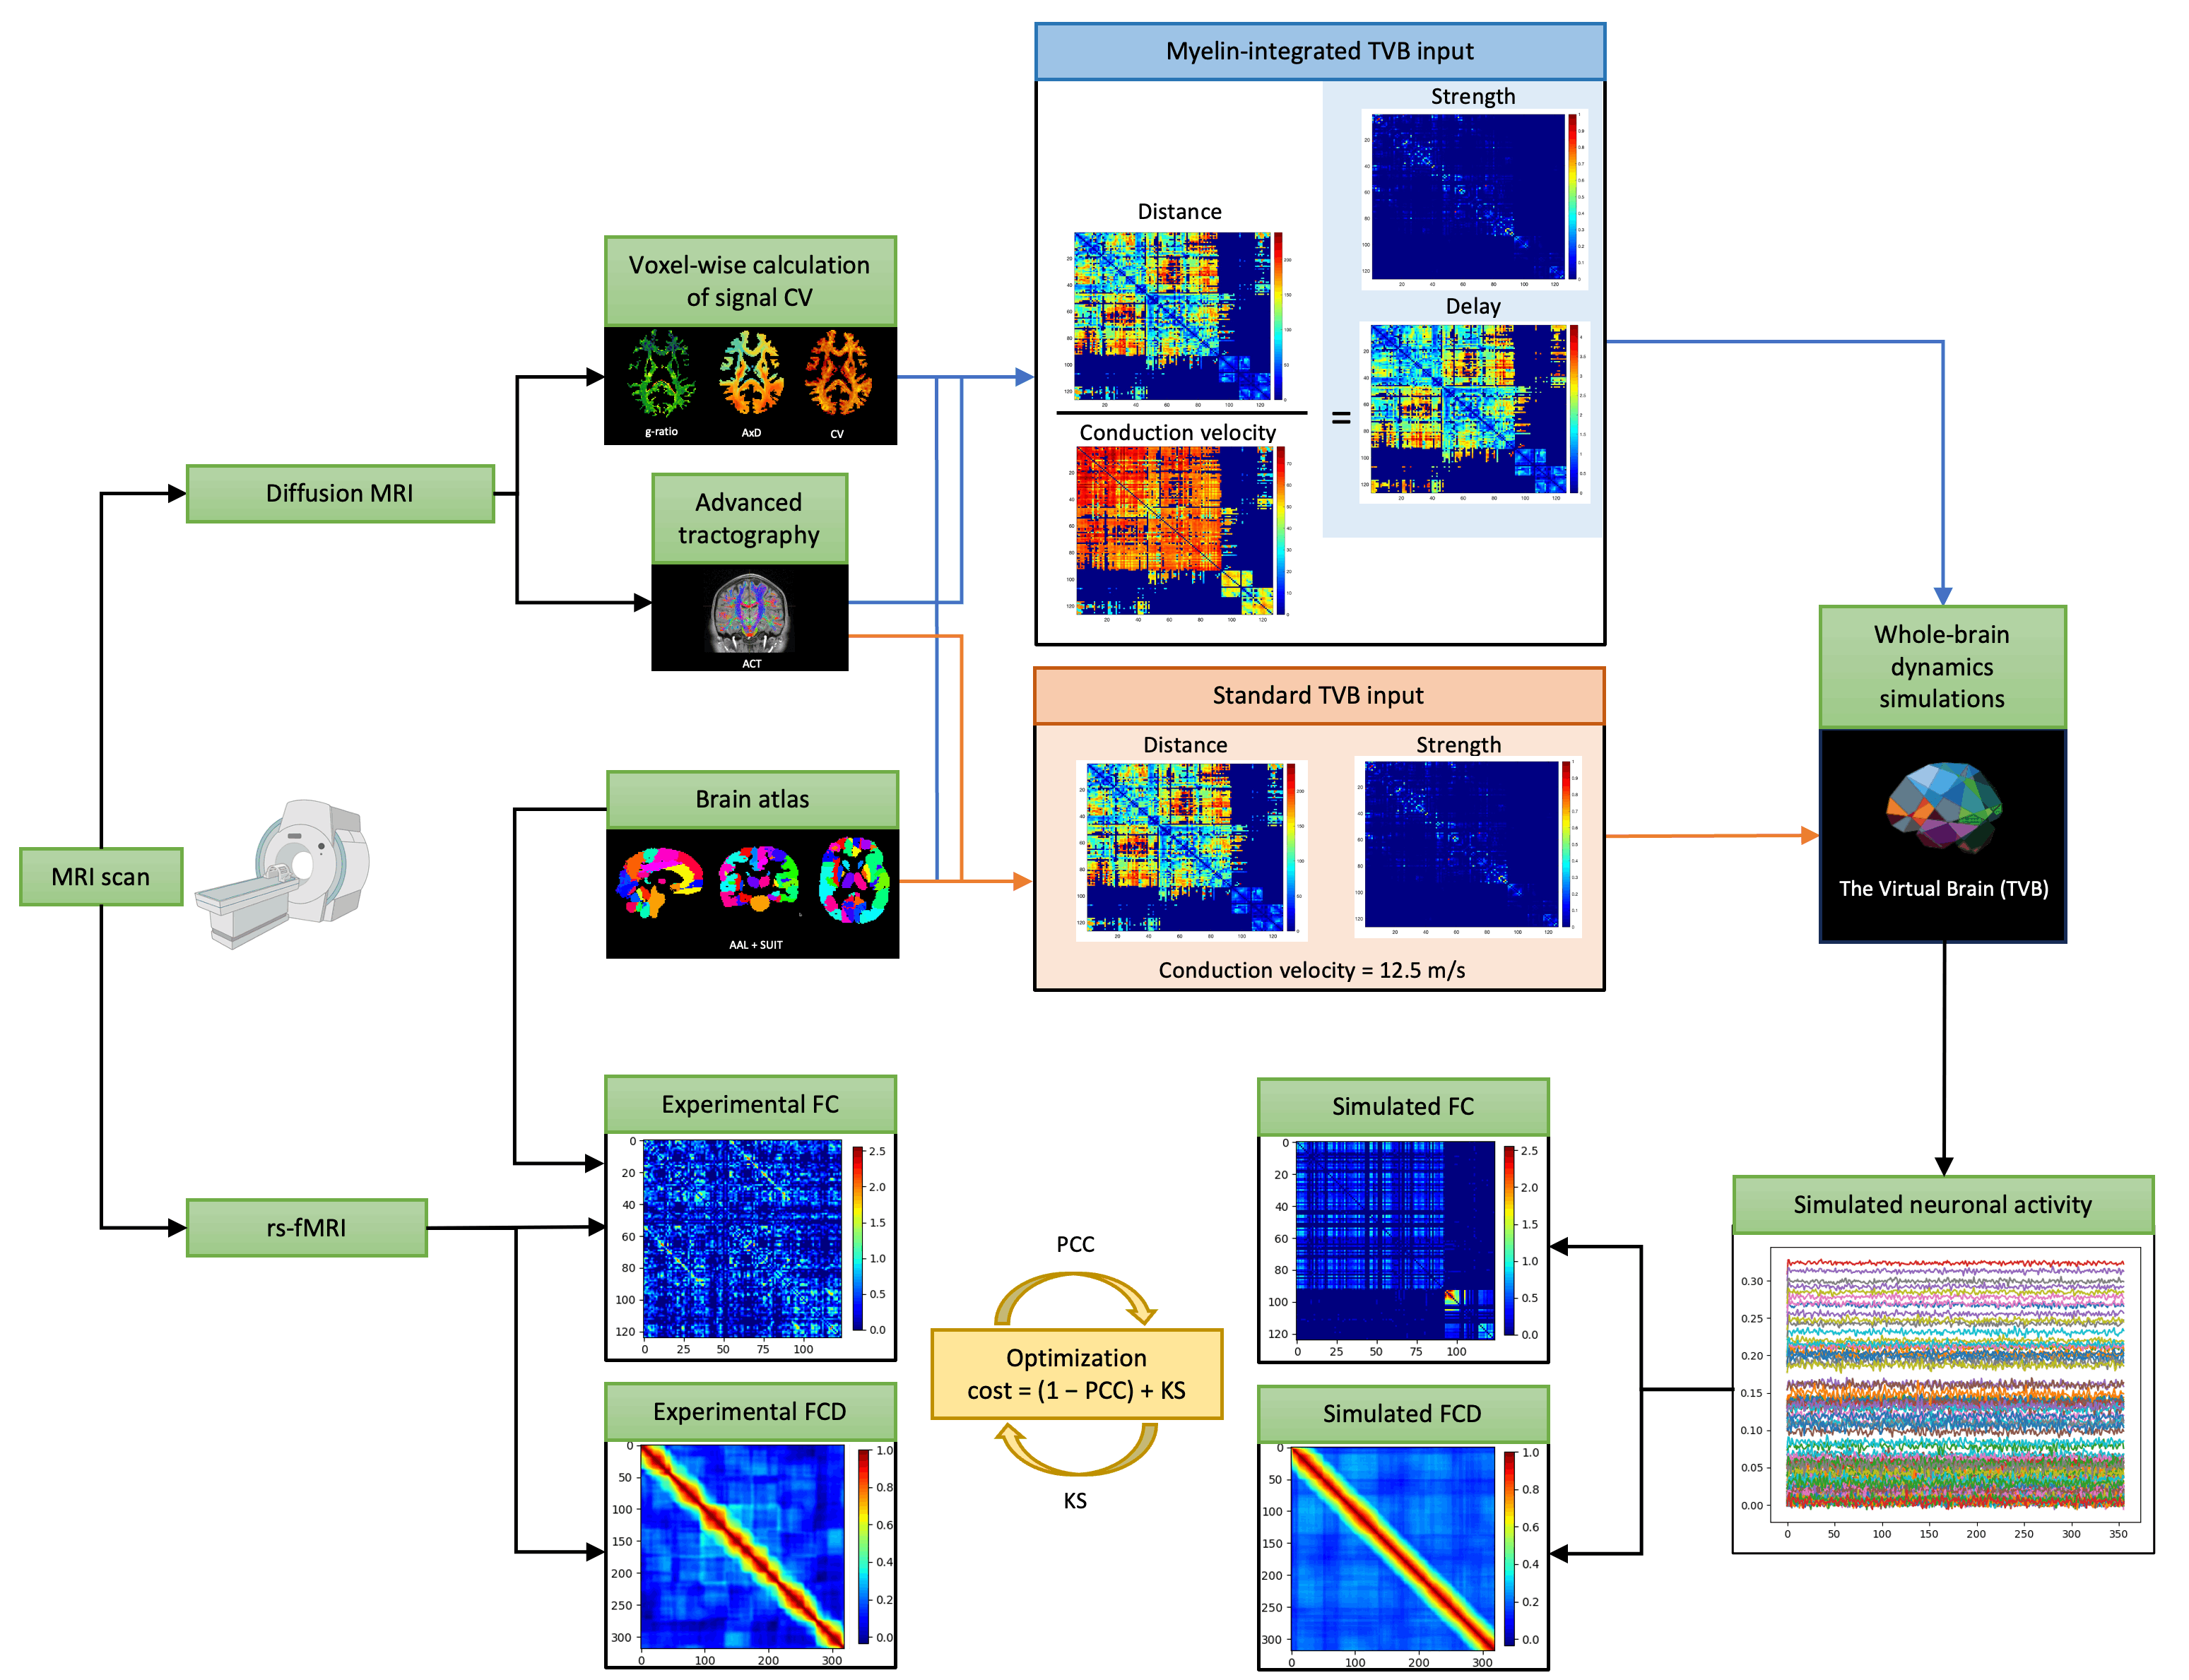
Figure3 | Analysis and TVB simulation pipeline. From top left, clockwise: conduction velocity (CV) map calculation, tractography and the brain atlas; myelin-integrated and standard TVB input, strength matrix: number of streamlines connecting each pair of nodes, distance matrix: length of axonal bundle; TVB simulations; simulated static (FC) and dynamic (FCD) functional connectivity matrices reconstruction; optimization process with experimental FC and FCD derived from resting state fMRI (rs-fMRI), PCC: Pearson correlation coefficient, KS: Kolmogorov–Smirnov distance.
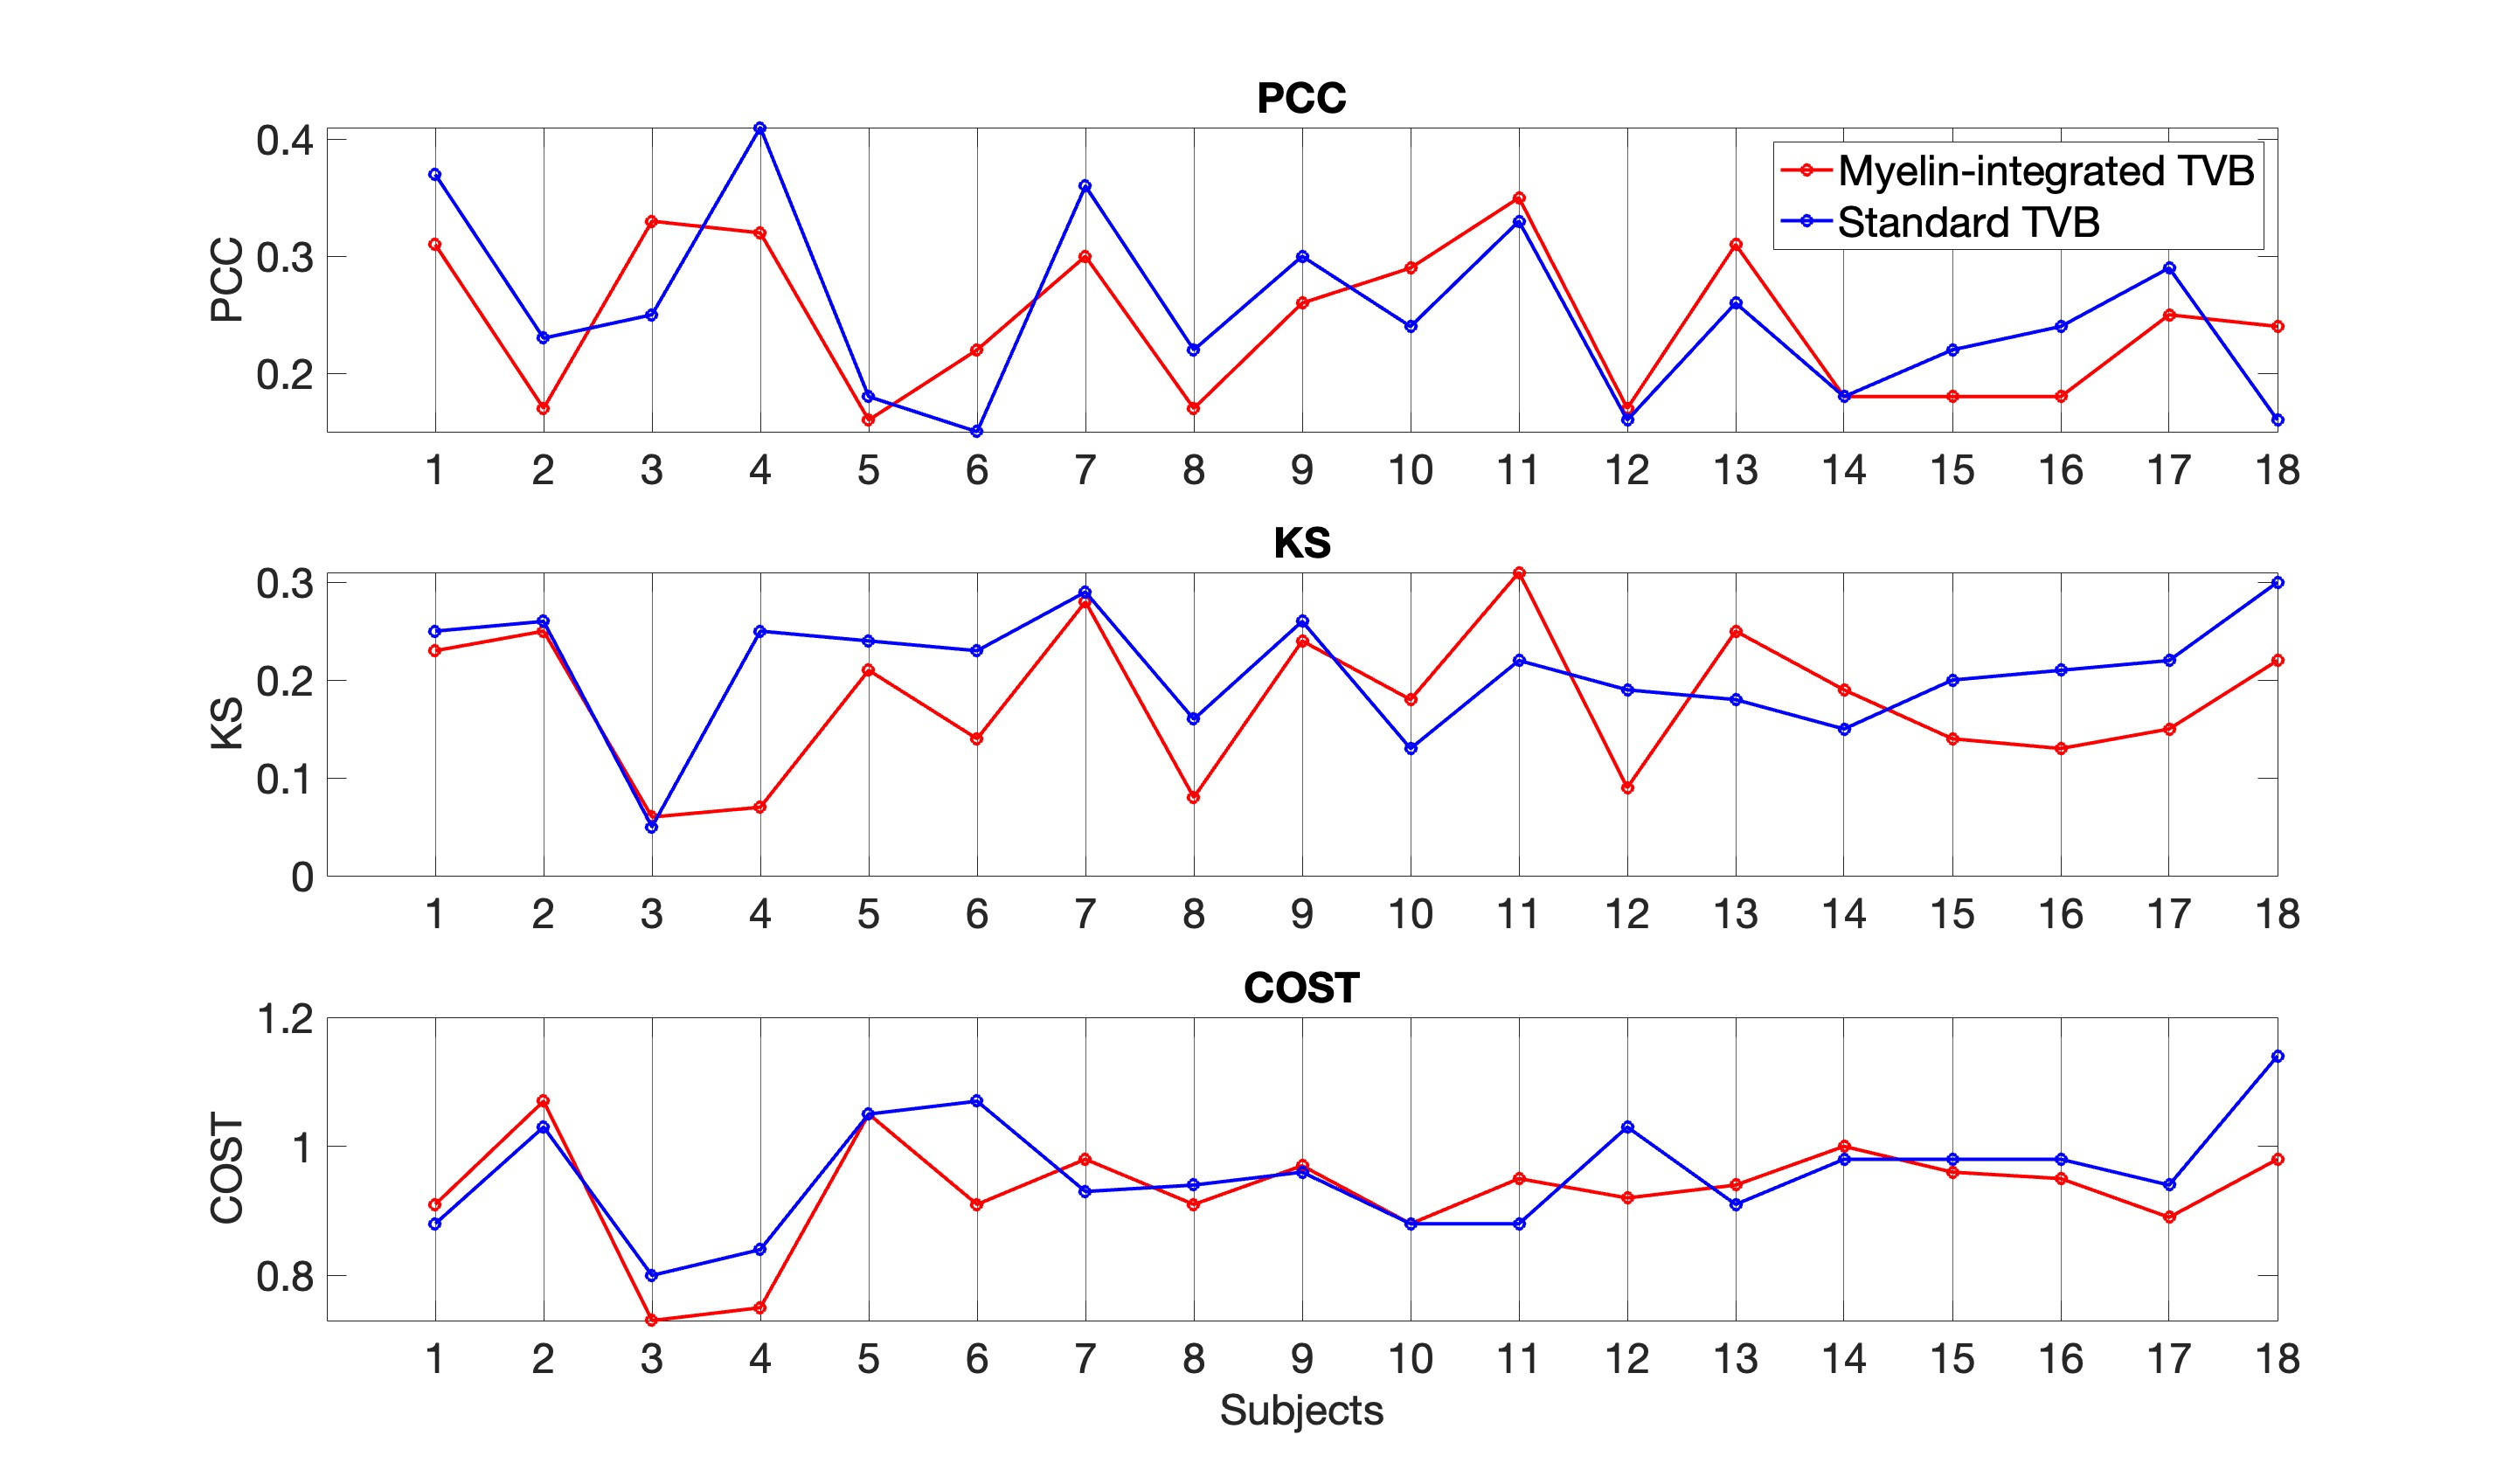
Figure4 | Optimization for standard TVB and myelin-integrated TVB for all subjects. PCC: Pearson correlation coefficient, KS: Kolmogorov–Smirnov distance. Higher similarity between experimental and simulated functional connectivity (FC) is expressed with higher PCC (static FC) or lower KS (dynamic FC). Myelin-integrated TVB shows a trend of lower KS and cost function than standard TVB, suggesting an improved simulation strategy.
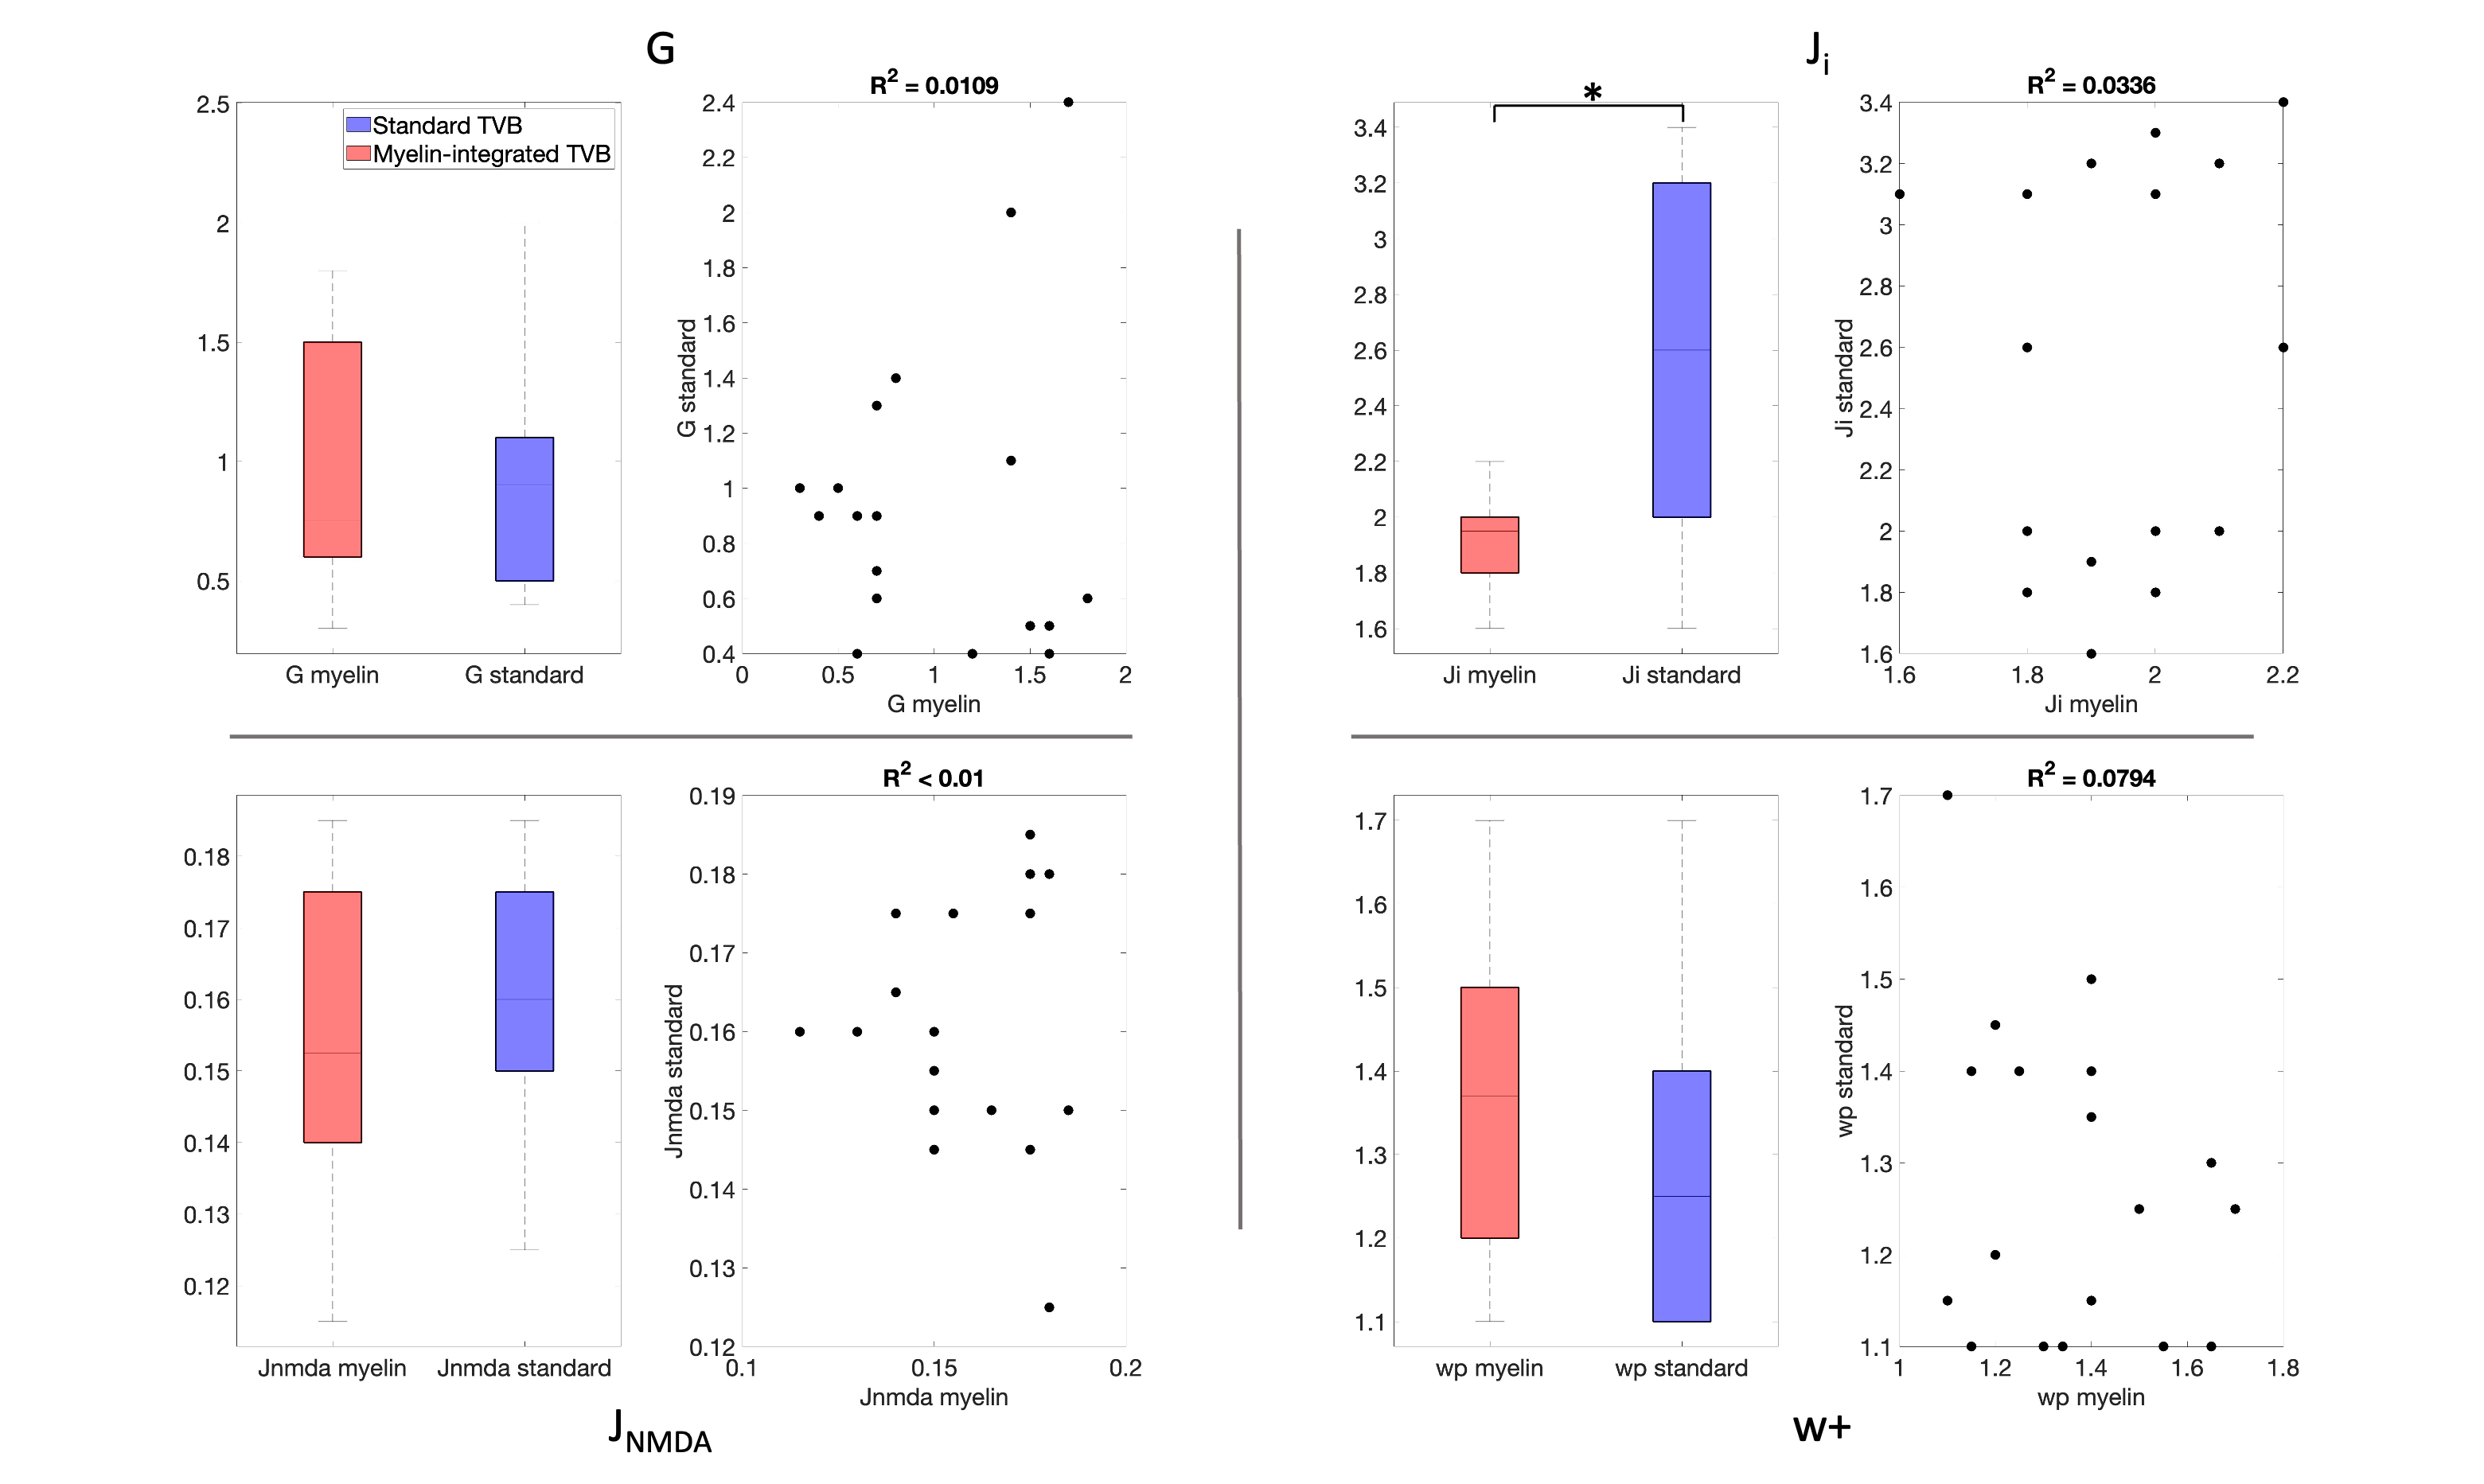
Figure5 | Comparison of TVB parameters derived with standard TVB (blue) and myelin-integrated TVB (red). Top to bottom: TVB parameters are global coupling (G), inhibitory (Ji) and excitatory (JNMDA) synaptic strength, and recurrent excitation (w+). In each panel, boxplot of TVB parameters obtained with the two methods (left) and their relative correlation R2 (right). The asterisk indicates significant differences (p<0.05).