1108
Diffusion tractography and functional connectivity profiles of the dorsal raphe nucleus in Parkinson’s Disease with sleep symptoms1DukeNUS Medical School, Singapore, Singapore, 2Singapore General Hospital, Singapore, Singapore, 3Duke University School of Medicine, Durham, NC, United States, 4National Neuroscience Institute, Singapore, Singapore
Synopsis
Keywords: Functional Connectivity, fMRI (resting state), Parkinson's disease, Dorsal Raphe Nucleus, Sleep disturbance, correlational tractography
Motivation: The role of the dorsal raphe nucleus (DRN) in sleep related pathologies in Parkinson’s disease (PD) remains under investigated.
Goal(s): To characterize functional connectivity patterns and correlational structural tractography changes specific to the DRN in PD and sleep-related symptoms.
Approach: Resting-state functional MRI and diffusion spectrum MRI metrics were compared across PD patients and healthy controls experiencing severe sleep disturbances.
Results: We found changes in functional connectivity profiles of the DRN and findings suggesting axonal damage that showed stronger correlation with sleep symptoms in healthy controls compared to patients, implying potentially distinct pathophysiological mechanisms in symptom development.
Impact: Clarifying involvement of the dorsal raphe nucleus and serotonergic pathways in the pathogenesis of sleep symptoms in Parkinson’s Disease may contribute to development of novel therapies targeted toward specific dysfunctional pathways involved in this quality-of-life disturbing condition.
Introduction
Sleep-related symptoms are common early presentations of Parkinson’s disease (PD) with 50-80% of patients reporting sleep related symptoms that can occur as early as 10 years before the first onset of motor signs1,2,3. While structural and functional imaging studies have provided insights on the involvement of mesocorticolimbic dopaminergic circuits in the sleep-wake cycle disturbances associated with PD4,5,the role of midbrain structures and the serotonergic circuits, including the dorsal raphe nucleus (DRN), remains less understood.Studies have reported changes in functional connectivity (FC) patterns of the DRN in PD with sleep dysfunction6,7. However, it remains unclear if these patterns are unique or if they are reproducible in non-PD patients with similar sleep disturbances. Additionally, associated changes on diffusion-imaging based correlational tractography findings have never been explored. This study aims to characterize changes in resting-state FC profile and diffusion metrics for the DRN in PD with sleep related symptoms and compare these against those for healthy controls (HCs) with sleep related symptoms.
Methods
Institutional ethics board approval and informed consent from each subject was obtained. Sleep related clinical assessments, including the Pittsburgh Sleep Quality Index (PSQI), REM Sleep Behavior Disorder Screening Questionnaire (RBDSQ) and Epworth Sleepiness Scale (ESS), in addition to motor [Unified Parkinson’s Disease Rating Scale – Part III (UPDRS-III)] and cognitive [Montreal Cognitive Assessment (MoCA)] assessments , were collected for 52 PD patients and 101 HCs. These groups were further categorized using the validated cutoff8,9 of PSQI score > 5.All subjects underwent brain MRI on a 3T scanner (Skyra, Siemens Healthcare, Erlangen, Germany), including resting-state functional MRI (rs-fMRI) (TR/TE 1500/30ms, FA 80°, 3x3x3mm3 voxel) and diffusion spectrum imaging (DSI) (TR/TE 4100/110ms, 129 sampling directions, b=3000s/mm2, 2x2x2mm3 voxel).
Rs-fMRI data was distortion corrected using FSL topup, and preprocessed and denoised using default pipelines (8mm FWHM smoothing, band pass filter 0.008-0.09Hz) of the CONN toolbox. The DRN mask obtained from the Harvard Ascending Arousal Network Atlas (HAAN)10 was used to generate FC maps through seed-to-voxel analysis. Across-group analyses for the estimation of FC connectivity changes of the DRN between PD patients with PSQI>5 and HC with PSQI>5 was controlled for age, gender, UPDRS-III, RBDSQ and MOCA. Significant clusters were identified using non-parametric threshold-free cluster enhancement with 1000 simulations and a family-wise error rate corrected voxel threshold of p<0.05.
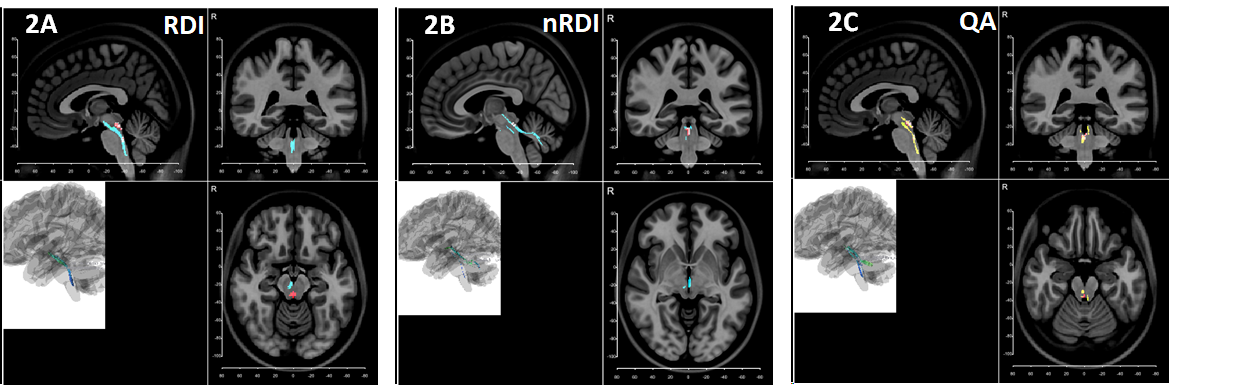
DSI data were processed and analyzed for correlational tractography using DSI studio. The DRN seed was used for identification of tracts with ?across-group differences in diffusion metrics[restricted diffusion imaging (RDI), non-restricted diffusion imaging (nRDI), and quantitative anisotropy (QA)] that were correlated with PSQI>5. Significance was determined by Spearman partial correlation analysis, controlled for age and gender, and FDR threshold of 0.05.
Results
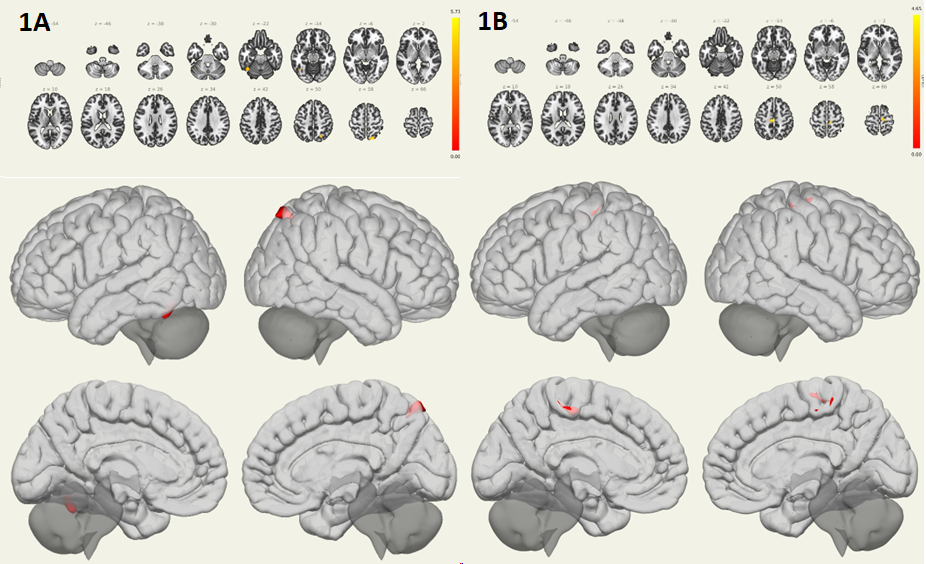
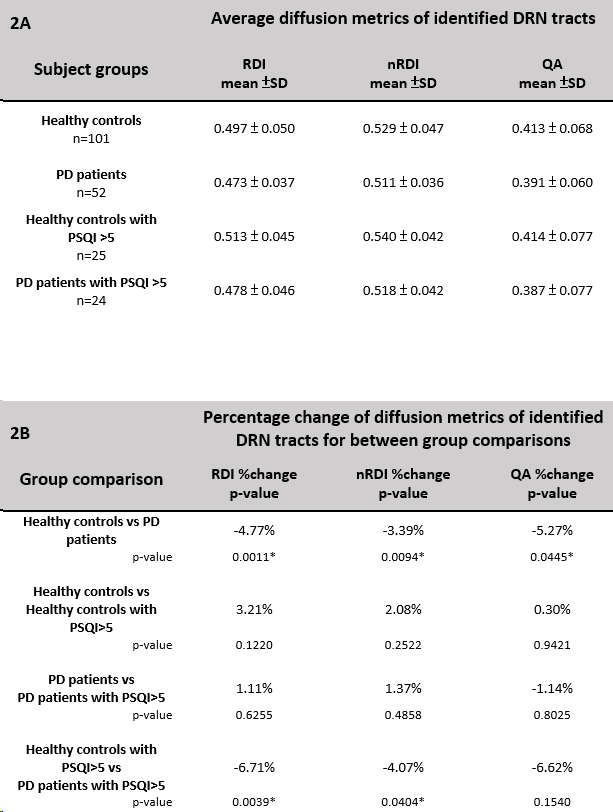
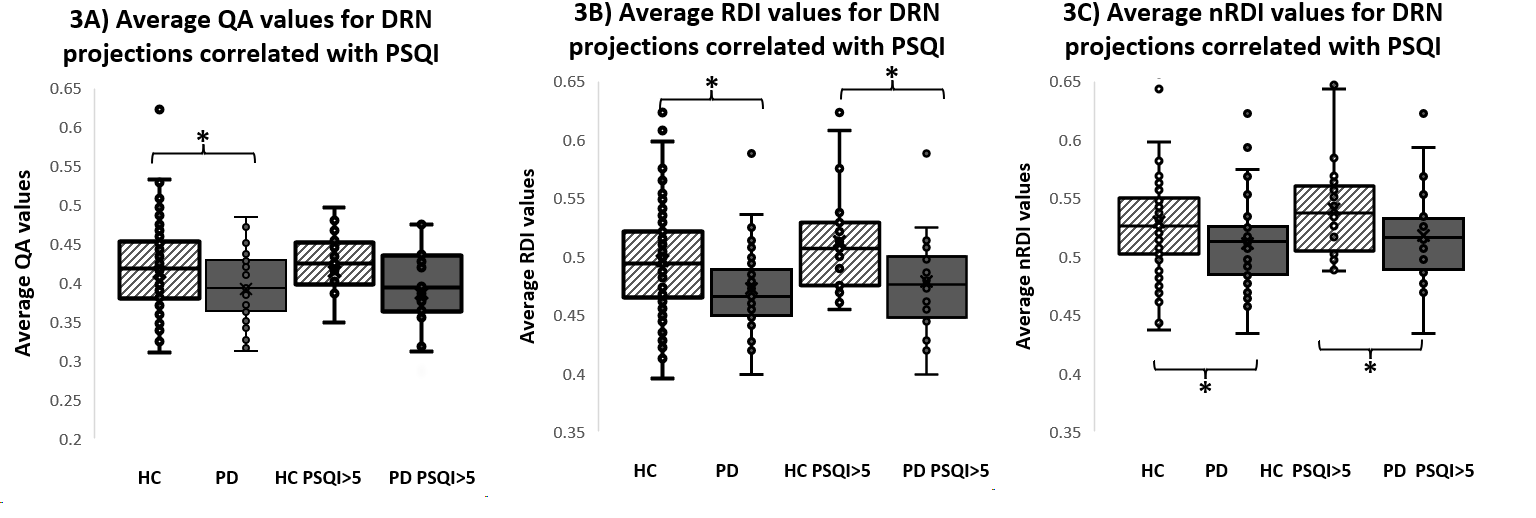
The PSQI>5 threshold created a PD group of 24 and a HC group of 25 upon which across-group comparisons were made. Subgroup demographics and covariates are summarized in Table 1. Figure 1A illustrates significant FC increase to the right lateral occipital lobe and left temporal occipital fusiform gyrus with the DRN seed in PD patients with PSQI>5 compared to HC with PSQI>5 groups. Figure 1B shows increased HC in-group FC with the DRN seed to the precentral and postcentral gyri when comparing HCs with PSQI>5 and HCs with PSQI<6. No significant changes of DRN FC were seen in the PD in-group comparison.Correlational tractography identified tracts with changes in diffusion metrics that significantly correlated with the PD PSQI>5 group (Table 2 and Figure 2). Tracts for RDI and nRDI (280 and 104 respectively) were negatively correlated to the PD PSQI>5 group and positively correlated to the HC PSQI>5 group, with mean diffusion metric values and additional analysis results summarized in Table 2 and Figure 3. Pearson’s correlation analysis yielded no significant correlation for ESS, RBDSQ, MOCA, MMSE, or UPDRS and average diffusion metrics of the identified tracts.
Discussion / Conclusion
Increased FC of the DRN to cortical regions and lower RDI and nRDI scores for correlational tractography analysis in the PD PSQI>5 group compared to the HC PSQI>5 group suggests a difference in the pathogenesis of sleep disturbances between HC and PD groups. The DRN represents a brain region sensitive to etiological differences in sleep-related symptoms, possibly allowing it to be a target of diagnostic workup. However, further studies are needed to characterize other sources of sleep disturbances and their effects on the DRN.Acknowledgements
We are deeply appreciative of individuals who generously participated in this study. Their participation and contributions have greatly enriched the scientific discourse in our area of investigation.References
1. Tandberg E, Larsen JP, Karlsen K. A community-based study of sleep disorders in patients with Parkinson’s disease. Movement Disorders. 1998;13(6):895–899.
2. Riedel O, Klotsche J, Spottke A, et al. Frequency of dementia, depression, and other neuropsychiatric symptoms in 1,449 outpatients with Parkinson’s disease. Journal of neurology. 2010;257(7):1073–1082.
3. Claassen DO, Josephs KA, Ahlskog JE, Silber MH, Tippmann-Peikert M, Boeve BF. REM sleep behavior disorder preceding other aspects of synucleinopathies by up to half a century.
4. Murillo-Rodriguez E, Arias-Carrion O, Sanguino-Rodriguez K, Gonzalez-Arias M, Haro R. Mechanisms of sleep-wake cycle modulation. CNS Neurol Disord Drug Targets. 2009;8:245–253.
5. Mehta SH, Morgan JC, Sethi KD. Sleep disorders associated with Parkinson’s disease: role of dopamine, epidemiology, and clinical scales of assessment. CNS Spectr. 2008;13:6–11.
6. Wilson H, Giordano B, Turkheimer FE, Chaudhuri KR, Politis M. Serotonergic dysregulation is linked to sleep problems in Parkinson's disease. Neuroimage Clin. 2018 Mar 2;18:630-637. doi: 10.1016/j.nicl.2018.03.001. PMID: 29845011; PMCID: PMC5964830.
7. Lv, L., Zhang, H., Tan, X. et al. Associated factors and abnormal dorsal raphe nucleus connectivity patterns of freezing of gait in Parkinson’s disease. J Neurol 269, 6452–6466 (2022)
8. Buysse DJ, Reynolds CF, Monk TH, et al. The Pittsburgh Sleep Quality Index: a new instrument for psychiatric practice and research. Psychiatry Res. 1989;28:193–213.
9. Carpenter JS, Andrykowski MA. Psychometric evaluation of the Pittsburgh Sleep Quality Index. J Psychosom Res. 1998;45:5–13.
10. Edlow BL, Takahashi E, Wu O, Benner T, Dai G, Bu L, Grant PE, Greer DM, Greenberg SM, Kinney HC, Folkerth RD. Neuroanatomic connectivity of the human ascending arousal system critical to consciousness and its disorders. Journal of Neuropathology and Experimental Neurology. 2012;71:531-546. PMCID: PMC3387430.
Figures
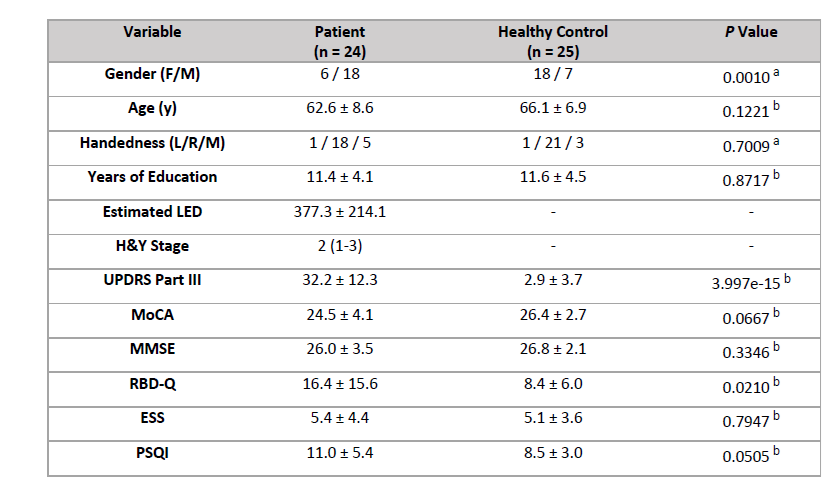
Table 1. Overview of clinical and demographic data for patients and healthy controls with total PSQI score > 5. Data shown as n1/n2/n3 median (range), and mean ± standard deviation.
a: Chi-square test
b: Independent Samples t-test