1106
Cortico-cerebellar effective connectivity of visual attention areas is altered in developmental dyslexia compared to typical readers1Department of Brain and Behavioral Sciences, University of Pavia, Pavia, Italy, 2Child Psychopathology Unit, Scientific Institute, IRCCS Eugenio Medea, Bosisio Parini, Italy, 3Neuroimaging Unit, Scientific Institute, IRCCS Eugenio Medea, Bosisio Parini, Italy, 4Pediatric Radiology and Neuroradiology Department, Children’s Hospital V. Buzzi, Milan, Italy, 5Digital Neuroscience Centre, IRCCS Mondino Foundation, Pavia, Italy, 6NMR Research Unit, Queen Square MS Centre, Department of Neuroinflammation, UCL Queen Square Institute of Neurology, Faculty of Brain Sciences, University College London, London, United Kingdom
Synopsis
Keywords: Functional Connectivity, Brain Connectivity, Dyslexia, Dynamic Causal Modeling
Motivation: Alterations in functional connectivity between regions involved in reading and visuo-attention networks have been associated with developmental dyslexia. However, the causal relationship between regional activity remains unknown.
Goal(s): We aimed to investigate the causal relationship between regions of the visuo-attention network in developmental dyslexia and typical readers during a coherent motion detection task.
Approach: Using Dynamic Causal Modeling, the causal connectivity between regions in the cortex and cerebellum was estimated to understand aberrant network function.
Results: Children with developmental dyslexia showed remarkable differences in patterns of excitatory and inhibitory communication between cerebellum and visuo-attention regions compared to typical reader children.
Impact: Dynamic Causal Modeling can evaluate cortico-cerebellar causal relationship (i.e., effective connectivity) in healthy subjects and in neurodevelopmental conditions such as developmental dyslexia. New evidence points toward a critical role of the cerebellum in reading impairment, with potential consequences for intervention.
Introduction
Characterization of abnormalities in functional dynamics is important for understanding how pathological conditions change neural processing and to tailor best therapies and interventions. Furthermore, differences in strength and direction of causal influence between regions described by effective connectivity, can provide a comprehensive picture of the abnormal brain1. Developmental dyslexia (DD) is a neurodevelopmental disorder characterized by impaired reading, skill automatization and attention that includes alterations in the visuo-attention system and in sensory input processing involving cortical and cerebellar regions2.Dynamic Causal Modeling (DCM) can infer effective connectivity between brain regions finding the best model of interactions that explains the observed data3. Using functional MRI (fMRI) data during a visual-attentive task (i.e., coherent motion detection task)4, we examined effective connectivity differences between children with DD and typical reader (TR) children. To the best of our knowledge, this study represents the first investigation using DCM to examine causal influence in a network of cortical and cerebellar regions, questioning 1) the presence of an aberrant functional structure associated with children with DD and 2) the influence of the cerebellum on cortical regions implicated in visual processing, reading and attention. To test these hypotheses, we quantified the influence of task4 modulations on Blood Oxygen Level Dependent (BOLD) signal to fit haemodynamic responses driving causal relationships, investigating if the same architecture presents different effective connectivity in children with DD and TR children, corresponding to different dynamical states.
Methods
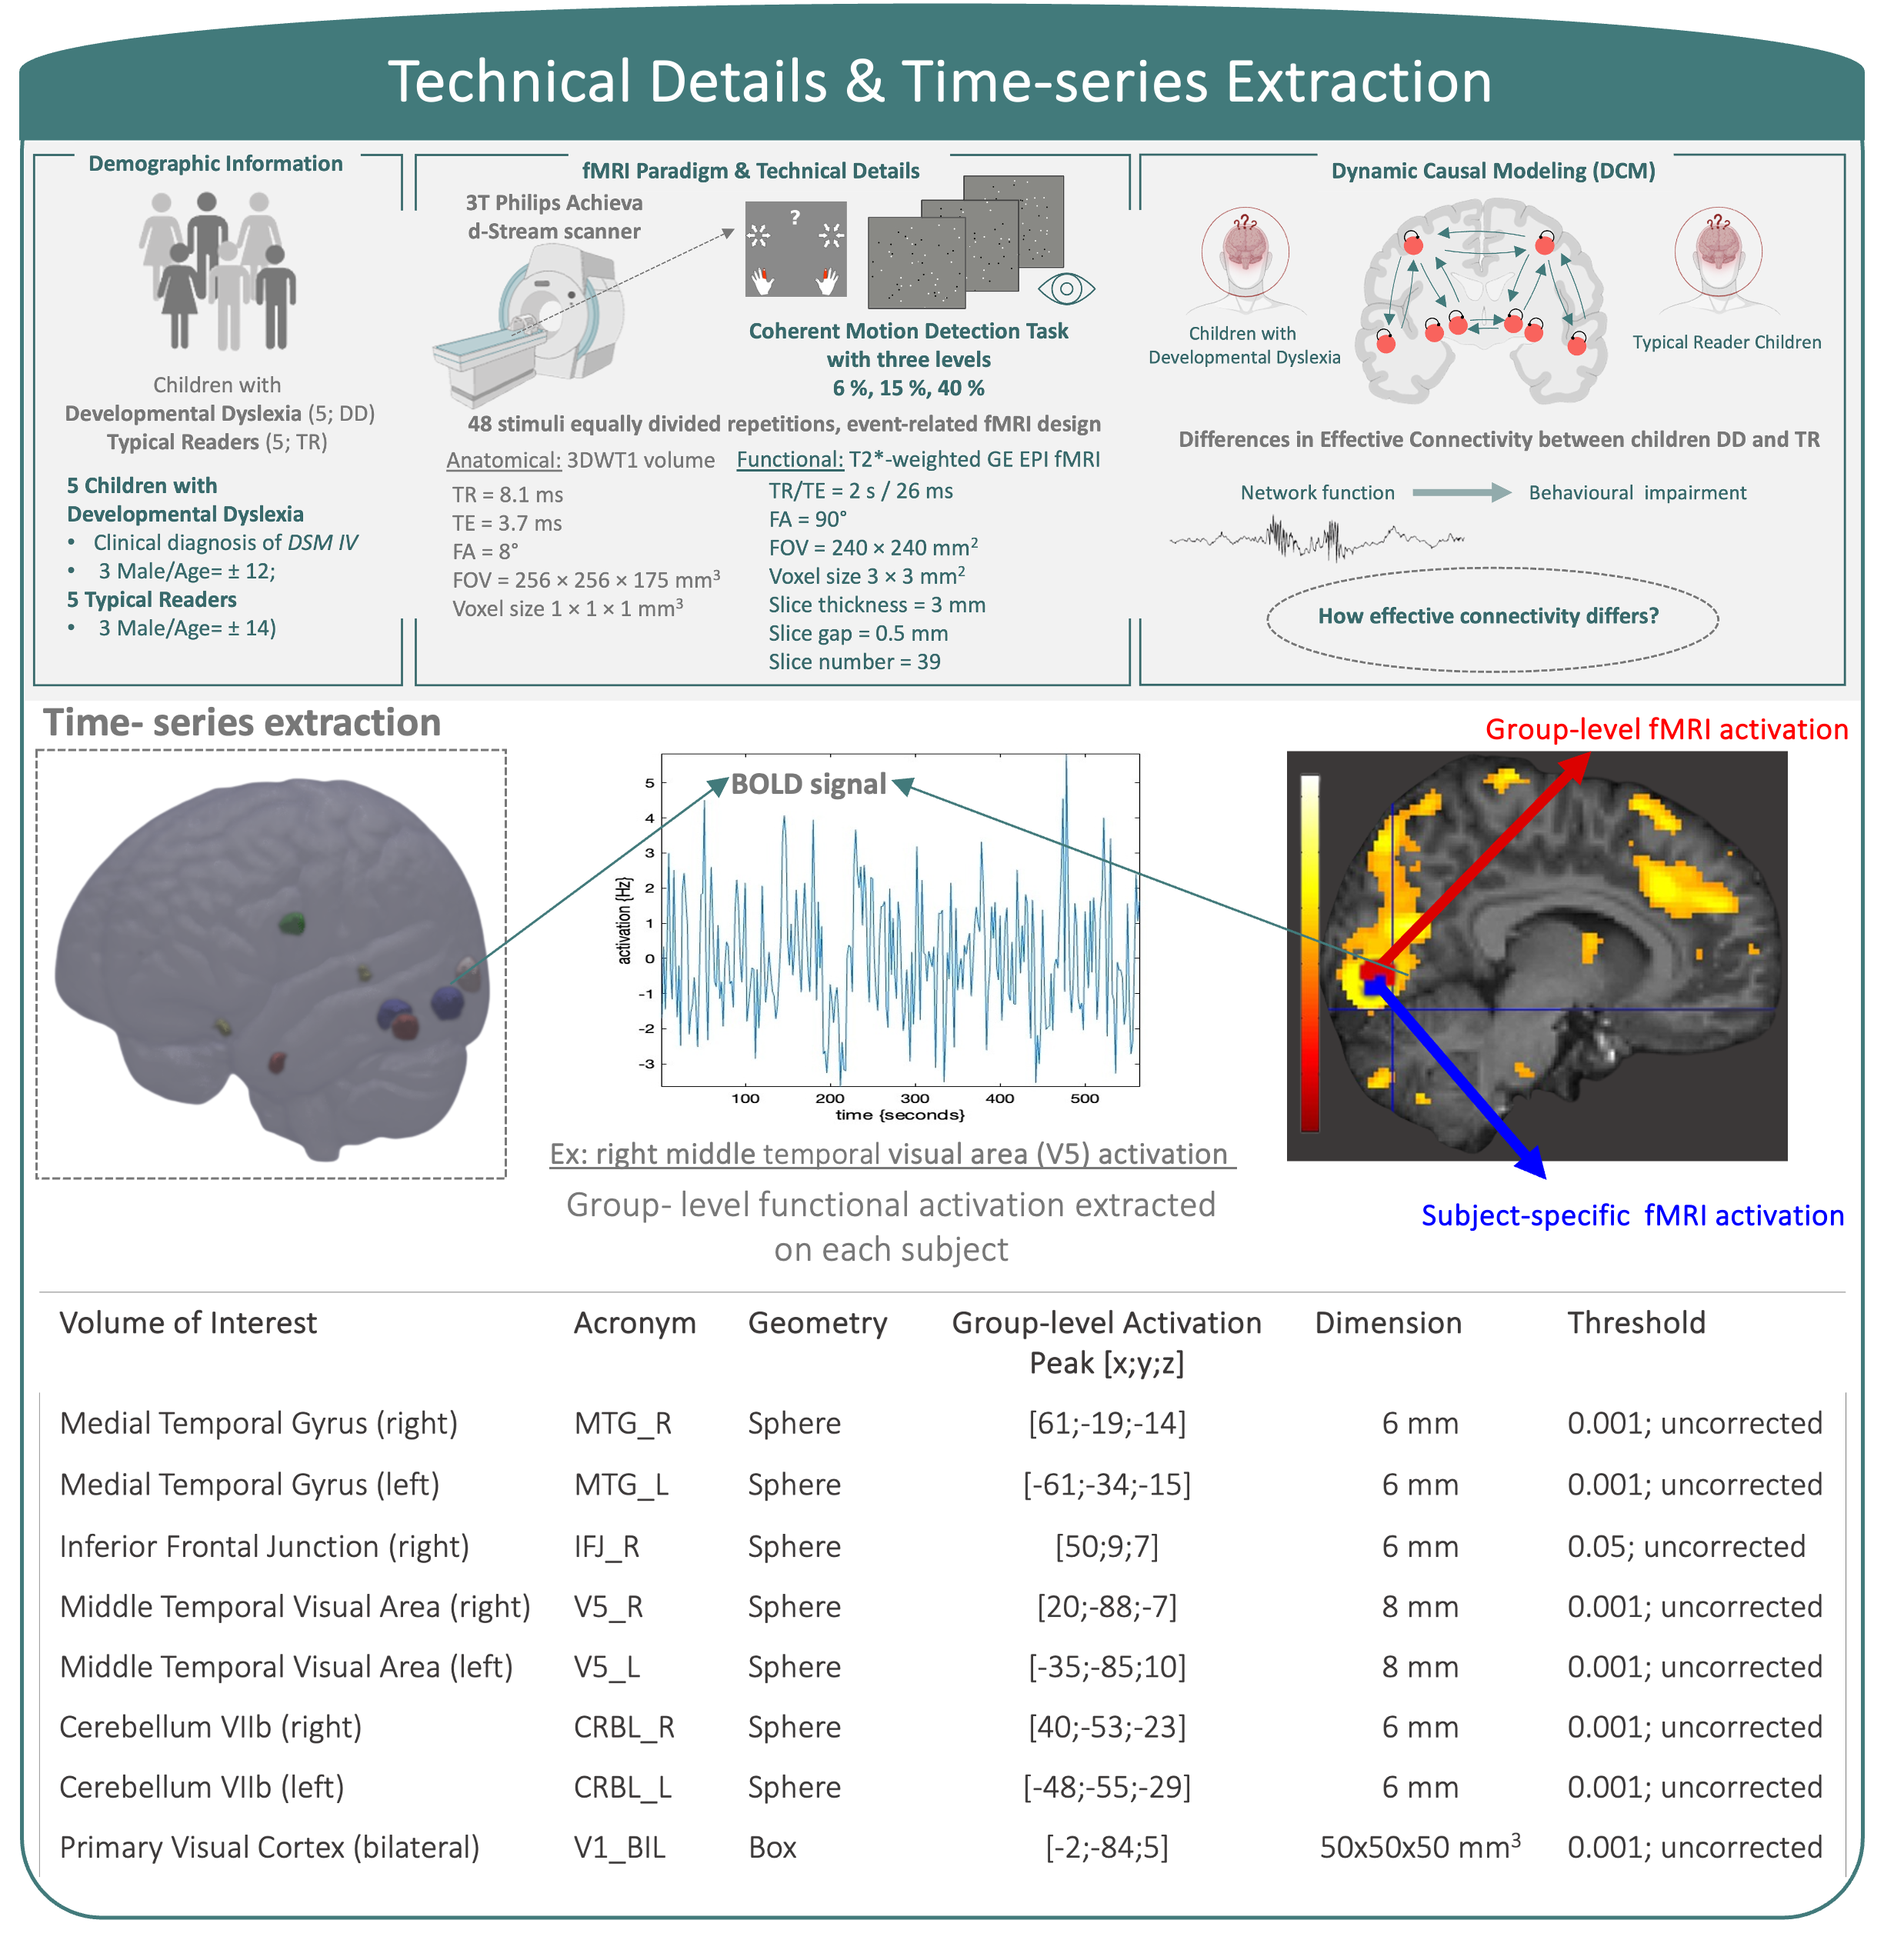
Subjects and MRI acquisition information4,5 are reported in the Figure 1.Region-specific time series extraction: We selected the following regions of interest (ROIs) as nodes of the effective connectivity network: bilateral primary visual cortex (V1), bilateral middle temporal visual area (MT;V5), bilateral middle temporal gyrus (MTG), right inferior frontal junction (IFJ)6-9 and bilateral lobule VIIb of the cerebellum (CRBL). After applying fMRI standard preprocessing steps, selection of subject-specific coordinates was guided by group maxima. ROI activity was summarised by extracting combined anatomical and group-level constraints as illustrated in the Figure 1.
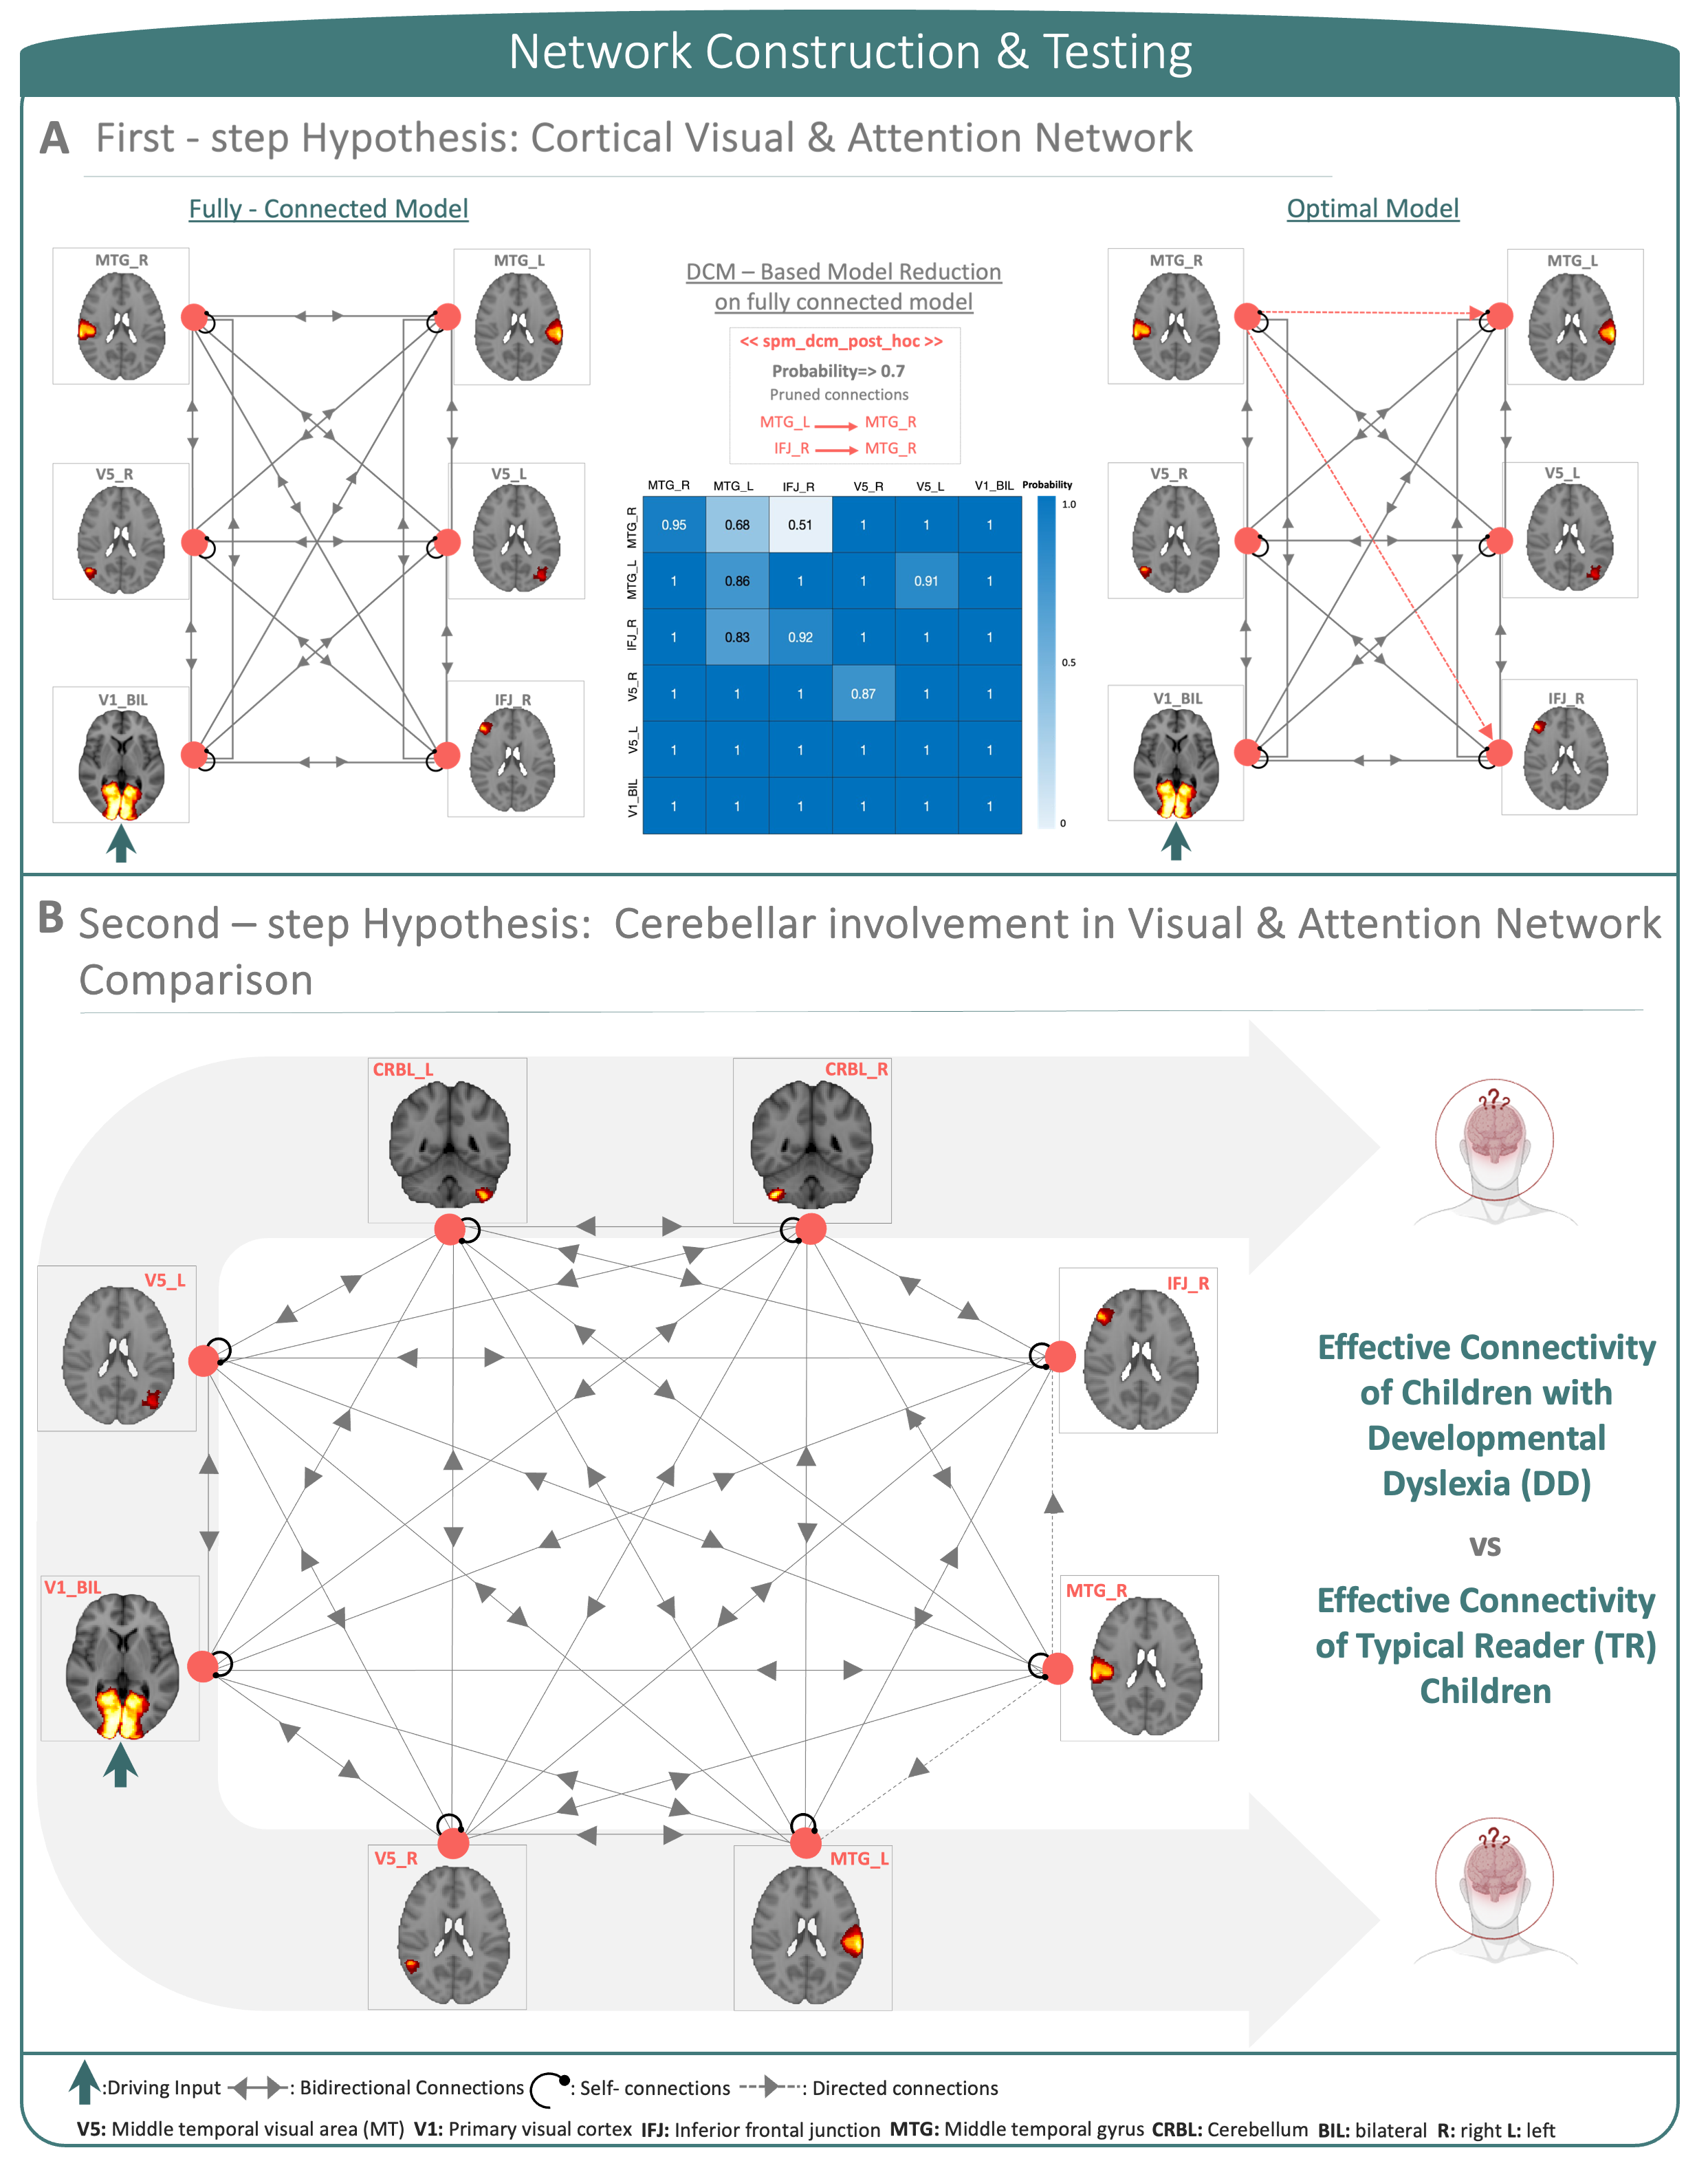
DCM analysis: A two-step analysis was implemented: as a first-step hypothesis, a fully-connected DCM model of cortical-only regions was created. By the task nature, V1 was defined as the driving-region4. A reduced optimal model was selected by using DCM post-hoc approximations10 (Figure 2A). As a second-step, cerebellar regions were added to the first-step hypothesis model to investigate effective connectivity differences between children with DD and TR children (Figure 2B).
Results and Discussion
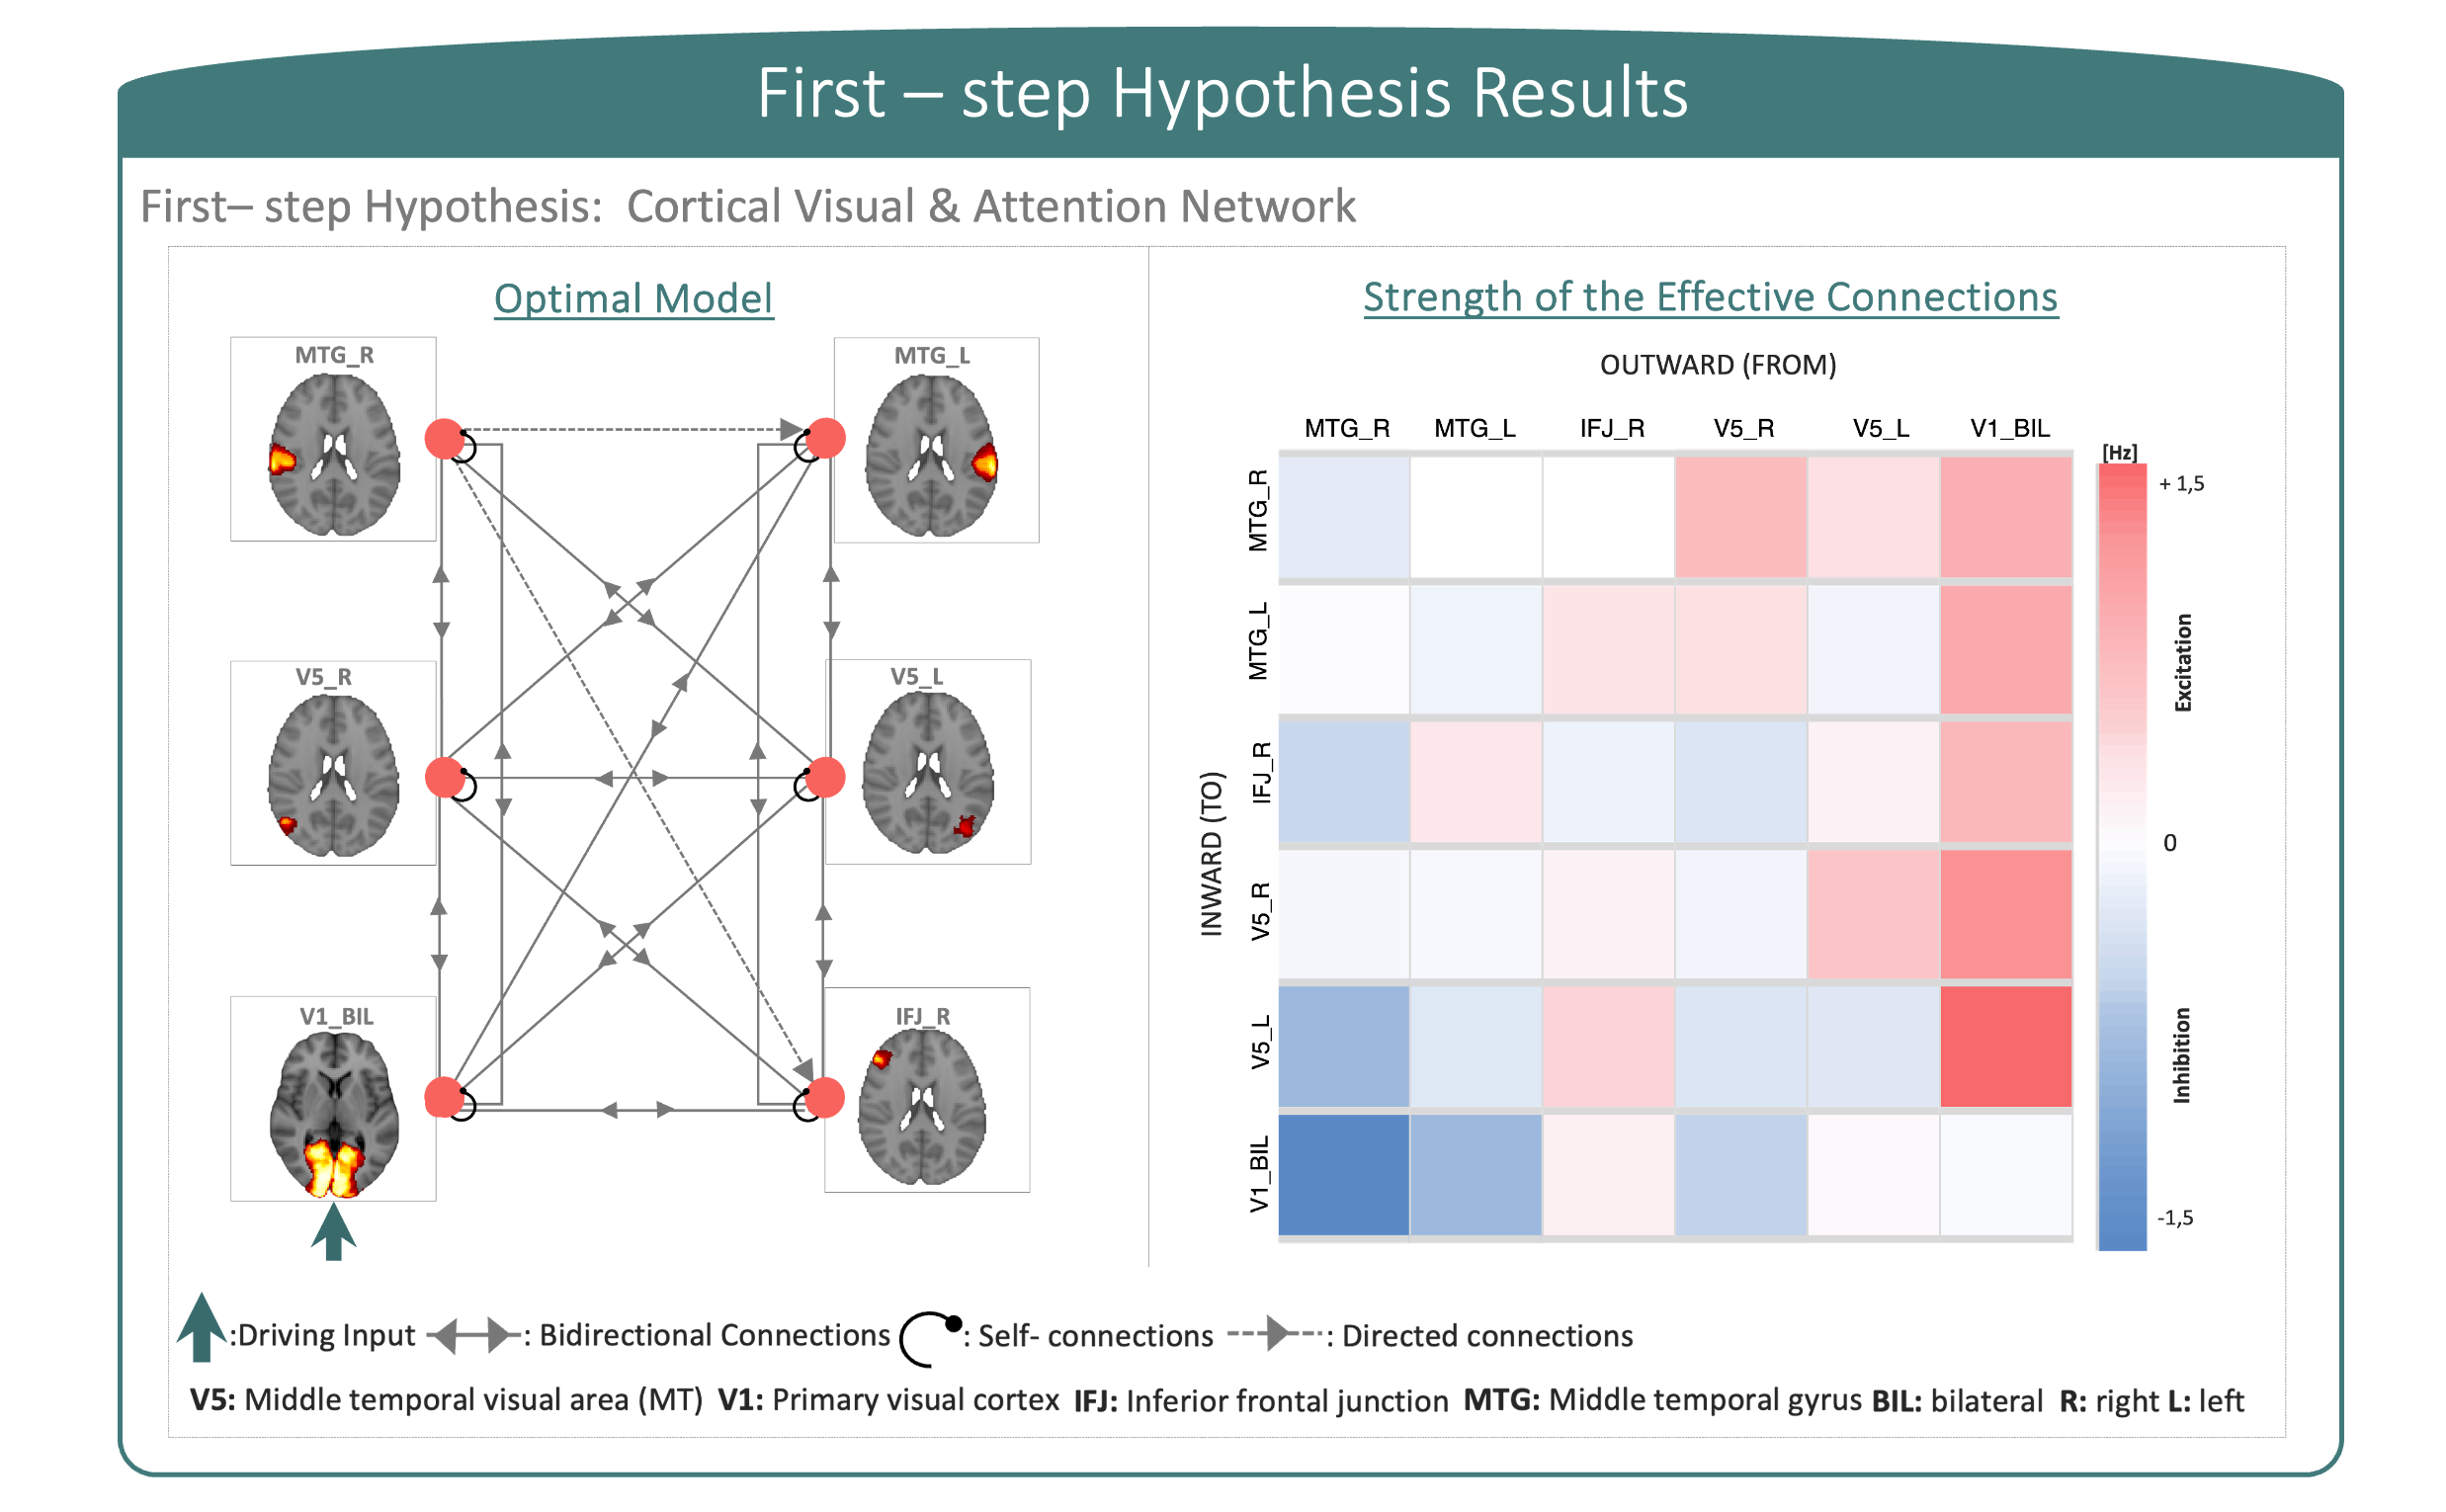
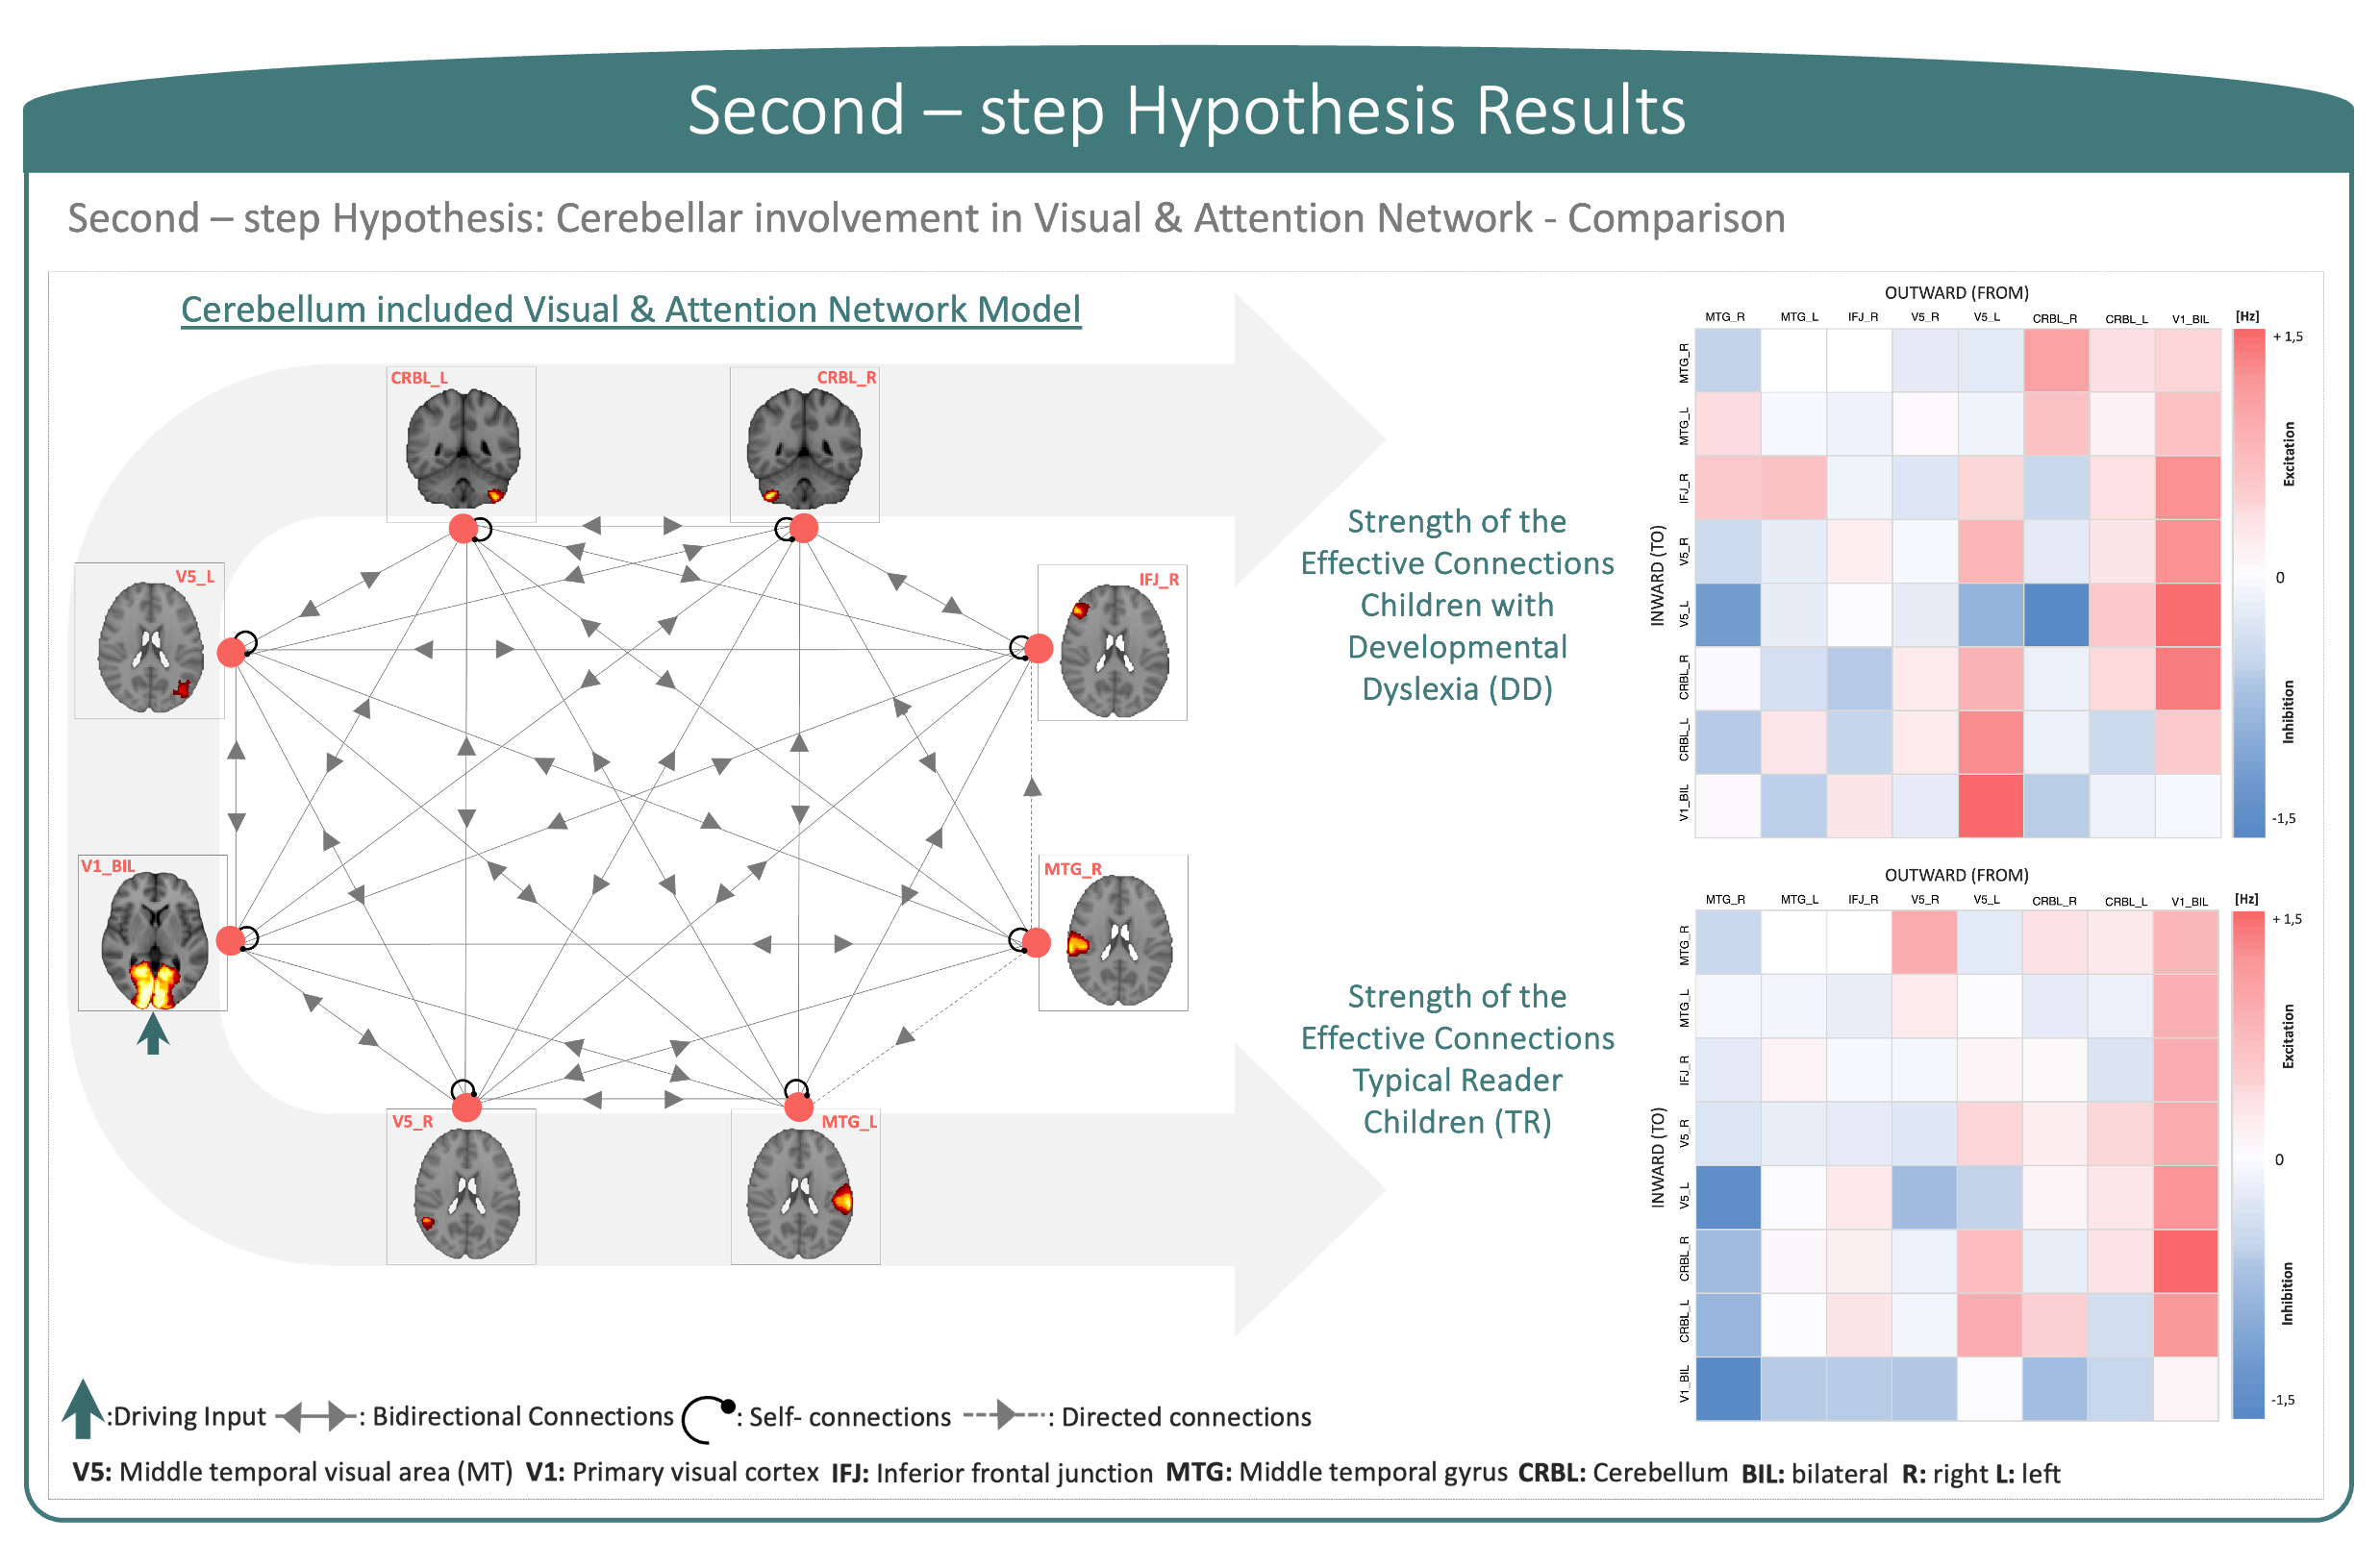
The first-step hypothesis model showed effective connectivity motifs that displayed dominant directionality and effective entrainment between cortical regions. Moreover, non-symmetric excitatory (showed in red) and inhibitory (showed in blue) connections between regions displayed heterogeneity and symmetry-breaking in connection strengths (Figure 3). Second-step hypothesis models on DD and TR arbitrated the diverging effective connectivity between cortical regions and the cerebellum, supporting evidence of cerebellar involvement in impairments showed by children with DD (Figure 4).In this study, effective connectivity differences between children with DD and TR children demonstrated a prominent role of the cerebellum in determining causal propagation of excitatory and inhibitory signals throughout the visuo-attention network. In both groups, visual input coming from V1 influenced cortical regions and highly excited V5, suggesting that focal hyper-activation is needed for visuo-motor processing to integrate reliance in visuo-perceptual strategies. Moreover, cerebellar involvement differed in the two groups, particularly the connections from CRBL_R to CRBL_L and IFJ_R became inhibitory while connections between CRBL_R and MTG_L, and CRBL_L and IFJ_R became excitatory in the effective connectivity network of children with DD. Considering the role of regions involved in this aberrant effective connectivity in children with DD, we suggest that the cerebellum may be responsible for impaired automatization skills and optimization of the visual attentional shift11-15.Moreover, our results are consistent with previous functional connectivity studies of cerebellar involvement in developmental dyslexia, which propose a disconnection and altered functional activation between frontal, temporal and cerebellar regions19-21. However, previous functional connectivity studies were not directionally specific; so, the current study additionally implicates the causal connectivity between regions in the cortex and the cerebellum. Furthermore, our results show that children with DD displayed remarkable differences in patterns of excitatory and inhibitory communication between regions within visual and attention networks, compared to TR children. Impairments associated with developmental dyslexia go beyond reading-related skills and may be explained by abnormal cerebellar function, which impacts not only on automatization, but also on sensory and cognitive processes.
Conclusions
Abnormal cortico-cerebellar interactions can be an indicator of visuo-attentional impairments in developmental dyslexia and can add additional evidence explaining the complexity of the disorder.Acknowledgements
This study was partially supported by “Ricerca Corrente 2023” funds provided by the Italian Ministry of Health. CGWK receives funding from Horizon2020 [Research and Innovation Action Grants Human Brain Project 945539 (SGA3)], BRC (#BRC704/CAP/CGW), MRC (#MR/S026088/1), Ataxia UK, Rosetrees Trust (#PGL22/100041 and #PGL21/10079). CGWK is a shareholder in Queen Square Analytics Ltd. H2020 Research and Innovation Action Grants Human Brain Project 785907 and 945539 (SGA2 and SGA3) to ED'A and FP. Moreover, the project was supported by the MNL Project “Local Neuronal Microcircuits” of the Centro Fermi (Rome, Italy) This work was also supported by #NEXTGENERATIONEU (NGEU) and funded by the Ministry of University and Research (MUR), National Recovery and Resilience Plan (NRRP), project MNESYS (PE0000006) - A Multiscale integrated approach to the study of the nervous system in health and disease (DN. 1553 11.10.2022)
References
1. Seghier, M. L., Zeidman, P., Neufeld, N. H., Leff, A. P., & Price, C. J. (2010). Identifying abnormal connectivity in patients using dynamiccausal modeling of FMRI responses. Frontiers in systems neuroscience, 4, 142.
2. Nicolson, R. I., Fawcett, A. J., & Dean, P. (2001). Developmental dyslexia: the cerebellar deficit hypothesis. Trends in neurosciences, 24(9), 508-511.
3. Friston, K. J., Harrison, L., & Penny, W. (2003). Dynamic causal modelling. Neuroimage, 19(4), 1273-1302.
4. Mascheretti, S., Peruzzo, D., Andreola, C., Villa, M., Ciceri, T., Trezzi, V., ... & Arrigoni, F. (2021). Selecting the most relevant brain regions to classify children with developmental dyslexia and typical readers by using complex magnocellular stimuli and multiple kernel learning. Brain Sciences, 11(6), 722.
5. American Psychiatric Association. Diagnostic and Statistical Manual of Mental Disorders, 4th ed.; American Psychiatric Association: Washington, DC, USA, 2006.
6. Hoeft, F., Hernandez, A., McMillon, G., Taylor-Hill, H., Martindale, J. L., Meyler, A., ... & Gabrieli, J. D. (2006). Neural basis of dyslexia: a comparison between dyslexic and nondyslexic children equated for reading ability. Journal of Neuroscience, 26(42), 10700-10708.
7. Turkeltaub, P. E., Gareau, L., Flowers, D. L., Zeffiro, T. A., & Eden, G. F. (2003). Development of neural mechanisms for reading. Nature neuroscience, 6(7), 767-773.
8. Corbetta, M., & Shulman, G. L. (2011). Spatial neglect and attention networks. Annual review of neuroscience, 34, 569-599.
9. Gebauer, D., Fink, A., Kargl, R., Reishofer, G., Koschutnig, K., Purgstaller, C., ... & Enzinger, C. (2012). Differences in brain function and changes with intervention in children with poor spelling and reading abilities. PloS one, 7(5), e38201.
10. Rosa, M. J., Friston, K., & Penny, W. (2012). Post-hoc selection of dynamic causal models. Journal of neuroscience methods, 208(1), 66–78. https://doi.org/10.1016/j.jneumeth.2012.04.013
11. Mariën, P., Ackermann, H., Adamaszek, M. et al. Consensus Paper: Language and the Cerebellum: an Ongoing Enigma. Cerebellum 13, 386–410 (2014). https://doi.org/10.1007/s12311-013-0540-5
12. Li, H., Kepinska, O., Caballero, J. N., Zekelman, L., Marks, R. A., Uchikoshi, Y., ... & Hoeft, F. (2021). Decoding the role of the cerebellum in the early stages of reading acquisition. Cortex, 141, 262-279.
13. Alvarez, T. A., & Fiez, J. A. (2018). Current perspectives on the cerebellum and reading development. Neuroscience & Biobehavioral Reviews, 92, 55-66.
14. Paulesu, E., Danelli, L., & Berlingeri, M. (2014). Reading the dyslexic brain: multiple dysfunctional routes revealed by a new meta-analysis of PET and fMRI activation studies. Frontiers in human neuroscience, 8, 830.
15. Ito, M. (2008). Control of mental activities by internal models in the cerebellum. Nature Reviews Neuroscience, 9(4), 304-313.
16. Nummenmaa, L., Hyönä, J., & Calvo, M. G. (2006). Eye movement assessment of selective attentional capture by emotional pictures. Emotion, 6(2), 257.
17. Cai, W., & Leung, H. C. (2009). Cortical activity during manual response inhibition guided by color and orientation cues. Brain research, 1261, 20-28.
18. Richlan, F. (2012). Developmental dyslexia: dysfunction of a left hemisphere reading network. Frontiers in human neuroscience, 6, 120.
19. Ashburn, S. M., Flowers, D. L., Napoliello, E. M., & Eden, G. F. (2020). Cerebellar function in children with and without dyslexia during single word processing. Human brain mapping, 41(1), 120-138.
20. Barth, A. E., Denton, C. A., Stuebing, K. K., Fletcher, J. M., Cirino, P. T., Francis, D. J., & Vaughn, S. (2010). A test of the cerebellar hypothesis of dyslexia in adequate and inadequate responders to reading intervention. Journal of the International Neuropsychological Society, 16(3), 526-536.
21. Nicolson, R. I., & Fawcett, A. J. (2011). Dyslexia, dysgraphia, procedural learning and the cerebellum. Cortex, 47(1), 117-127.
22. Zeidman, P., Jafarian, A., Corbin, N., Seghier, M. L., Razi, A., Price, C. J., & Friston, K. J. (2019). A guide to group effective connectivity analysis, part 1: First level analysis with DCM for fMRI. Neuroimage, 200, 174-190.
Figures