1104
Refinement of the model and types of data for quantitative Magnetization Transfer (qMT) in brain tissues1Radiology, Division of MRI Research, Beth Israel Deaconess Medical Center, Harvard Medical School, Boston, MA, United States, 2CNRS, CRMBM, Aix Marseille Univ, Marseille, France
Synopsis
Keywords: Magnetization Transfer, Magnetization transfer, qMT, ihMT, brain microstructure
Motivation: To improve the accuracy of quantitative Magnetization Transfer (qMT) for interrogation of brain microstructure.
Goal(s): To determine: i) the model for qMT that best describes the signal from MT and inhomogeneous MT (ihMT) experiments, and ii) the MT preparations that contribute useful data.
Approach: We tested accuracies of the models based on fit quality in-vivo and ex-vivo, comparing ex-vivo qMT at physiological and room temperatures. Data were retrospectively reduced to test the importance of types of MT preparations.
Results: We recommend a model with two bound-pool T2 values and use of different MT pulse widths and duty cycles as a result.
Impact: Our results will impact the model and data acquired for quantitative Magnetization Transfer (qMT) of brain tissues. Use of a two bound-pool model with distinct T2 values and data inputs with variations in MT pulse width and DC is recommended.
Introduction
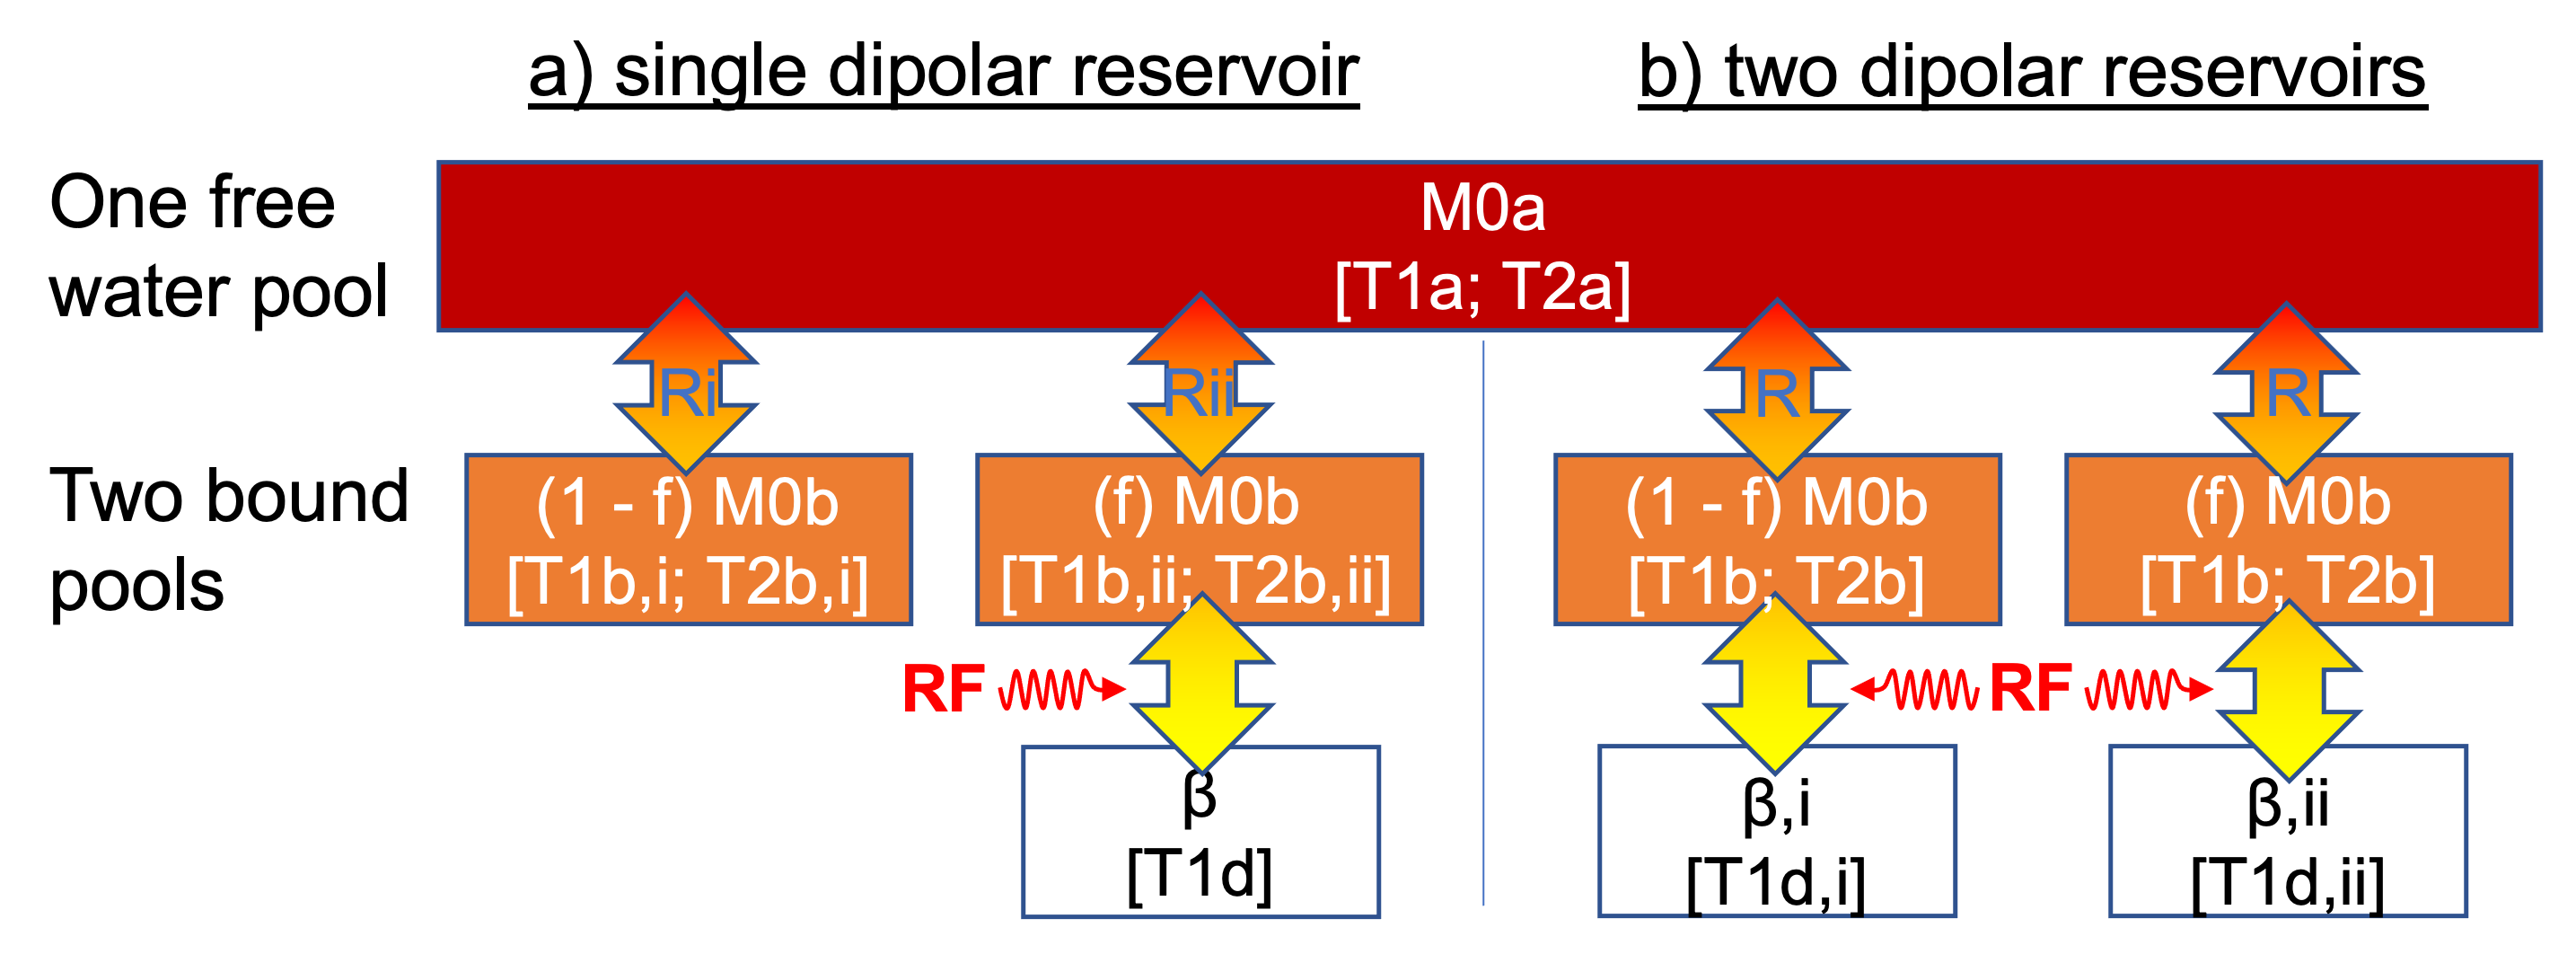
A goal of quantitative MRI is for objective analysis in studies of pathology, e.g. multiple sclerosis (MS). Quantitative MRI can involve acquisition of multiple images so methods for dataset reduction are advantageous for considerations like scan time. For example, MR fingerprinting (MRF) can involve multiple reduced k-space single-shot acquisitions with different parameters in each shot to optimally vary signal, which when fit to a model provide quantitative outputs1. In such applications, the accuracy of the model is also important. Magnetization Transfer (MT) is modelled as the effect of RF irradiation on short T2 tissues described by a bound-pool and recording signal attenuation based on transfer of magnetization from the bound-pool to a more readily measurable free-pool (Fig.1)2. Recent applications of MRF include outputs related to quantitative Magnetization Transfer (qMT), including an example with the inhomogeneous MT (ihMT) technique3. However, the model used to describe ihMT data, particularly the number of compartments (and unique parameter values) given to the bound-pool is still a subject of study3–5.In this work, we demonstrate: i) description of the bound-pool with two compartments of distinct T2 values (T2bs) more accurately describes data from ihMT than the current model considered e.g., for MRF3; and ii) the importance of variations in the MT preparations i.e, MT pulse-width and duty cycle (DC), for qMT.Methods
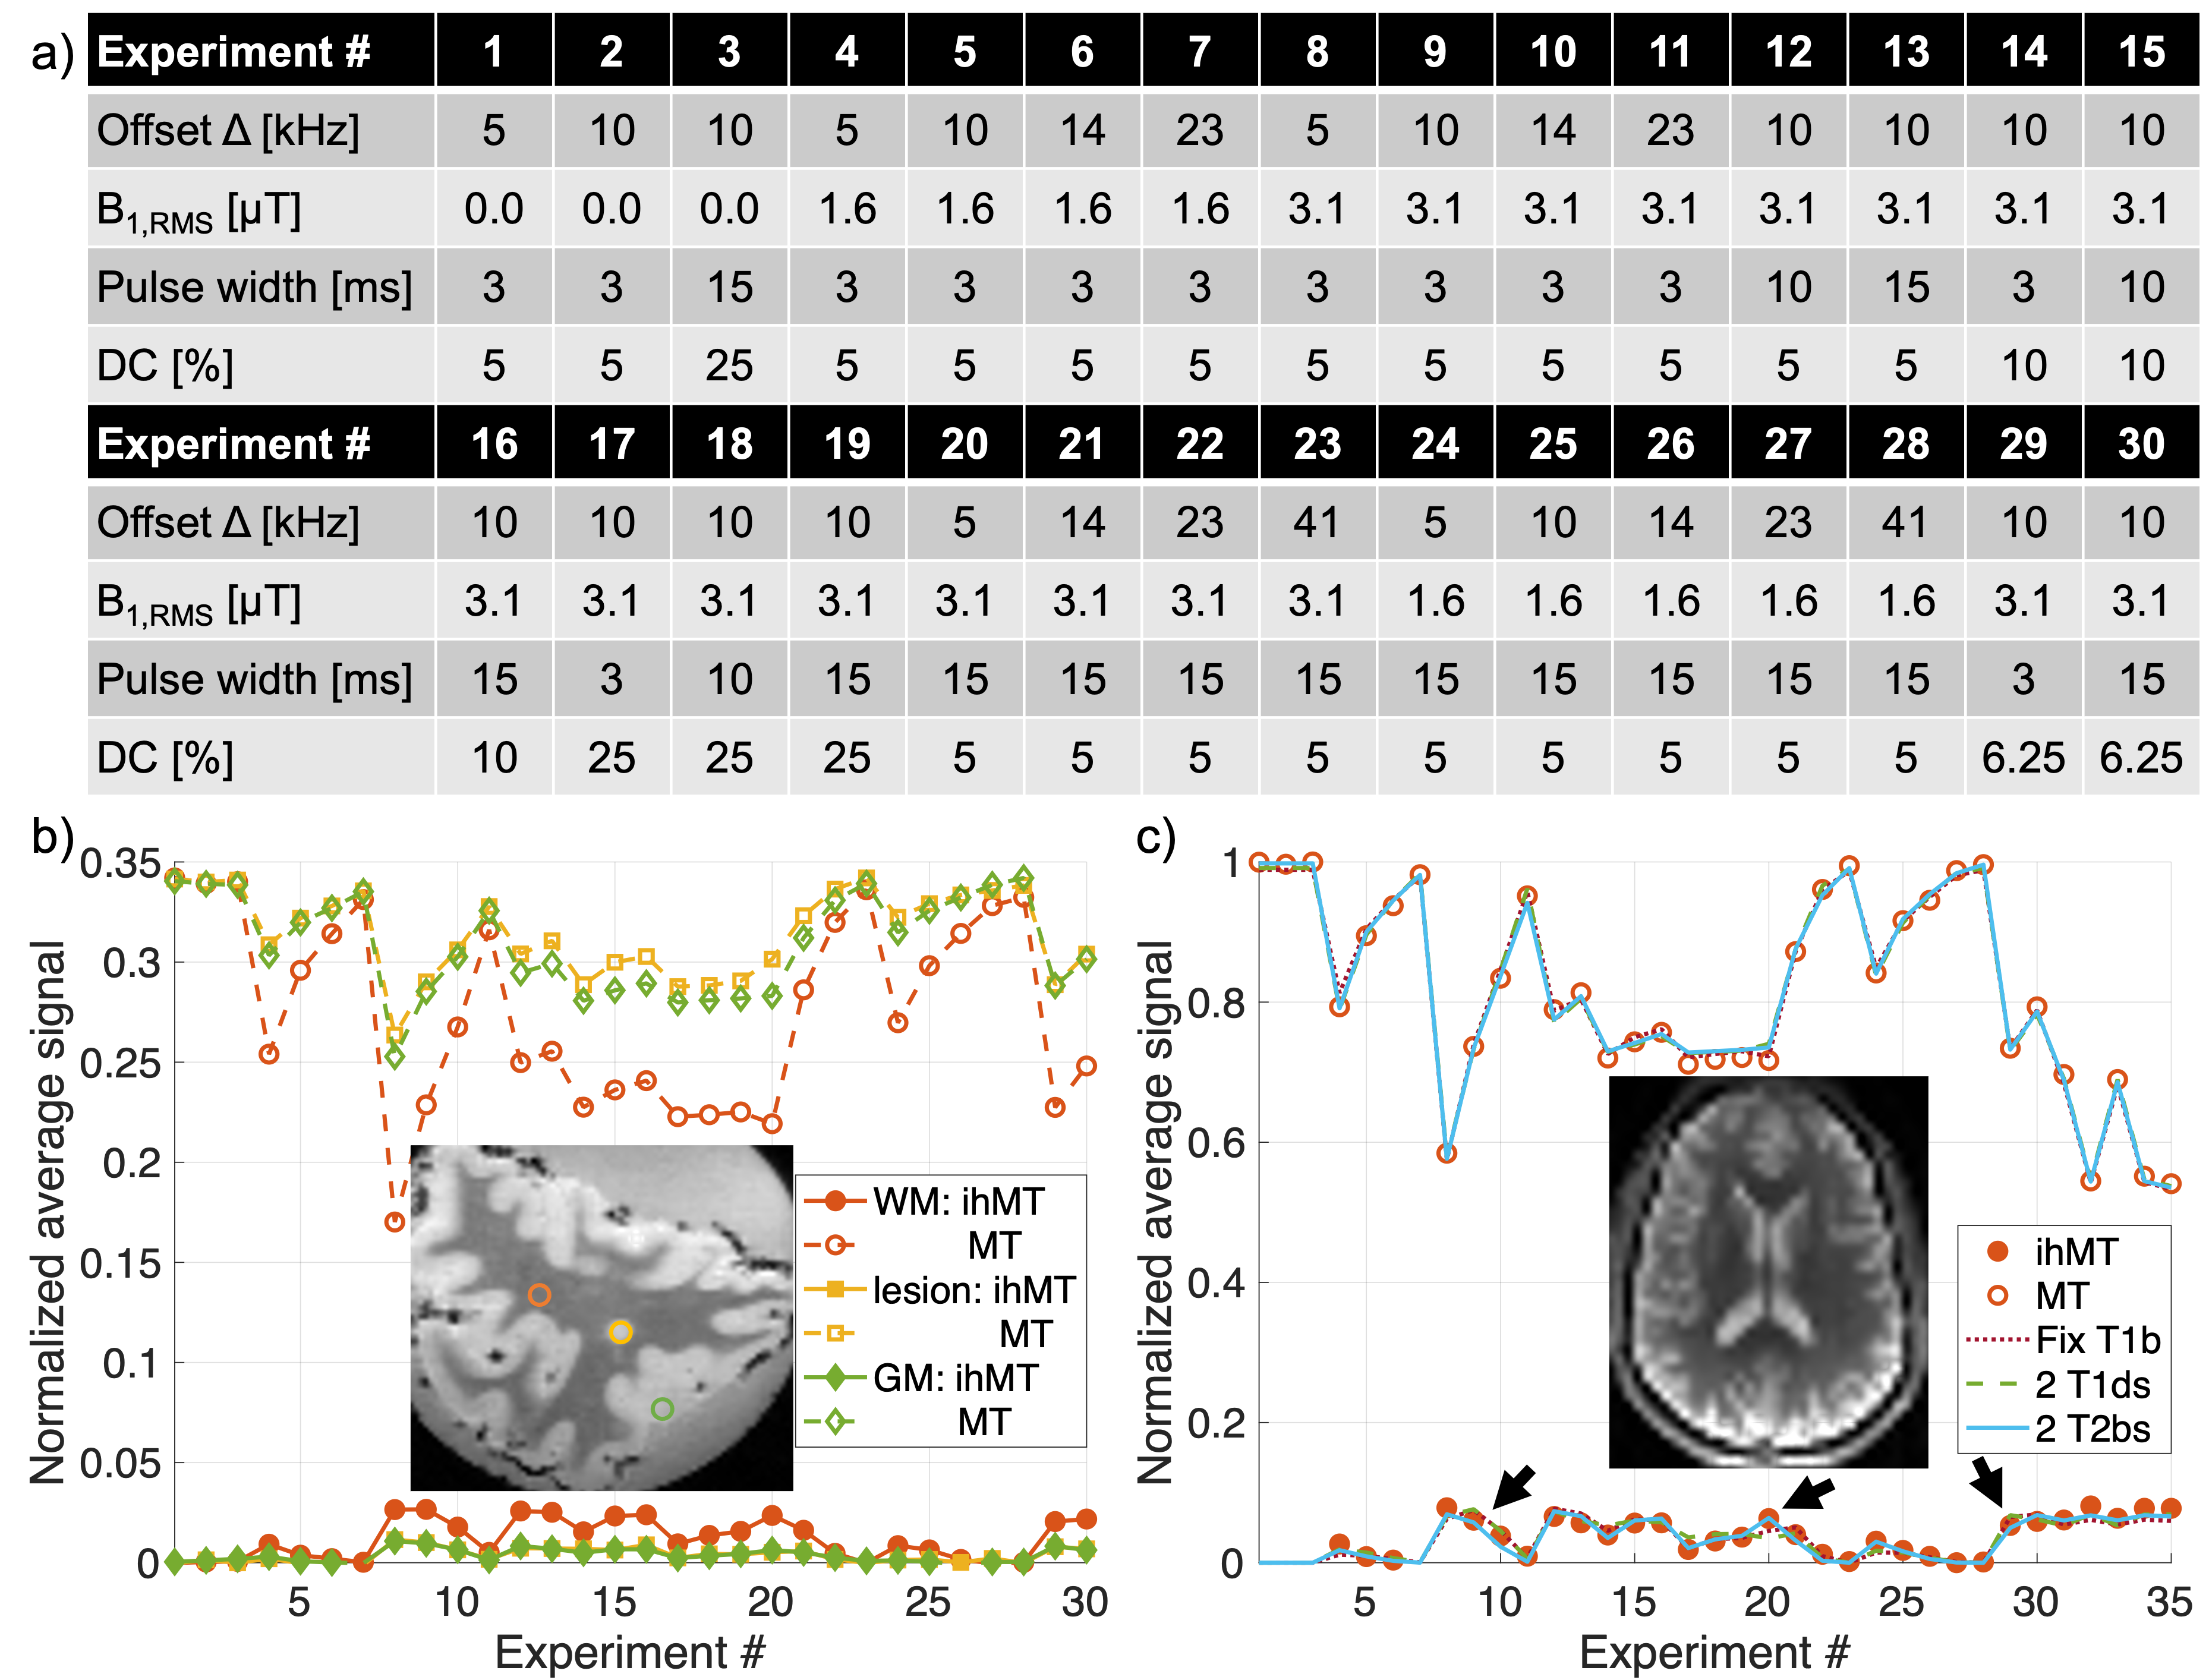
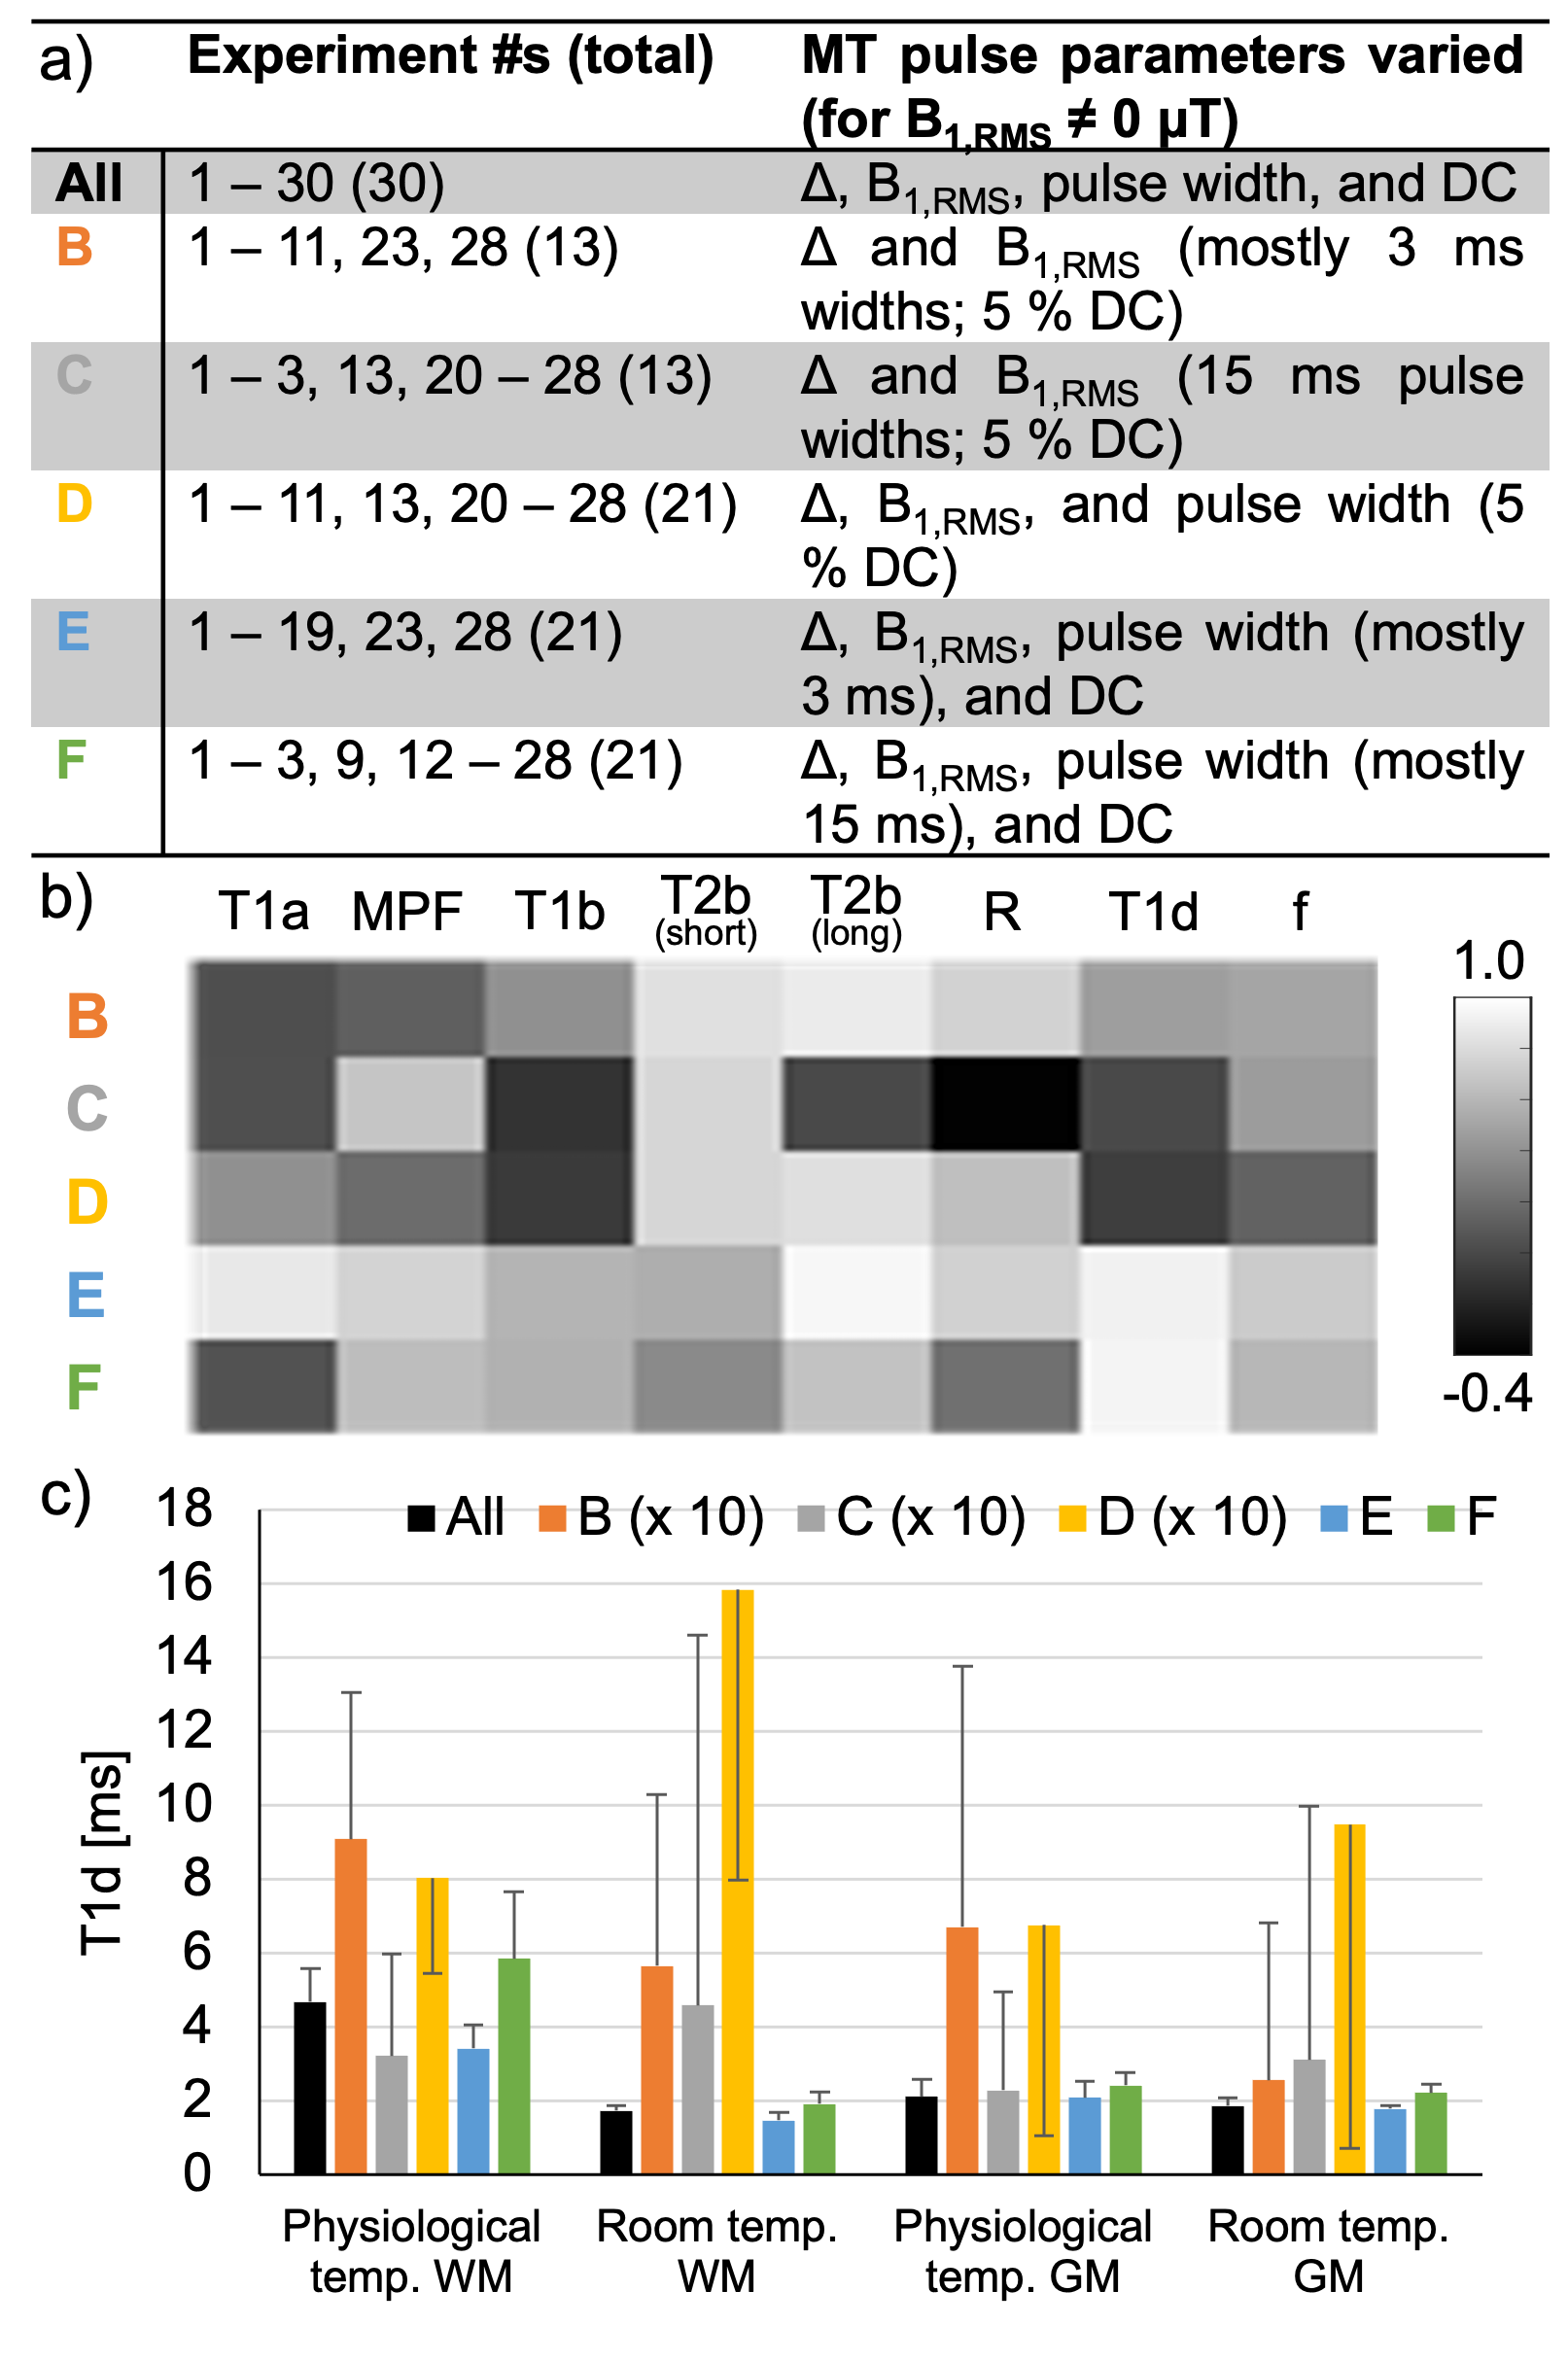
We acquired data in a postmortem fixed brain slice from a 50-year-old male with MS at 9.4T with a transmit/receive volume coil (diameter=86mm), at 37°C and room temperatures, and human volunteers (n=3 males, ages=23-43 years) at 3T with a 48-channel head-coil. MT preparations for ihMT with different parameters (Fig.2a) were applied prior to 3D MPRAGE-style readouts6 ex-vivo and single-slice, single-shot EPI in-vivo5. Parameters for qMT were output following global fits (using Matlab R2023a) of the resultant MT (from dual frequency RF) and ihMT (the difference between single and dual frequency MT) data in white/grey matter (WM/GM) ROIs. Data were fit to variations of the model with two bound-pools and single dipolar order reservoir of relaxation time T1d, the source of ihMT signal (1 T1d), including one where the bound-pool T1, T1b=1s-1 (Fix T1b)2. Other variations involved distinct values for the two bound-pools: 2 T1ds (Fig.1b); 2 T2bs; 2 Rs (exchange rates); 2 T1bs. We calculated coefficients of determination, R2 adjusted to account for degrees of freedom in each model to compare fit quality. Data were retrospectively reduced and fit to the 2 T2bs model to compare sensitivity to the types of data input.Results
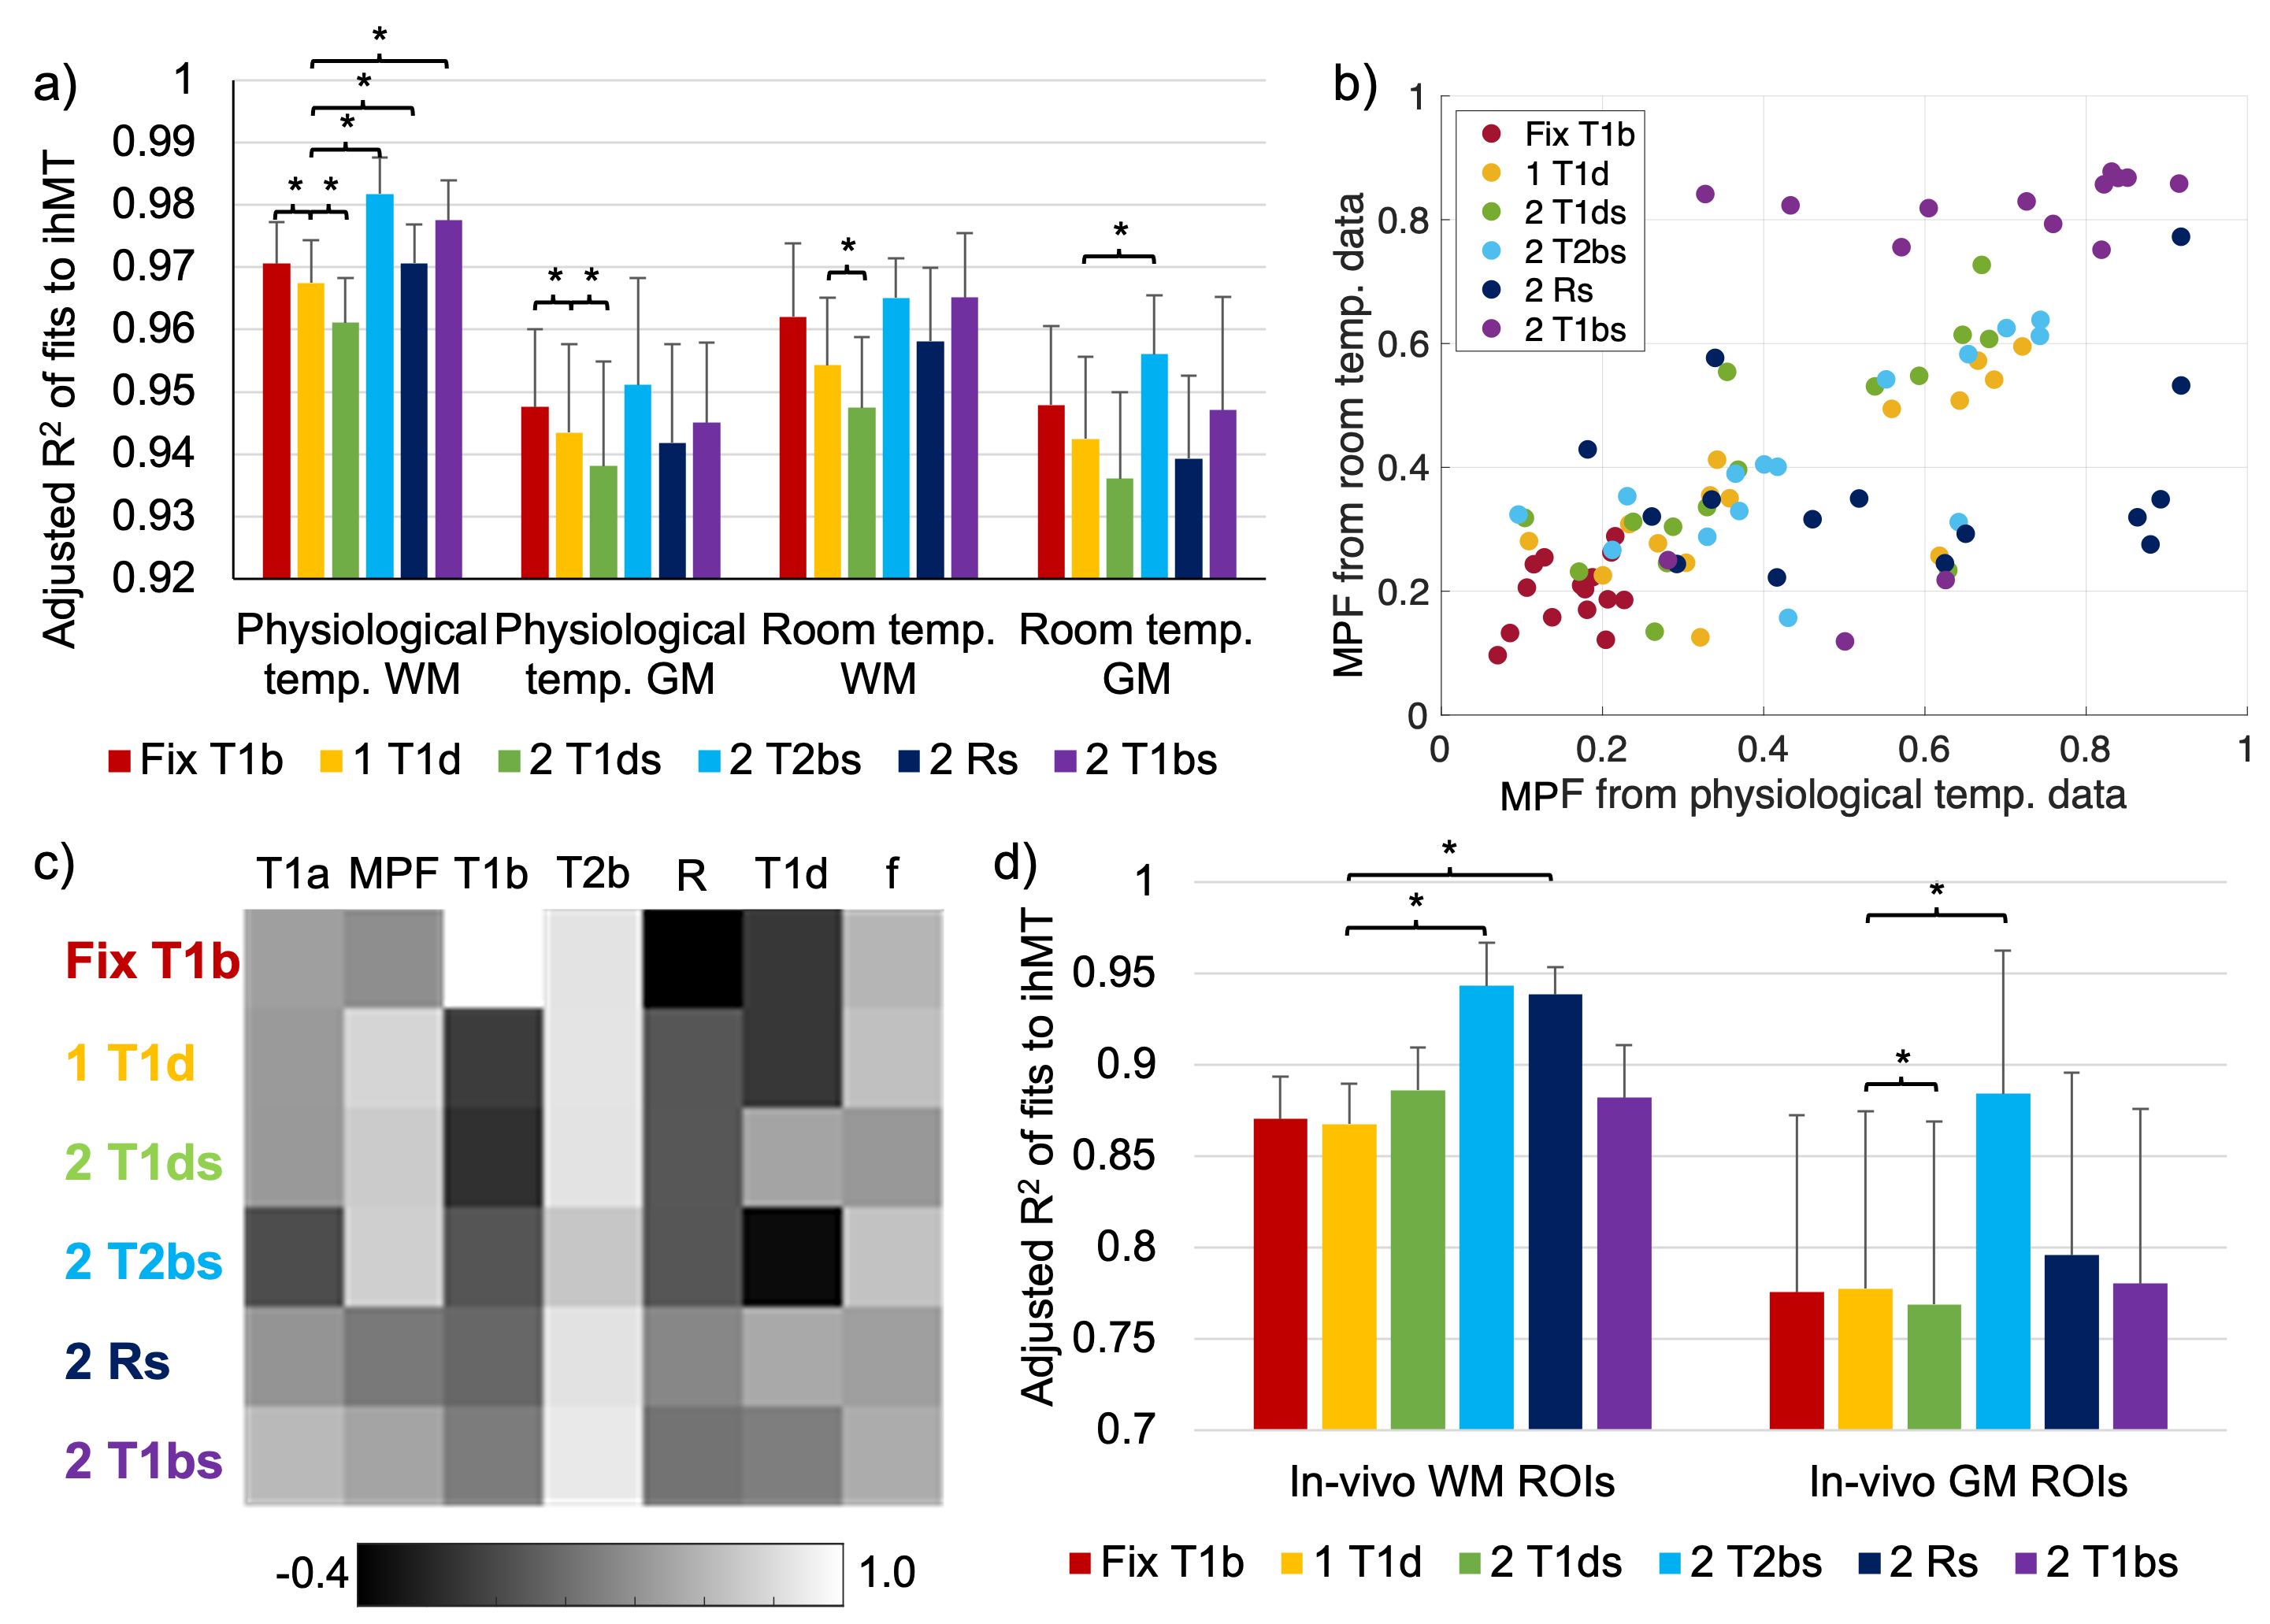
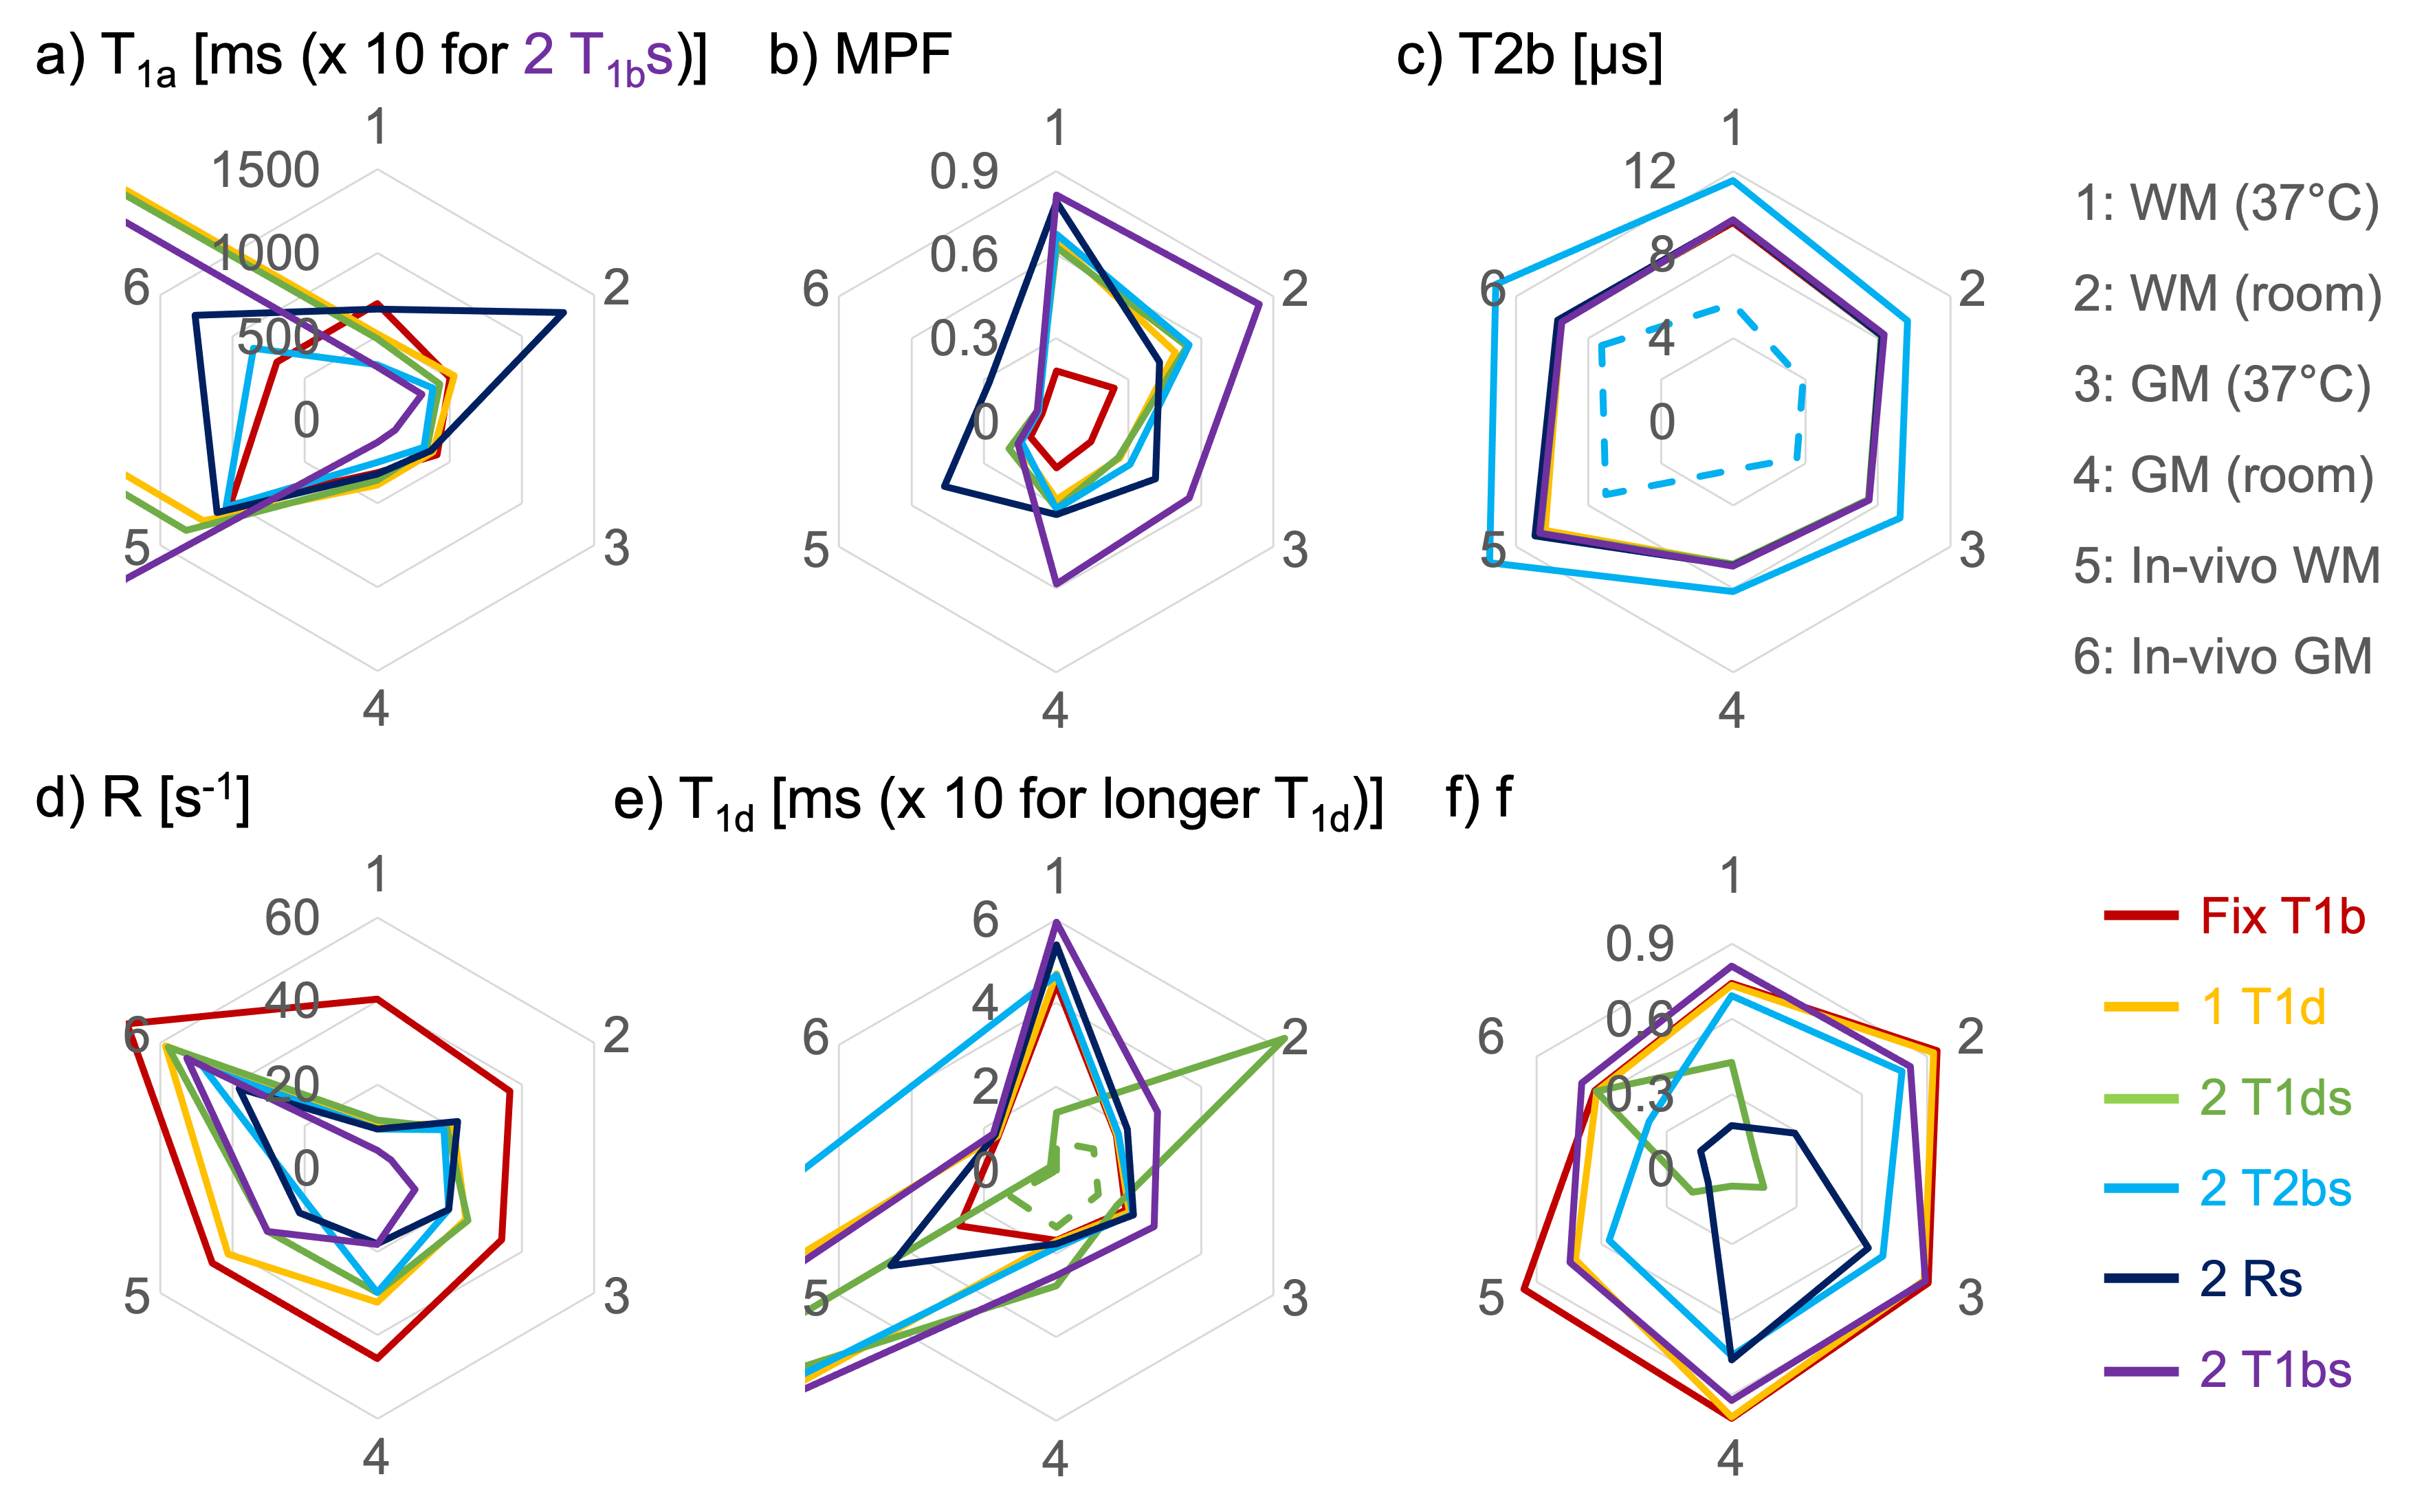
Based on adjusted R2 values, fits to the dual MT signal data were relatively consistent across models. However, the 2 T2bs model provided the best fit quality (Figs.2c,3). We expect the fractional size of bound-pool to the total or macromolecular proton fraction (MPF) to remain consistent. The accuracy of models: 1 T1d, 2 T1ds, and 2 T2bs, are thus supported by strong correlations (ρ≥0.7,p<0.01) between MPF from ex-vivo physiological and room temperature qMT (Figs.3b-c). MPF values using the Fix T1b model were lowest. Across models, ex-vivo MPF values in the fixed tissue were higher than those in-vivo. We compared outputs from qMT with radar plots for which overlapping lines across models were expected (Fig.4). Contours relating to the 2 T2bs model were relatively consistent with values output from the majority of the other models for each qMT parameter. The strongest correlations between use of All and reduced datasets, over all qMT outputs, were for those that maintained variation in MT pulse-width and DC (Figs.5a-b).Discussion
While a more continuous distribution might represent reality, two T2b values provided a significant improvement to the model for qMT (Fig.3). Notable separation of T2b values might be attributed to orientation7–9, presenting a potential means of isolating the effect. This improvement was more prominent for the ihMT signal (relative to the dual frequency MT signal), suggesting its potential utility for qMT using single frequency MT data. Retrospective data reduction exemplifies how the acquisition for qMT can be optimized. Our results highlighted additional sensitivity to qMT parameters using different MT pulse-width and DC, alongside the more standard changes to Δ and B12,5. For example, double digit T1ds with large variances were output from fits to data with little to no MT pulse-width and DC variation (Fig.5c), which suggests inaccuracy in similar outputs in prior literature5.Conclusion
The accuracy of the model for qMT using ihMT data was improved by considering two T2bs for each bound-pool in exchange with the free-pool. Inclusion of data from MT preparations of varying MT pulse-width and DC improved sensitivity to qMT parameters e.g., T1d.Acknowledgements
G.D., O.M.G, and L.S. received financial support from the French Government by the National Research Agency (ANR; ULTIMO; ANR-22-CE18-0041-01).References
- Ma, D. et al. Magnetic resonance fingerprinting. Nature 495, 187–192 (2013).
- Morrison, C., Stanisz, G. & Henkelman, R. M. Modeling magnetization transfer for biological-like systems using a semi-solid pool with a super-Lorentzian lineshape and dipolar reservoir. J Magn Reson B 108, 103–113 (1995).
- West, D. J. et al. An MR fingerprinting approach for quantitative inhomogeneous magnetization transfer imaging. Magnetic Resonance in Medicine 87, 220–235 (2022).
- Carvalho, V. N. D. et al. MRI assessment of multiple dipolar relaxation time (T1D) components in biological tissues interpreted with a generalized inhomogeneous magnetization transfer (ihMT) model. J Magn Reson 311, 106668 (2020).
- Varma, G. et al. Interpretation of magnetization transfer from inhomogeneously broadened lines (ihMT) in tissues as a dipolar order effect within motion restricted molecules. Journal of Magnetic Resonance 260, 67–76 (2015).
- Varma, G. et al. Three-dimensional inhomogeneous magnetization transfer with rapid gradient-echo (3D ihMTRAGE) imaging. Magnetic Resonance in Medicine 84, 2964–2980 (2020).
- Tax, C. M. W. et al. Measuring compartmental T2-orientational dependence in human brain white matter using a tiltable RF coil and diffusion-T2 correlation MRI. NeuroImage 236, 117967 (2021).
- Girard, O. M. et al. Anisotropy of Inhomogeneous Magnetization Transfer (IhMT) in White Matter. in Proceedings of International Society for Magnetic Resonance in Medicine 0472 (2017).
- Pampel, A., Müller, D. K., Anwander, A., Marschner, H. & Möller, H. E. Orientation dependence of magnetization transfer parameters in human white matter. NeuroImage 114, 136–146 (2015).
Figures