1103
BTS POSE: Rapid High Resolution 3D Quantitative MT Imaging using Novel Position Encoding and Parallel Imaging1Martinos Center for Biomedical Imaging, Harvard Medical School, Charlestown, MA, United States
Synopsis
Keywords: Magnetization Transfer, Magnetization transfer
Motivation: Current quantitative MT (qMT) methods have low resolution, limiting their ability to assess tissue microstructure.
Goal(s): Introduce a new qMT approach that achieves 3D isotropic high-resolution qMT within a clinically feasible scan time.
Approach: BTS POSE applies unique subvoxel-shifts along the acquisition parameter dimension, combined with the BTS MT signal model, to generate MT parameter maps with enhanced resolution.
Results: in-vivo results show that BTS POSE 1) enhances the image resolution at no cost of additional scan time, 2) can be combined with parallel imaging to achieve further acqusition acceleration, and 3) generates quantitative maps corresponding well with literature values.
Impact: BTS POSE uses position encoding to generate 3D MT parameter maps with enhanced resolution. This enables microstructure assessment of tissues such as myelin, an important biomarker for neurodegenerative diseases.
Introduction
Myelin is important for transmitting neural information. Demyelination can lead to neurodegenerative diseases such as multiple sclerosis (MS)1 and Alzheimer’s2. Quantitative magnetization-transfer-imaging (qMTI) can be used to characterize myelin3. MT-parameters are sensitive in MS lesions, where a decrease in free pool relaxation rate ($$$\frac{1}{T_1^\text{F}}$$$), macromolecular fraction (f) and exchange rate ($$$k_\text{F}$$$) was observed4,5. Due to its demanding RF-power and SAR constraints, current qMTI methods typically have low resolution, limiting its ability to assess fine brain-structures. High-resolution qMTI can be achieved, however, at the cost of additional scan time on top of an already long acquisition. Here, we propose a new approach that achieves isotropic 3D high-resolution qMTI within a clinically feasible scan time. It utilizes the biophysical-signal-model of the recent BTS6 method in combination with subvoxel shifting for POSition Encoding (POSE), which we demonstrate in-vivo for image resolution enhancement at no additional scan time.Theory
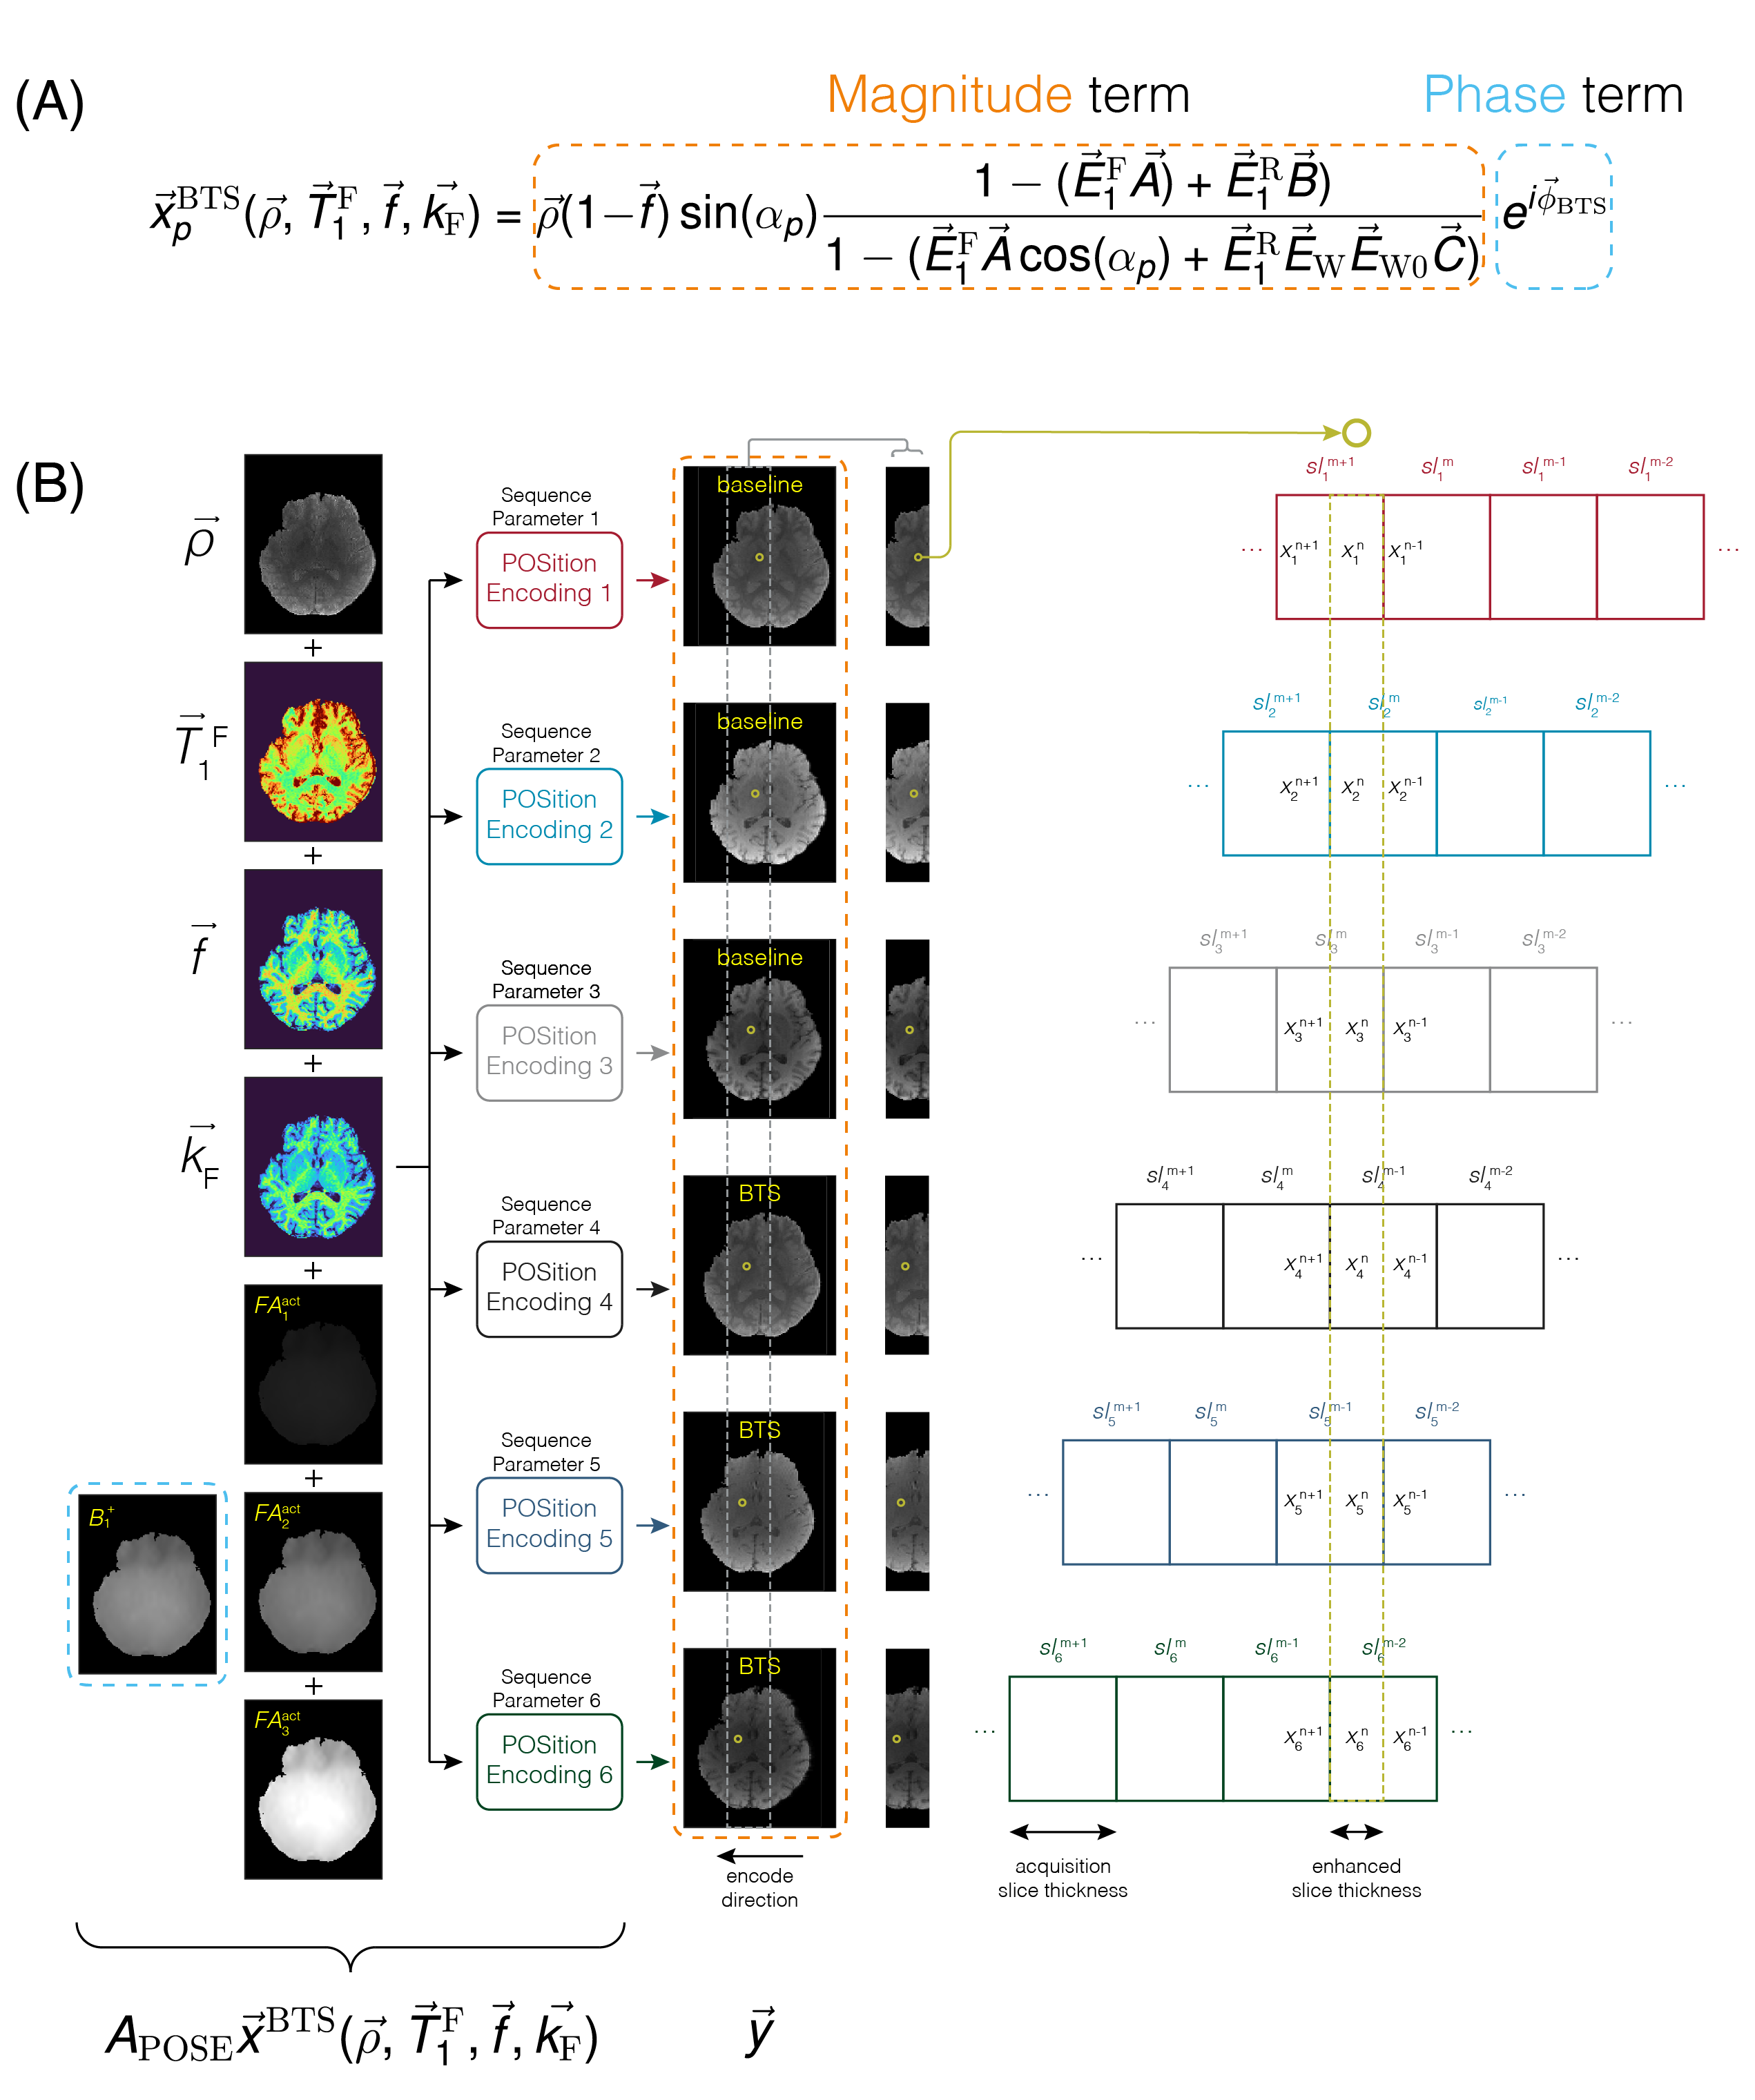
The BTS signal equation comprises a magnitude and phase term (FIG1A), where the magnitude term embodies signal modulation due to MT and phase term conveys $$$B_1^+$$$-dependent Bloch-Siegert-shift7. POSE leverages the multiple BTS acquisitions required for MT-parameter estimation by introducing subvoxel-shifts as additional encoding. Referring to FIG1B, POSE applies a unique subvoxel-shift along, in this case, the medial-lateral direction at each acquisition. Combining different contrast acquisitions with unique subvoxel-shifts, BTS signal model $$$\overrightarrow{x}_p(\overrightarrow{\rho},\overrightarrow{T_1^\text{F}},\overrightarrow{f},\overrightarrow{k_\text{F}})$$$ can be employed to extract subvoxel MT-parameter information. BTS POSE can be mathematically expressed $$$\overrightarrow{y}_p=A_\text{POSE}^p\overrightarrow{x}(\overrightarrow{\rho},\overrightarrow{T_1^\text{F}},\overrightarrow{f},\overrightarrow{k_\text{F}})+\overrightarrow{\eta}_p$$$, where $$$\overrightarrow{x}(\overrightarrow{\rho},\overrightarrow{T_1^\text{F}},\overrightarrow{f},\overrightarrow{k_\text{F}})$$$ is the length $$$n_x$$$ enhanced biophysical model image obtained from spatially dependent biophysical parameters $$$\overrightarrow{\rho},\overrightarrow{T_1^\text{F}},\overrightarrow{f},\overrightarrow{k_\text{F}}$$$ and acquisition parameter $$$p$$$, $$$A_\text{POSE}^p$$$ is the POSition Encoding matrix for acquisition parameter $$$p$$$, $$$\overrightarrow{y}_p$$$ is the length $$$n_y$$$ acquired image (<$$$n_x$$$) and $$$\overrightarrow{\eta}_p$$$ is Gaussian noise8. The $$$L_2$$$ norm of the residuum of this equation can be invoked to construct a cost function to solve for $$$\overrightarrow{\rho},\overrightarrow{T_1^\text{F}},\overrightarrow{f},\overrightarrow{k_\text{F}}$$$.Methods
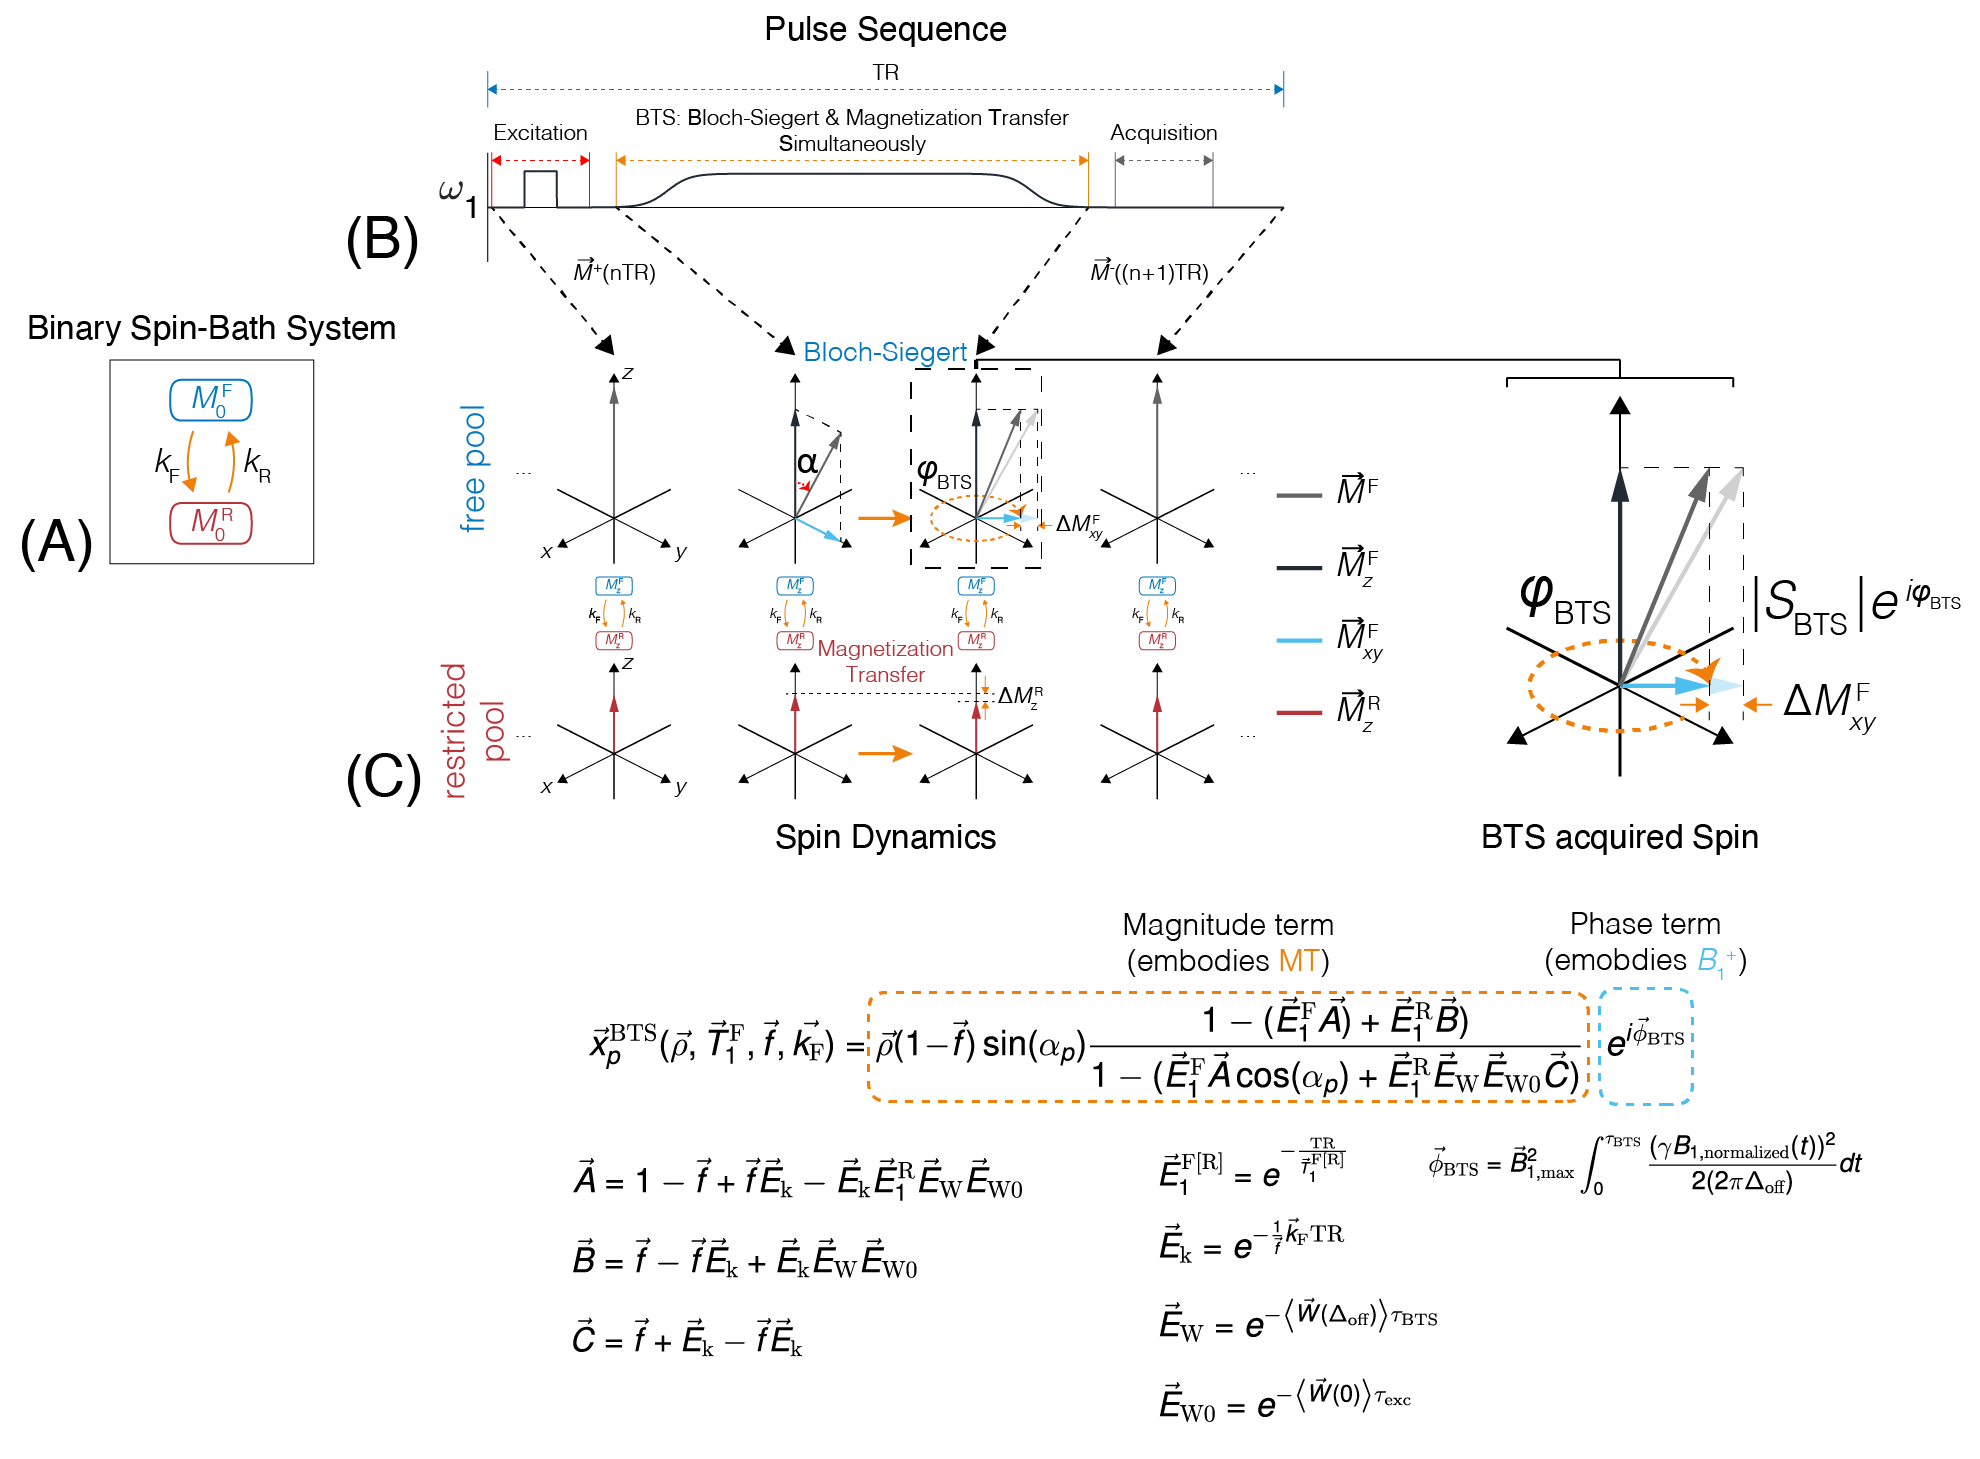
BTS is based on the binary spin-bath system (FIG2A) and acquired using a variable flip-angle scheme with (BTS) and without (baseline) off-resonance irradiation applied between excitation and acquisition (FIG 2B). In-vivo Experiments: in-vivo experiment was conducted on the whole brain of a healthy volunteer. Common 3D sequence parameters used in both BTS and baseline acquisition with POSE: sagittal plane acquisition with in-plane matrix size 174x176 and 80 slices yielding 1.2x1.2x2.0mm 3D-volume, TE/TR = 12/40ms and prescribed flip-angles (FAs) 5˚,20˚,40˚, using an 8ms fermi pulse with off-resonance frequency 4kHz with an effective flip-angle 629˚ for off-resonance saturation. 0,1,2,3,4,5 mm shifts were applied along the slice direction for each FA. The experiment was carried out on a 3T Siemens Prisma using a 32-channel head coil. Reconstruction: The $$$B_1^+$$$-dependent phase term of the BTS signal equation (FIG2C) was utilized to generate actual flip angle ($$$FA_p^\text{act}$$$) maps (FIG1B) to correct for $$$B_1^+$$$ inhomogeneity. The spatially varying $$$FA_p^\text{act}$$$ maps were subsequently combined with the magnitude term and POSition Encoding matrix ($$$A_\text{POSE}^p$$$) to generate the cost function. The cost function for BTS POSE was solved using an iterative cross-term optimization algorithm9 where the loss was minimized by first fixing the MT parameters and solving for $$$\overrightarrow{x}_p$$$ (minimize data-consistency term), followed by fixing $$$\overrightarrow{x}_p$$$ and solving for MT parameters (minimize model-consistency term). Other MT properties including macromolecule bound proton $$$T_1^\text{R}=1\text{s}$$$ and $$$T_2^\text{R}=12\mu \text{s}$$$ with a Super-Lorentzian10 absorption line shape were assumed and fixed as previous MT studies6.Results and Discussion
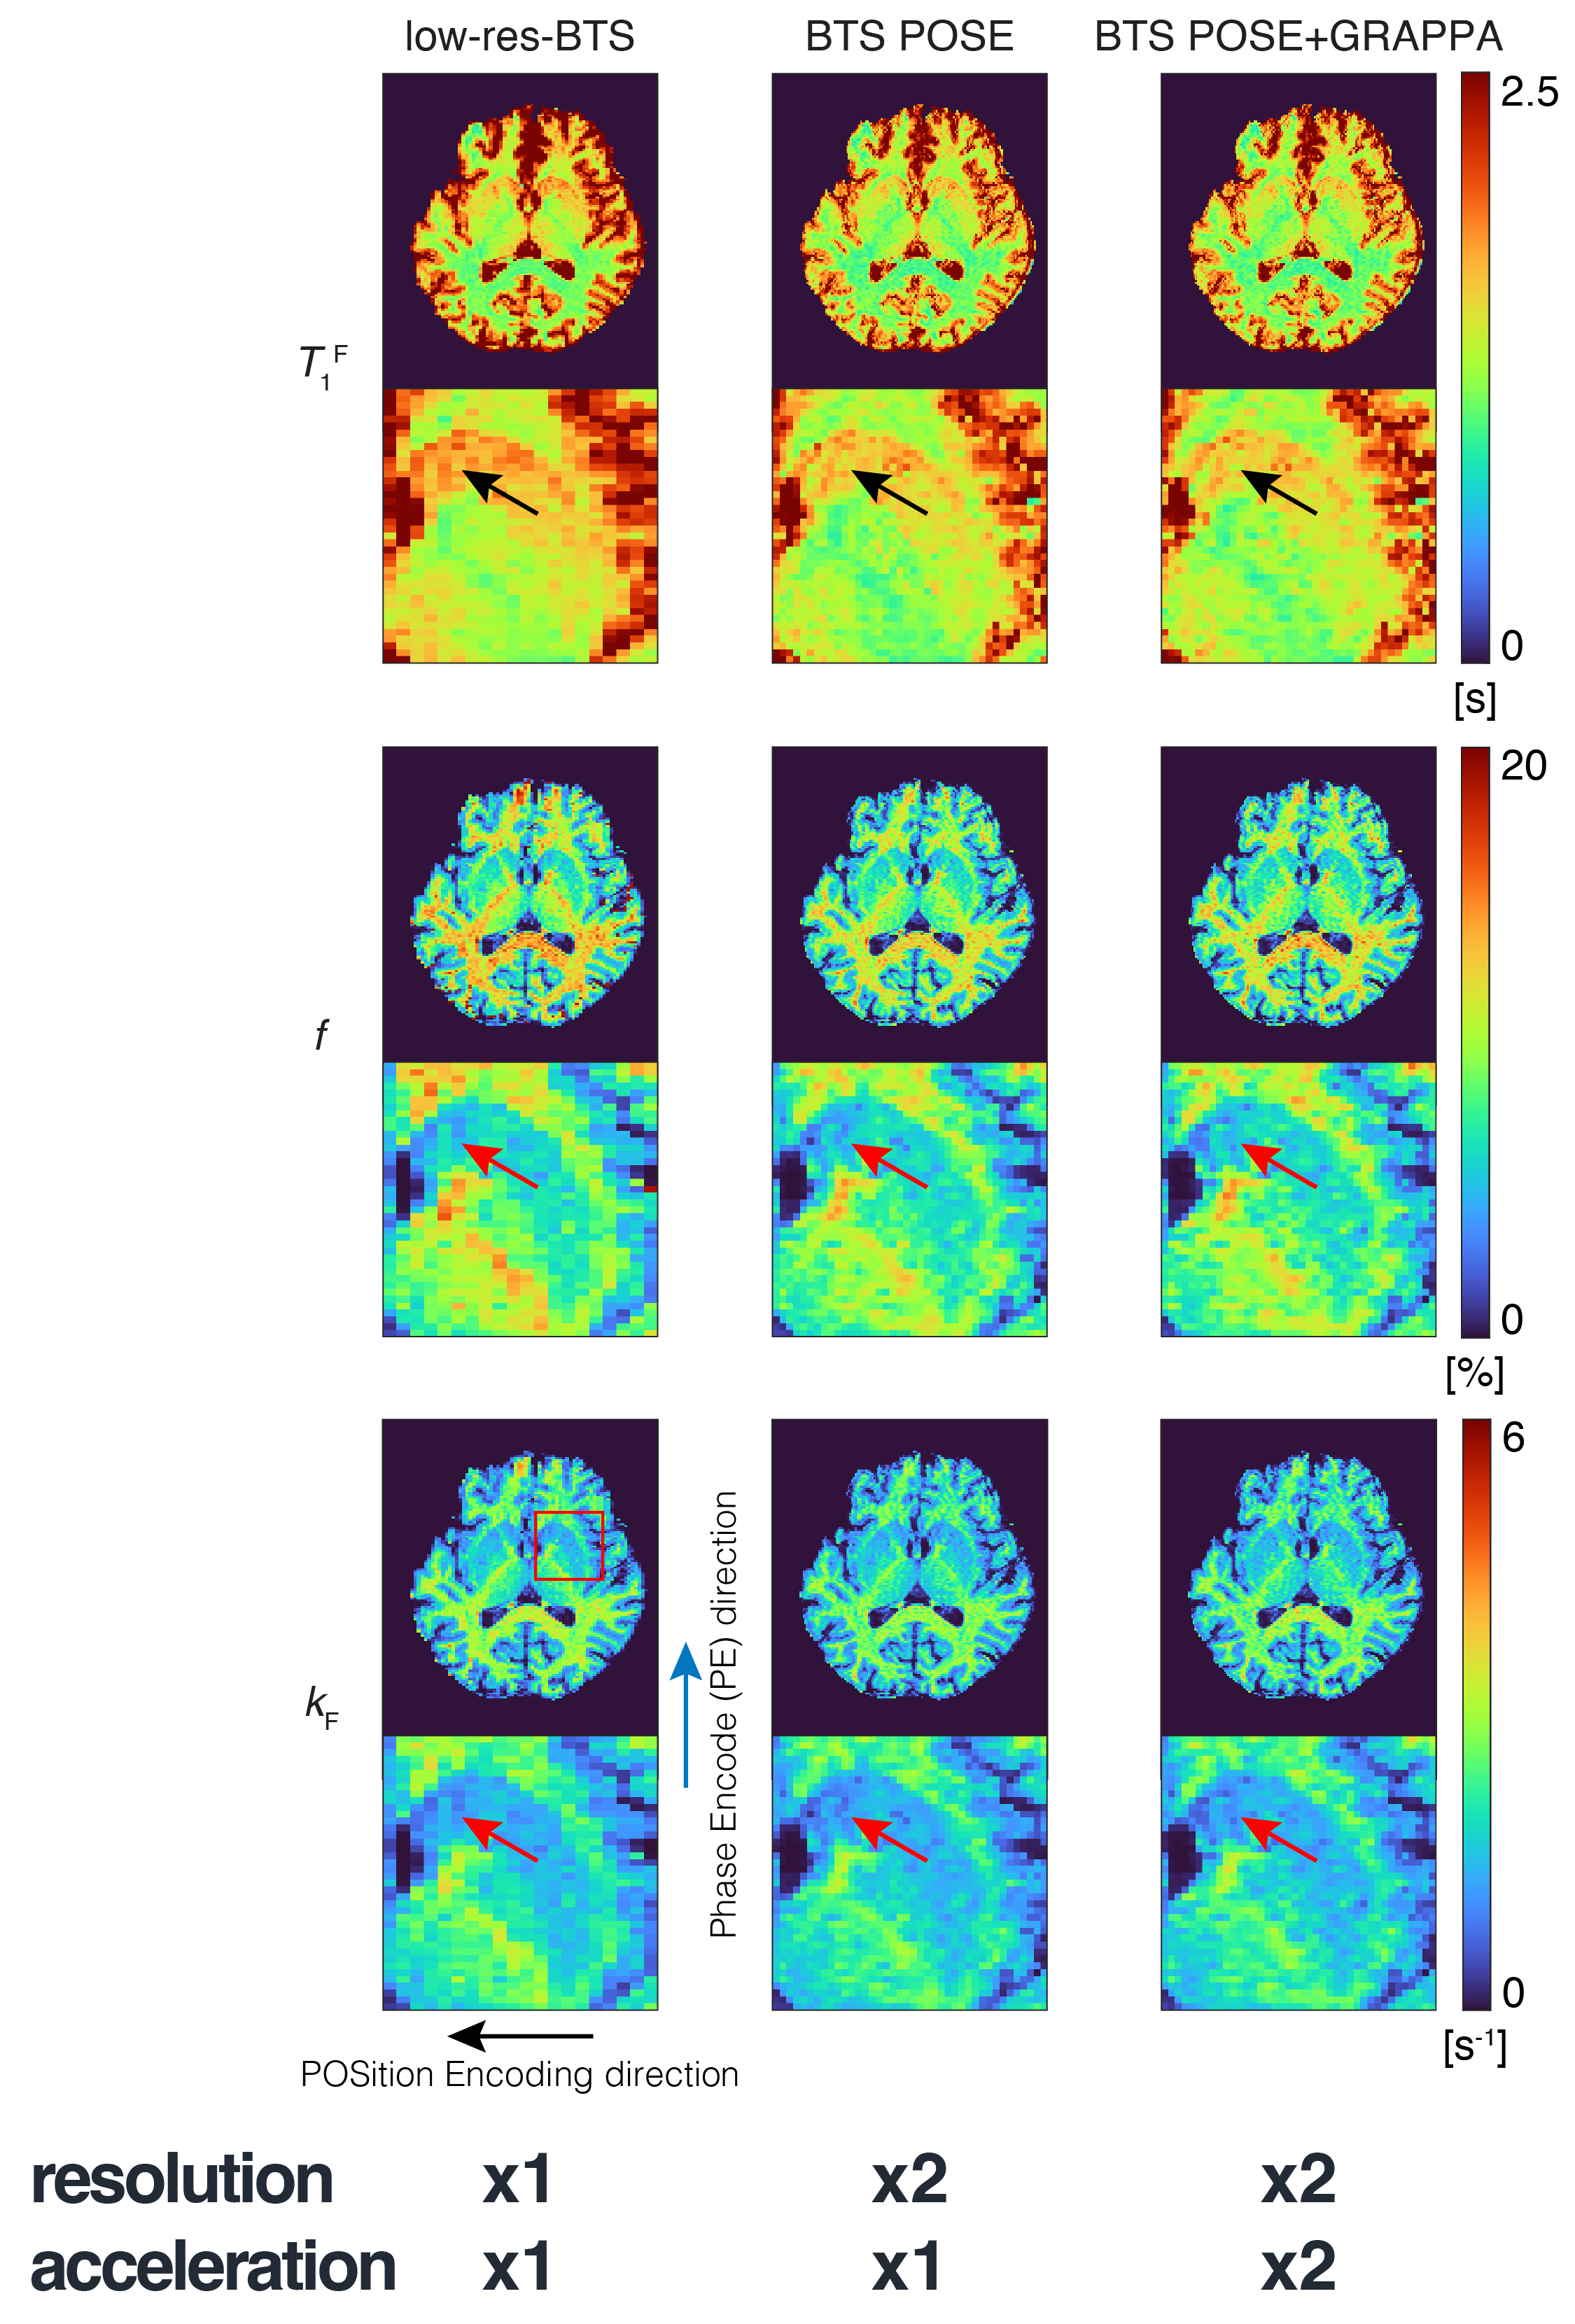
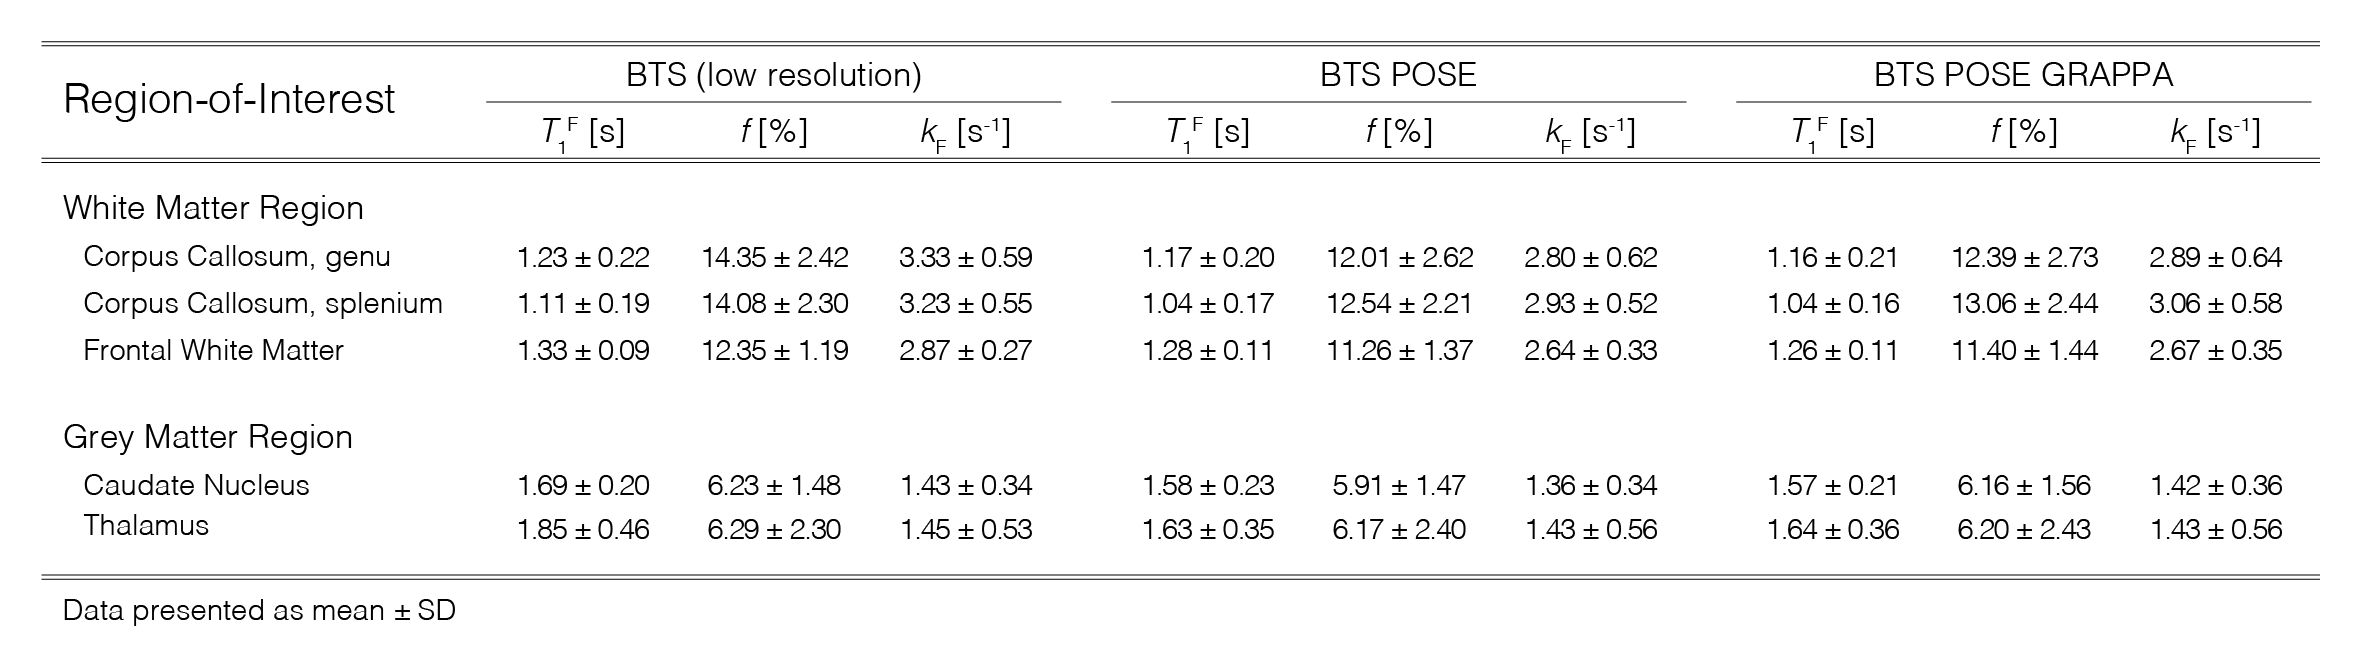
Quantitative MT parameter maps obtained from BTS POSE with 2x-resolution enhancement are presented in FIG3 (center column), along with maps obtained from combining POSE and GRAPPA (BTS POSE+GRAPPA, right column, GRAPPA first applied along phase encode direction to achieve 2x acceleration followed by POSE applied along slice direction to achieve 2x-resolution enhancement) and original BTS with low-slice-resolution (left column). As seen in the zoom-in views, both BTS POSE and BTS POSE+GRAPPA removes the blocky textures along the slice direction of the BTS MT maps, better resolving the boundary between the caudate nucleus and putamen indicated by the arrows. The overall signature of the quantitative maps generated from the three methods shows good agreement. MT parameters $$$T_1^\text{F},f$$$ and $$$k_\text{F}$$$ were measured in representative white matter and grey matter regions (FIG4). BTS POSE and BTS POSE+GRAPPA shows excellent agreement, whereas the low-resolution BTS maps show a discrepancy, likely due to partial volume effects from thicker slices.Conclusion
We have introduced a new acquisition and reconstruction approach using position encoding that quantifies MT parameters for the 3D whole brain at isotropic high-resolution. Acquisition acceleration can be further improved by combining this new position encoding scheme with established acceleration methods such as parallel imaging, resulting in double the image resolution but half the scan time.Acknowledgements
We thank the funding support from NIBIB R21EB031185, NIAMS R01AR079442, R01AR081344 and R56AR081017.
References
[1] Steinman L, Cell 1996;85:299-302
[2] Depp C, Nature 2023;618:349-357
[3] Henkelman RM, Magn Reson Med 1993;29:759-766
[4] Sled JG, Magn Reson Med 2001;46:923-931
[5] Yarnykh VL Magn Reson Med 2002;47:929-939
[6] Jang A, Magn Reson Med 2023;90:1859-1873
[7] Sacolick LI, Magn Reson Med 2010;63:1315-1322
[8] Gudbjartsson H, Magn Reson Med 1995;34(6):910-914
[9] Carmi E, Magn Reson Imaging 2006;24(2):133-154
[10] Morrison C, Magn Reson Med 1995;33:475-482
Figures