1101
Fat-suppressed Ultrashort Echo Time Quantitative Magnetization Transfer (UTE-qMT) MRI via Single-point Dixon Method1Department of Radiology, University of California, San Diego, La Jolla, CA, United States, 2Department of Bioengineering, University of California, San Diego, La Jolla, CA, United States, 3Radiology Service, VA San Diego Healthcare System, La Jolla, CA, United States
Synopsis
Keywords: Fat & Fat/Water Separation, Fat
Motivation: UTE-qMT imaging has shown potential in probing the molecular composition and microenvironment of short-T2 tissues. Yet fat signals and chemical shift artifacts interfere with morphological contrast and UTE-qMT measurements.
Goal(s): To establish a fat suppression method for accurate UTE-qMT imaging.
Approach: We adopted the UTE-single point Dixon (UTE-spDixon) method for suppressing fat signals in a series of MT-weighted UTE images of short-T2 tissues.
Results: UTE-spDixon successfully separates fat from water without short-T2 signal attenuation and compromising qMT measurement.
Impact: The fat/water-separated UTE-qMT method shown in this study will improve the accuracy of quantifying molecular compositions of short-T2 tissues. This fat/water separation method also has the potential to apply to other UTE-based quantitative MR techniques.
Introduction
Ultrashort echo time quantitative magnetization transfer (UTE-qMT) imaging enables probing molecular compositions and microenvironments of short-T2 tissues, which are not achievable by conventional MR sequences1. However, fat is a major confounding factor in UTE imaging: it has a shorter T1 and higher proton density than most short-T2 tissues, leading to high fat signal and low short-T2 contrast in T1-weighted UTE imaging. Fat also produces strong chemical shift artifacts, which manifest as spatial blurring and ringing artifacts in non-Cartesian UTE imaging, leading to inaccurate UTE-qMT mapping2. Regular fat saturation not only reduces fat signals but also saturates short-T2 signals directly due to their broad spectra or indirectly due to the MT effect3. Previously, the single-point Dixon method combined with dual-echo UTE imaging (UTE-spDixon) was demonstrated to separate fat from water and enhance the morphological contrast in short-T2 tissues4. In this study, we examined whether spDixon can be applied to UTE-MT images and how it affects qMT measurements using ex vivo samples.Methods
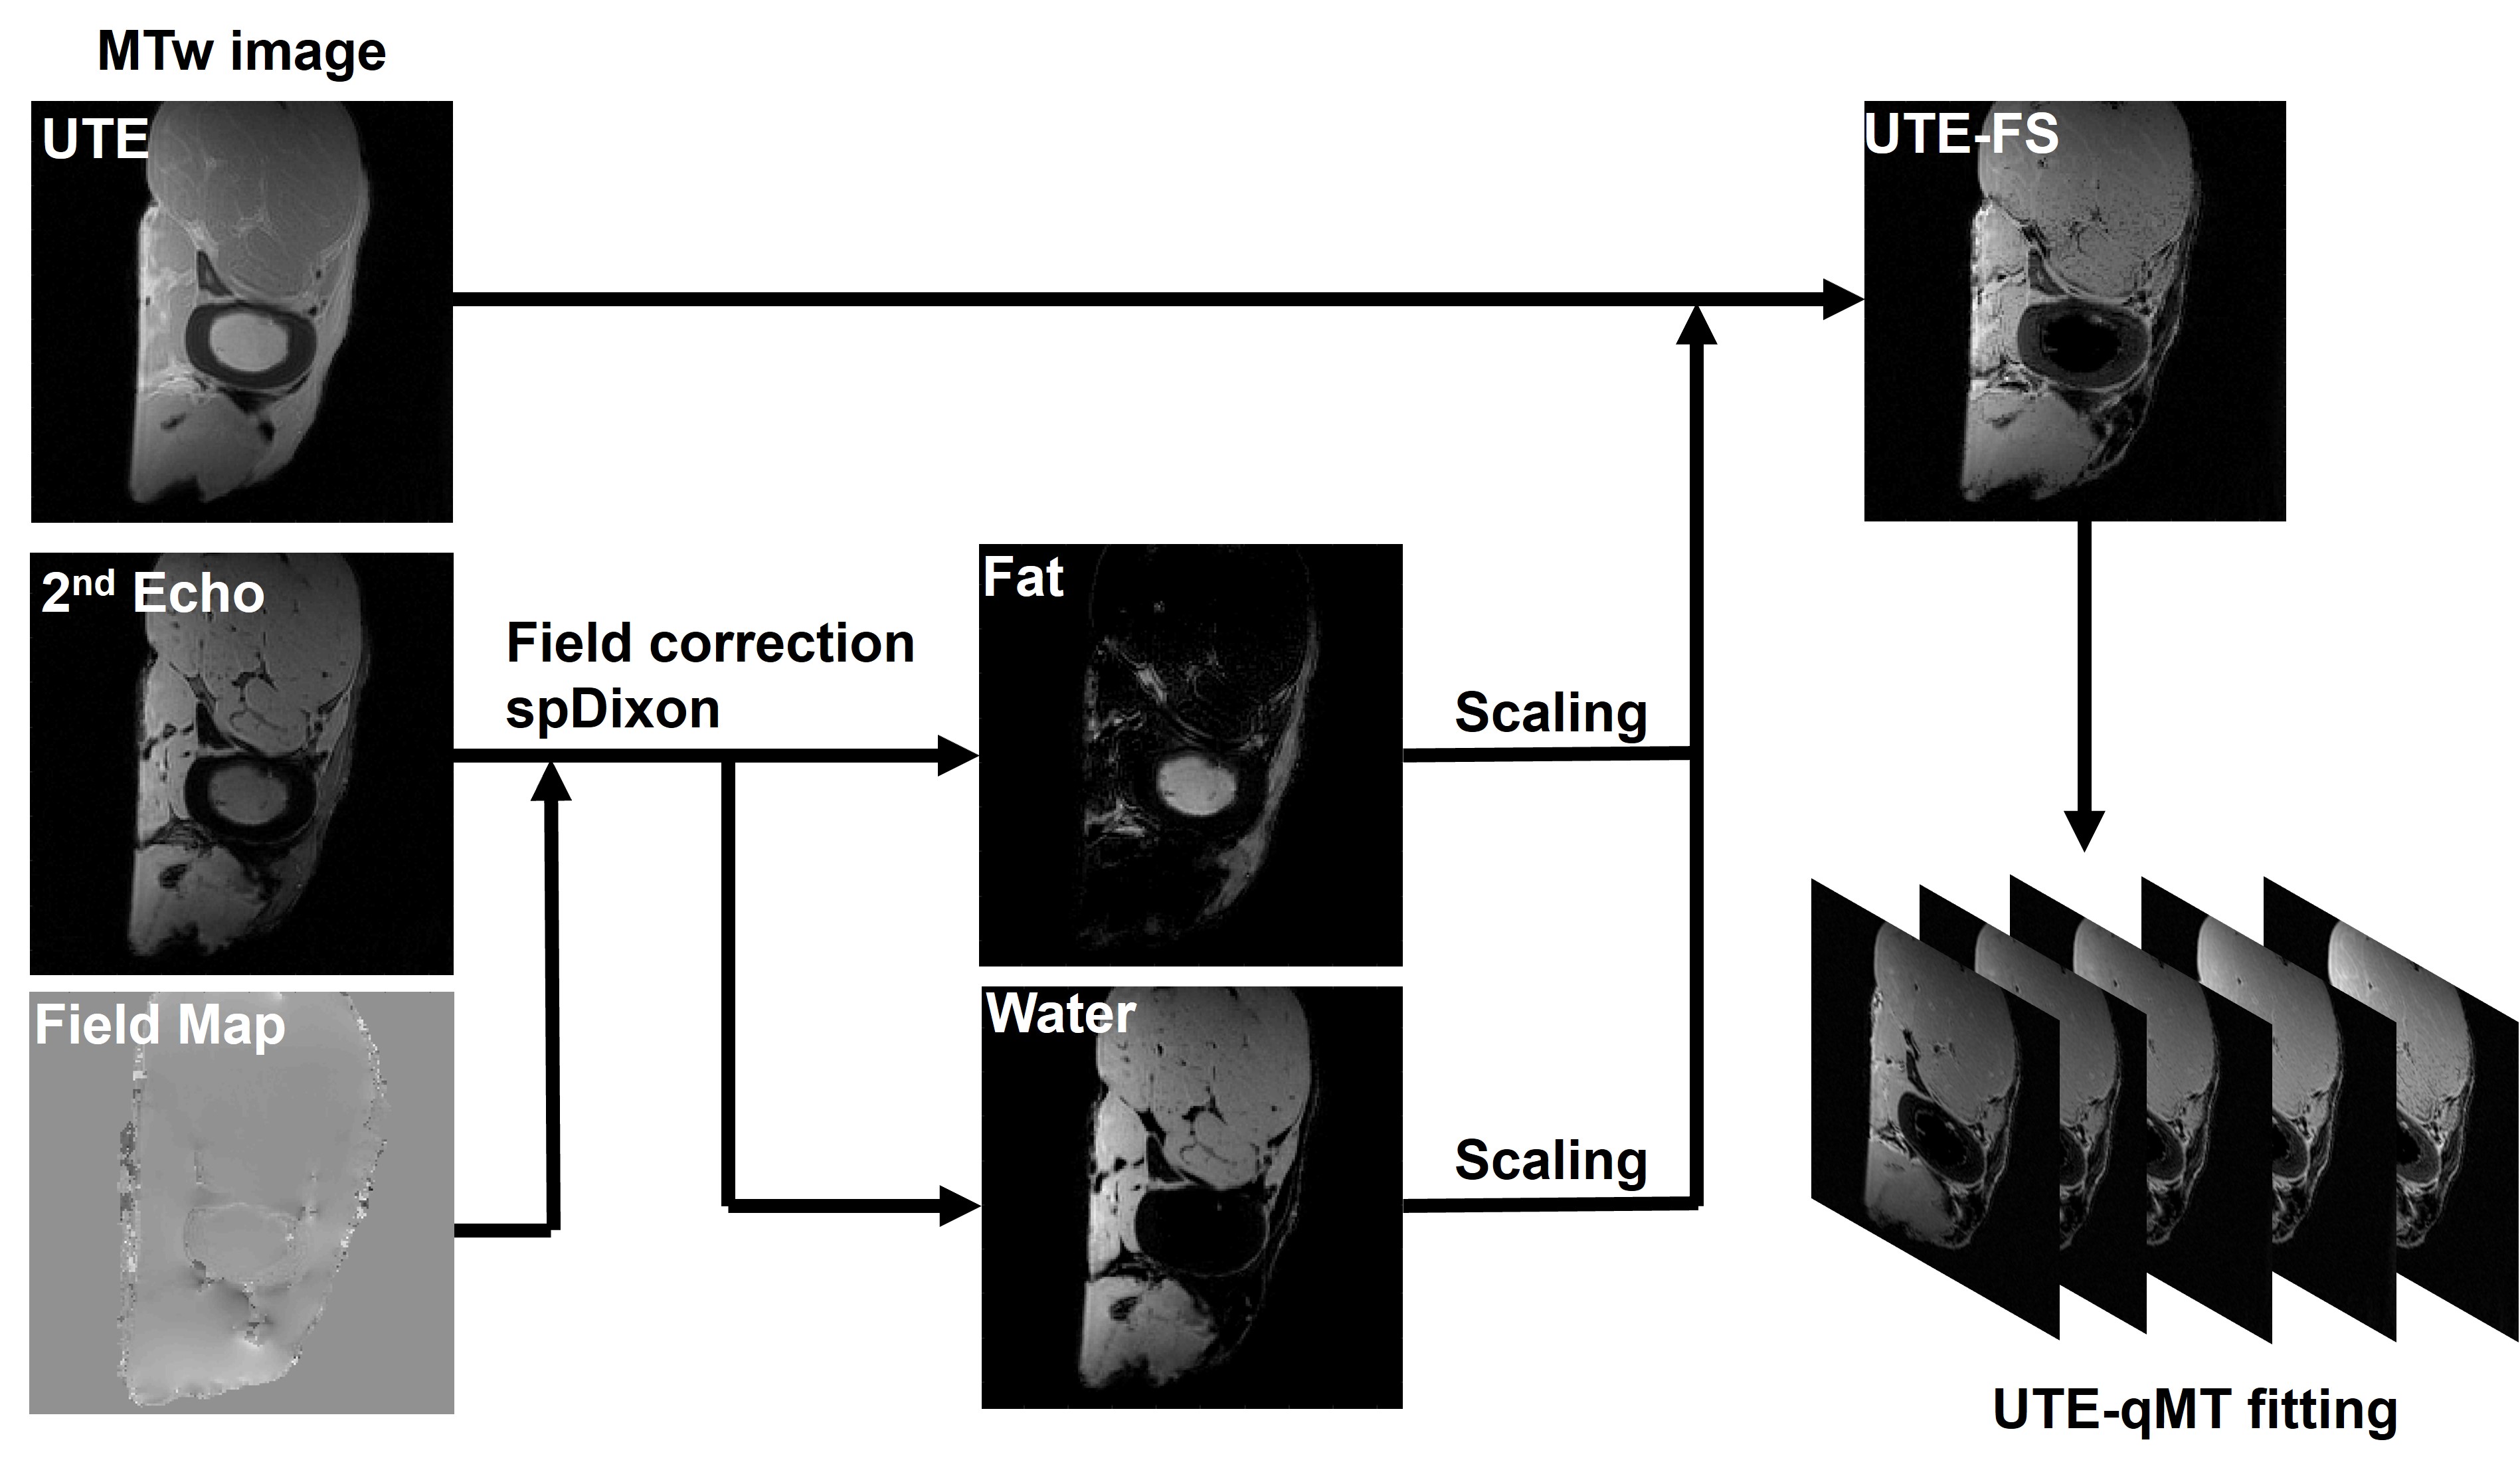
Fresh bovine bone (with muscle and marrow fat) and human patellar cartilage samples were scanned at 3T (MR750, GE Healthcare) with an 8-channel knee coil. Bovine bone and muscle were scanned with a 3D UTE-cone sequence (TR/TEs=90.5/0.032,2.8ms, flip angle=7˚, slice thickness=5mm, matrix=192×192, FOV=16×16cm, BW=125kHz) with MT preparation (Sat power=500˚, 1500˚, Offset frequencies=2, 5, 10, 20, 50kHz). A separate dual-echo UTE-cone image was also acquired for the field map (TR/TE=10/0.032,2.2ms, FA=5˚). Human patellar cartilage was scanned with similar parameters. The overall procedure of UTE-spDixon is shown in Figure 1. In brief, the second echo of each MT-weighted image is decomposed to water and fat by the single-point Dixon method with field inhomogeneity correction5. The resulting fat image is globally scaled via linear least square fitting between UTE, water, and fat images, and the scaled fat image is subtracted from the UTE image for fat suppression4. Both the raw UTE-MT images and fat-water separated UTE-MT images were processed for qMT fitting with regions of interest (ROIs) drawn in cortical bone, muscle, and cartilage6.Results
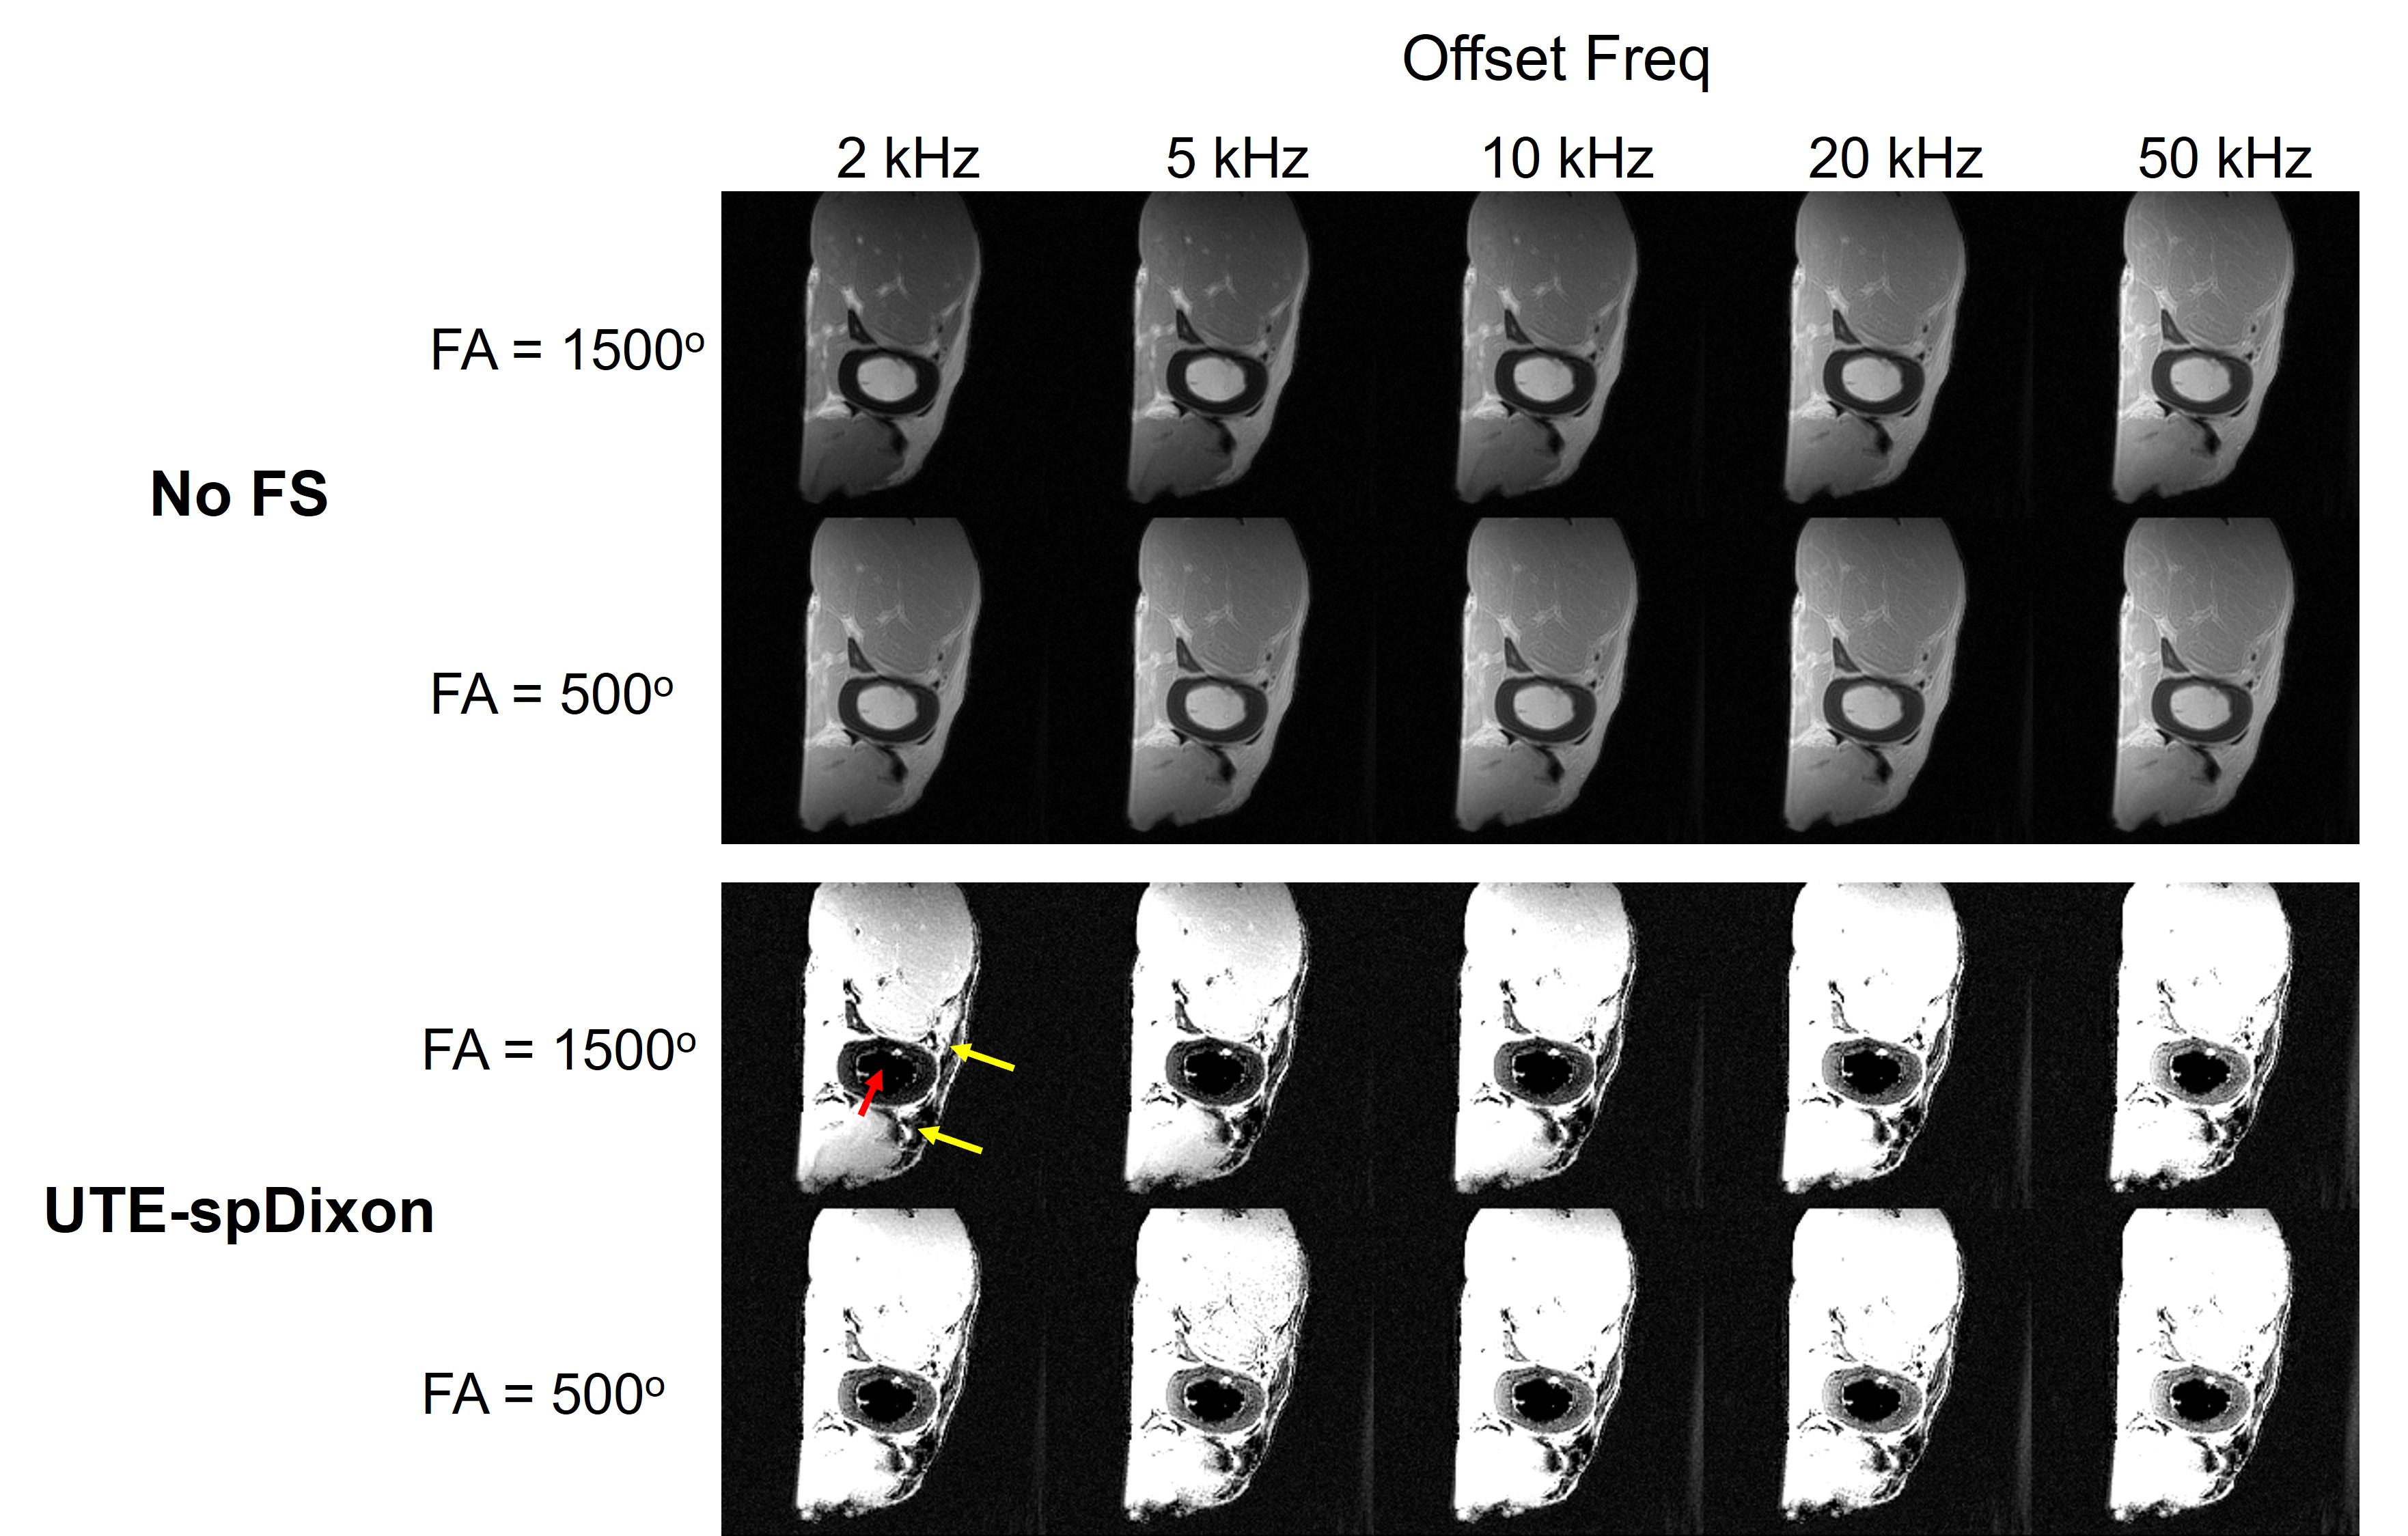
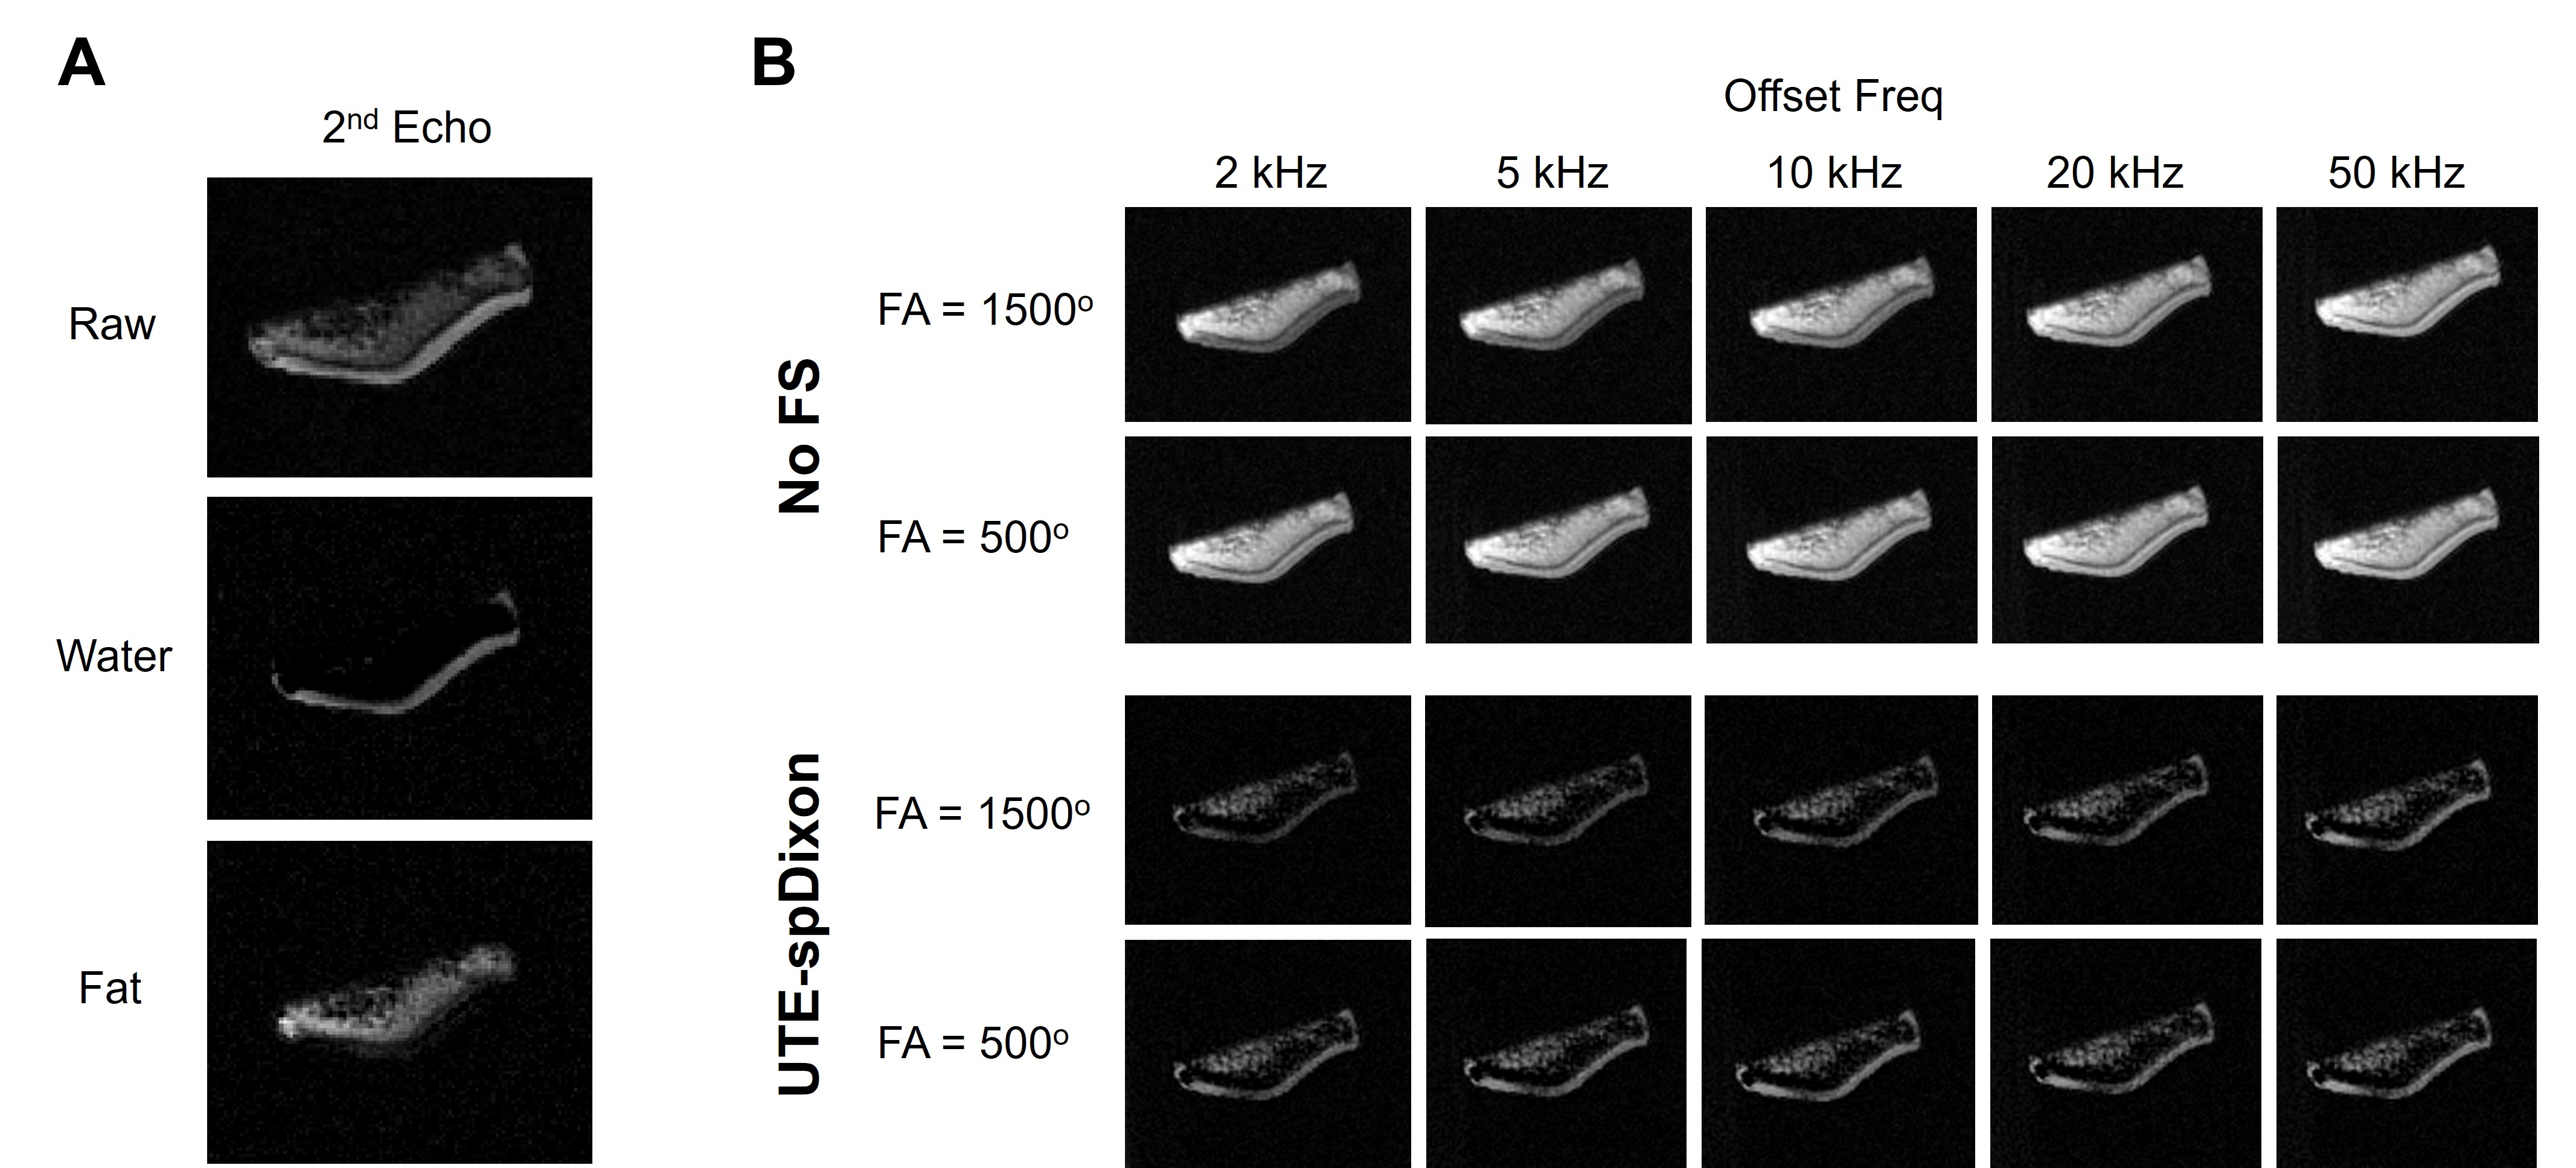
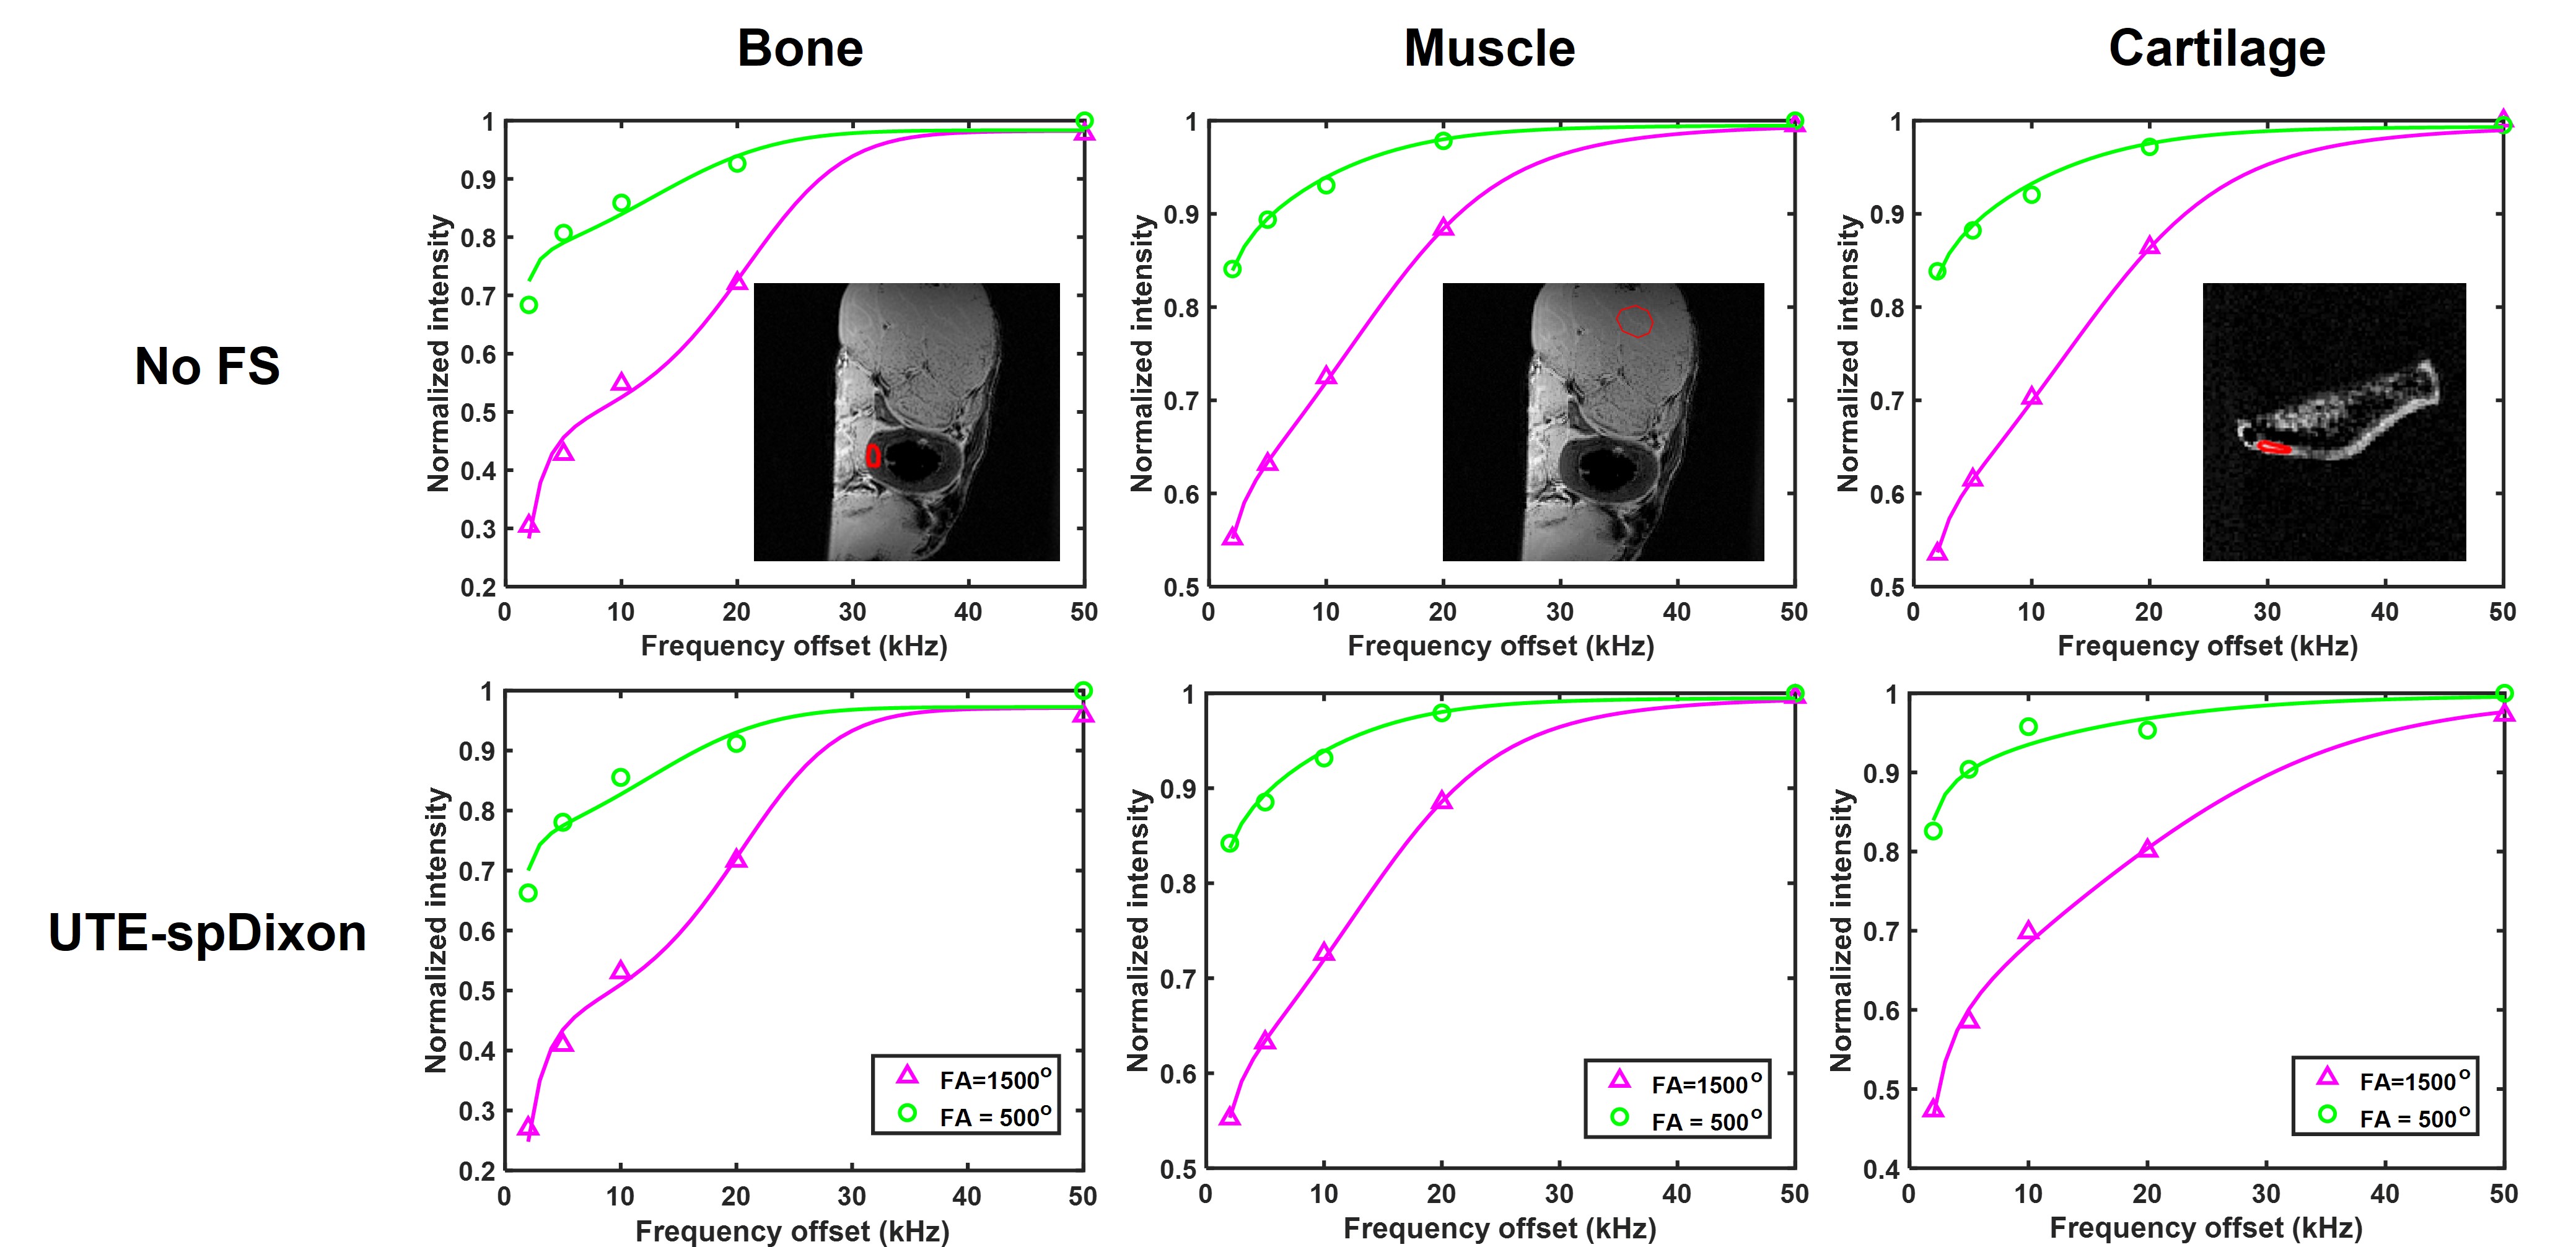
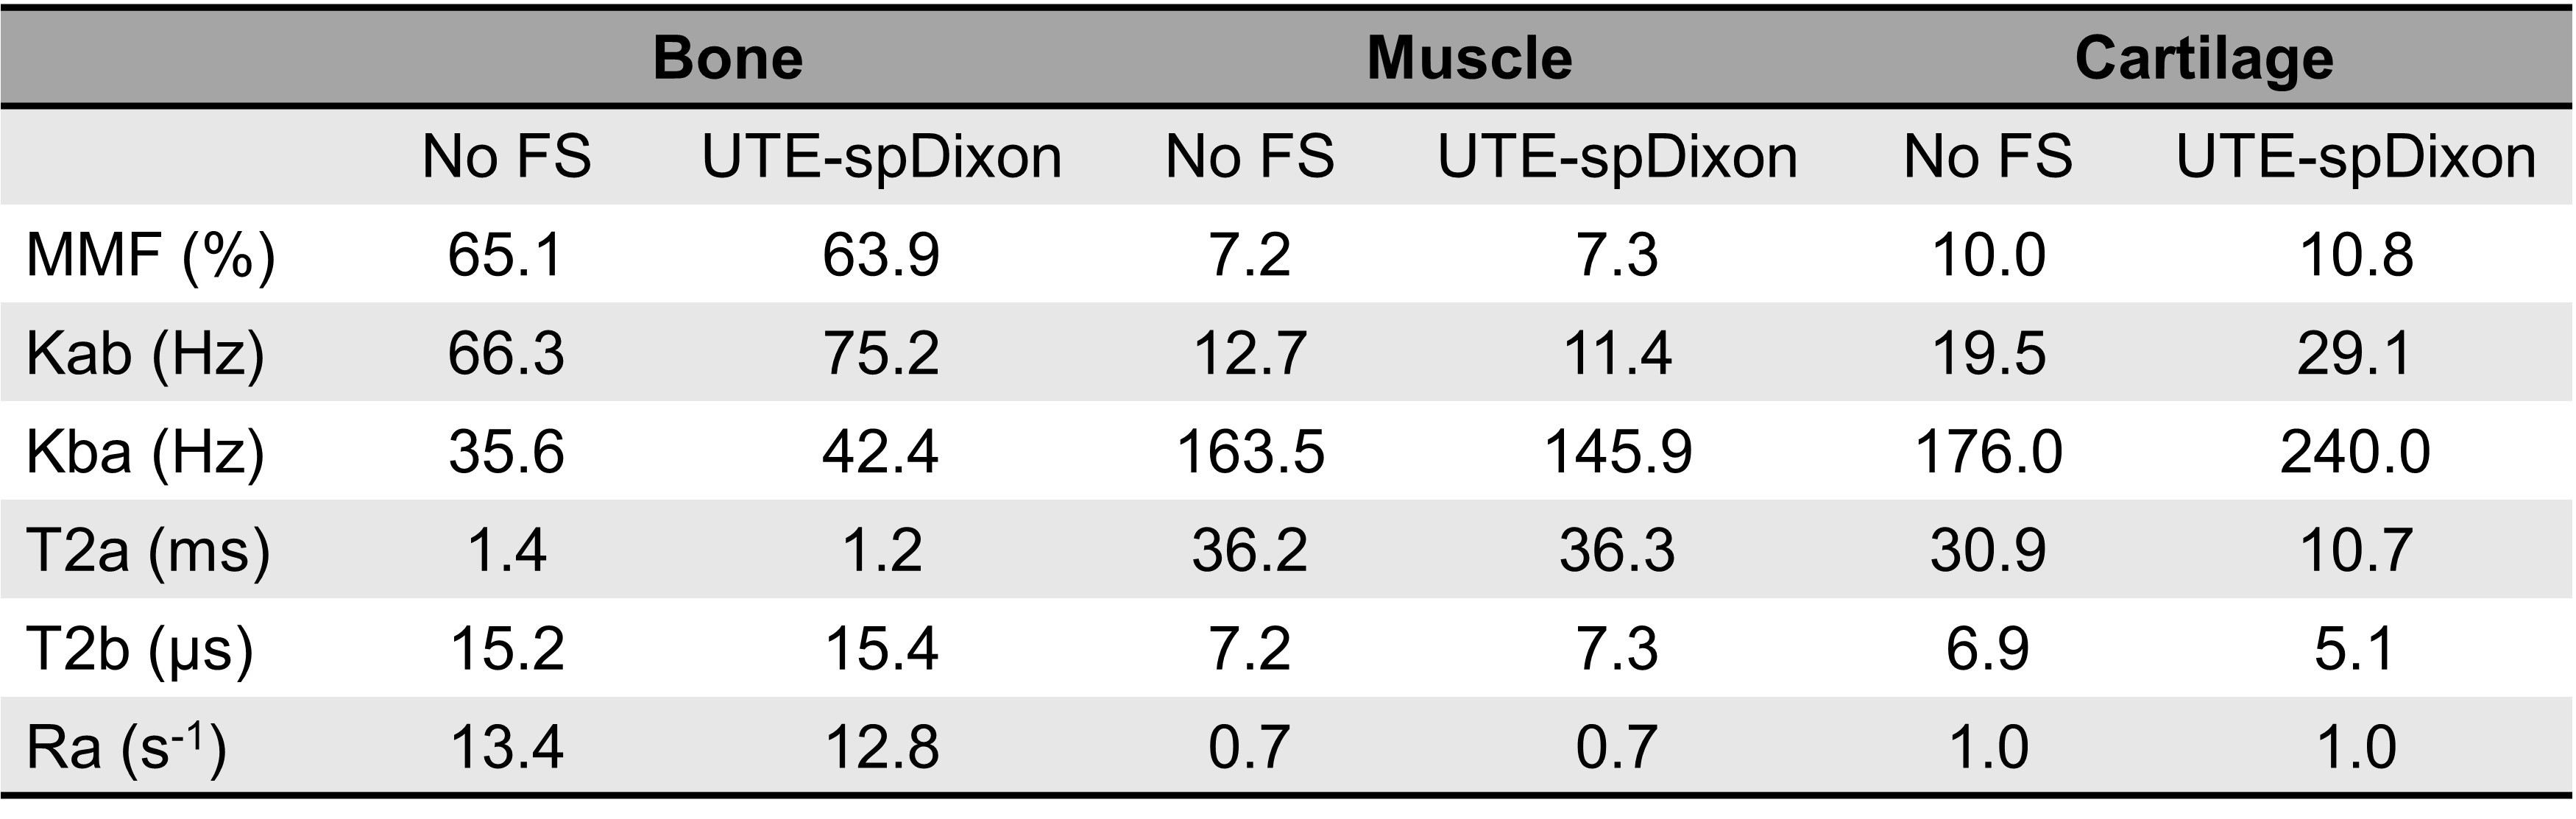
The UTE-spDixon method effectively separated fat from water, generating high signal and contrast for bovine bone, muscle (Figure 2), and patellar cartilage (Figure 3A, B) from all MT-weighted UTE images. UTE-qMT with single-point Dixon processing showed similar qMT fitting curves (Figure 4) and qMT parameters (Table 1) as regular UTE-qMT. Furthermore, qMT parameters align with the previously reported values7-9.Discussion
We demonstrated the feasibility of applying UTE-spDixon fat/water separation to UTE-qMT analysis. The UTE-spDixon approach effectively separated fat from water in short- and long-T2 tissues. The fat/water separation via UTE-spDixon significantly increased short-T2 signal and contrast without affecting the qMT results. The UTE-sqDixon technique could be very helpful for in vivo UTE-qMT where the image spatial resolution is much lower, and the high fat signal and chemical shift artifacts might significantly affect qMT parameters. For a thorough assessment of spDixon-based UTE-qMT, phantoms and tissues that incorporate both fat and macromolecular pool (e.g., collagen, proteoglycan) should be tested in the future to investigate whether macromolecular content can be accurately quantified. On top of qMT, the UTE-spDixon method is also expected to improve the accuracy of other UTE-based MR parameter measurements (e.g., UTE-T1, UTE-T1ρ, UTE-T2, UTE-T2*), especially for short-T2 tissues by effectively removing fat interference without short-T2 signal attenuation.Conclusion
The UTE-spDixon method can be applied to UTE-qMT images to separate fat from water without compromising short-T2 image quality and accuracy of qMT measurement.Acknowledgements
The authors acknowledge grant support from National Institutes of Health (R01AR062581, R01AR068987, R01AR075825, K01AR080257 and R01AR079484, and RF1AG075717), VA Research and Development Services (Merit Awards I01CX001388, I01CX002211, and I01BX005952), DFG (SE 3272/1-1) and GE Healthcare.References
1. Ma Y, Shao H, Du J et al., Ultrashort echo time magnetization transfer (UTE-MT) imaging and modeling: magic angle independent biomarkers of tissue properties. NMR Biomed. 2016;29:1546-1552.
2. Bydder M, Carl M, Bydder GM, Du J. MRI Chemical Shift Artifact Produced by Center-Out Radial Sampling of k-Space: A Potential Pitfall in Clinical Diagnosis. Quant Imaging Med Surg 2021; 11:3677-3683.
3. Carl M, Nazaran A, Bydder GM, Du J. Effects of fat saturation on short T2 quantification. Magn Reson Imaging 2017; 43:6-9.
4. Jang H, Carl M, Ma Y et al., Fat suppression for ultrashort echo time imaging using a single-point Dixon method. NMR Biomed. 2019;32:e4069.
5. Ma J, A single-point Dixon technique for fat-suppressed fast 3D gradient-echo imaging with a flexible echo time. J Magn Reson Imaging. 2008;27:881-890.
6. Ma Y, Chang EY, Carl M et al., Quantitative magnetization transfer ultrashort echo time imaging using a time‐efficient 3D multispoke Cones sequence. Magn Reson Med. 2018;79:692-700.
7. Jerban S, Ma Y, Dorthe WE et al., Assessing cortical bone mechanical properties using collagen proton fraction from ultrashort echo time magnetization transfer (UTE-MT) MRI modeling. Bone Reports. 2019;11:100220.
8. Chang EY, Suprana A, Tang Q et al., Rotator cuff muscle fibrosis can be assessed using ultrashort echo time magnetization transfer MRI with fat suppression. NMR Biomed. 2023;e5058.
9. Wan L, Cheng X, Searleman AC et al., Evaluation of enzymatic proteoglycan loss and collagen degradation in human articular cartilage using ultrashort echo time-based biomarkers: A feasibility study. NMR Biomed. 2022;35:e4664.
Figures