1100
Orientation independent quantification of macromolecular proton fraction in tissues with suppression of residual dipolar coupling1Department of Imaging and Interventional Radiology, The Chinese University of Hong Kong, Hong Kong, Hong Kong, 2MR Collaboration, Siemens Healthineers Ltd., Hong Kong, Hong Kong, Hong Kong, 3Illuminatio Medical Technology Limited, Hong Kong, Hong Kong, Hong Kong, 4Department of Orthopaedics and Traumatology, The Chinese University of Hong Kong, Hong Kong, Hong Kong
Synopsis
Keywords: Magnetization Transfer, Quantitative Imaging, Macromolecular proton fraction
Motivation: The residual dipolar coupling (RDC) can lead to the orientation-dependent measurements in ordered tissues in MRI, potentially confounding their clinical applications.
Goal(s): We demonstrate the potential confounding effect from tissue orientation in quantitative magnetization transfer can be suppressed by using a new technique Macromolecular Proton Fraction Mapping based on Spin-Lock (MPFSL).
Approach: Applying MPFSL, we can adjust both the resonance frequency offset and the amplitude of spin-lock radiofrequency pulse to achieve a strong effective spin-lock field to suppress RDC, eliminating orientation-dependency of MPF measurement. Human knee specimen experiments conducted verified this finding.
Results: The MPF measured using MPFSL shows insensitivity to tissue orientations.
Impact: Spin-lock based quantitative magnetization transfer imaging can achieve orientation-independent quantification, thus having potential applications in characterization of highly-ordered tissues such as cartilage and myelin.
Introduction
Orientational anisotropy of tissues with ordered structures often confounds quantification of tissue parameters. In highly-ordered tissues like cartilage and myelin, dipole-dipole interactions between tissue structures and the static magnetic field $$$B_0$$$ result in orientation-dependency of MRI signal, leading to well-known "magic angle effect"1,2, as commonly observed in T2 maps3–5.Quantification of magnetization transfer (MT) parameters such as macromolecular proton fraction (MPF) provides valuable insights into the biochemical composition and molecular properties of biological tissues 6–8. Several works reported orientation-dependency of MT parameters 9–11. wherein quantitative MT is commonly performed based on saturation radiofrequency (RF) pulses.
Recently, a new technique called Macromolecular Proton Fraction mapping based on Spin-Lock (MPFSL) has been reported for quantitative MT based on off-resonance spin-lock RF pulses12,13. Note the spin-lock RF pulses can suppress residual dipolar coupling (RDC) when spin-lock field is sufficiently high and thus quench orientation-dependency of MRI signal14,15. For on-resonance spin-lock, the maximum spin-lock magnetic field is limited by RF power and specific absorption rate (SAR). Consequently, orientation-dependency is often observed in on-resonance T1rho imaging with spin-lock< 1000Hz16,17. In contrast, for off-resonance spin-lock, the spin-lock field is a combination of B1 field from RF pulse and resonance frequency offset which allows us to achieve a strong spin-lock field without violating the limit of SAR and RF power. Thus we can use off-resonance spin-lock techniques to achieve orientation independent quantitative MT imaging. This study investigated the orientational independence of MPFSL based on this mechanism with human knee specimen experiments.
Methods
TheoryIn highly-ordered tissue, the relaxation rate $$$R_{1\rho}$$$ at off-resonance spin-lock can be expressed as:
$$
R_{1\rho}=R_w^i+R_2^a(\theta)+R_{mt}(\Delta\omega,\omega_1) \tag{1}
$$
where $$$R_w^i $$$ and $$$R_2^a(\theta)$$$ are the relaxation rates of the water pool, corresponding to isotropic and anisotropic water molecular relaxation, respectively; $$$R_{mt}$$$ is the relaxation rate due to MT effect 18; $$$\Delta\omega$$$ is frequency offset (FO) and $$$\omega_1$$$ is frequency of spin-lock (FSL); $$$\theta$$$ is the orientation of ordered tissue with respect to $$$B_0$$$. Note the chemical exchange influence can be ignored in Eq. (1) using MPFSL13.
The anisotropic water molecular relaxation rate $$$R_w^a(\theta)$$$ is given by:
$$
R_w^a(\theta) = \frac{R_2^a(\theta)}{1+4\omega_{eff}^2\tau_b^2} \tag{2}
$$
Where $$$\omega_{eff}$$$ is effective spin-lock RF strength19, which equal to$$$\sqrt{\Delta\omega^2+\omega_1^2}$$$ , and $$$R_2^a(\theta)$$$ is $$$R_2^a(3cos^2\theta-1)^2/4$$$ , $$$R_2^a$$$ is the maximum of $$$R_2^a(\theta)$$$ 20.
In MPFSL, relaxation rates in two off-resonance spin-lock fields with different spin-lock amplitude but along the same direction are obtained13 to remove water pool signal, resulting in a relaxation rate termed $$$R_{mpfsl}$$$, which is specific to the MT pool for efficient MPF maps. Combine this condition with Eq. (1) and (2), we have:
$$
R_{mpfsl}=R_{1\rho}^{(2)}-R_{1\rho}^{(1)}=\Delta(\frac{R_2^a(\theta)}{1+4\omega_{eff}^2\tau_b^2})+\Delta R_{mt} \tag{3}
$$
The element $$$\Delta(\frac{R_2^a(\theta)}{1+4\omega_{eff}^2\tau_b^2})$$$ can be minimized using a stronger $$$\omega_{eff}$$$,resulting in a very low sensitivity of $$$R_{mpfsl}$$$ with respect to orientations.
Human knee specimen preparation
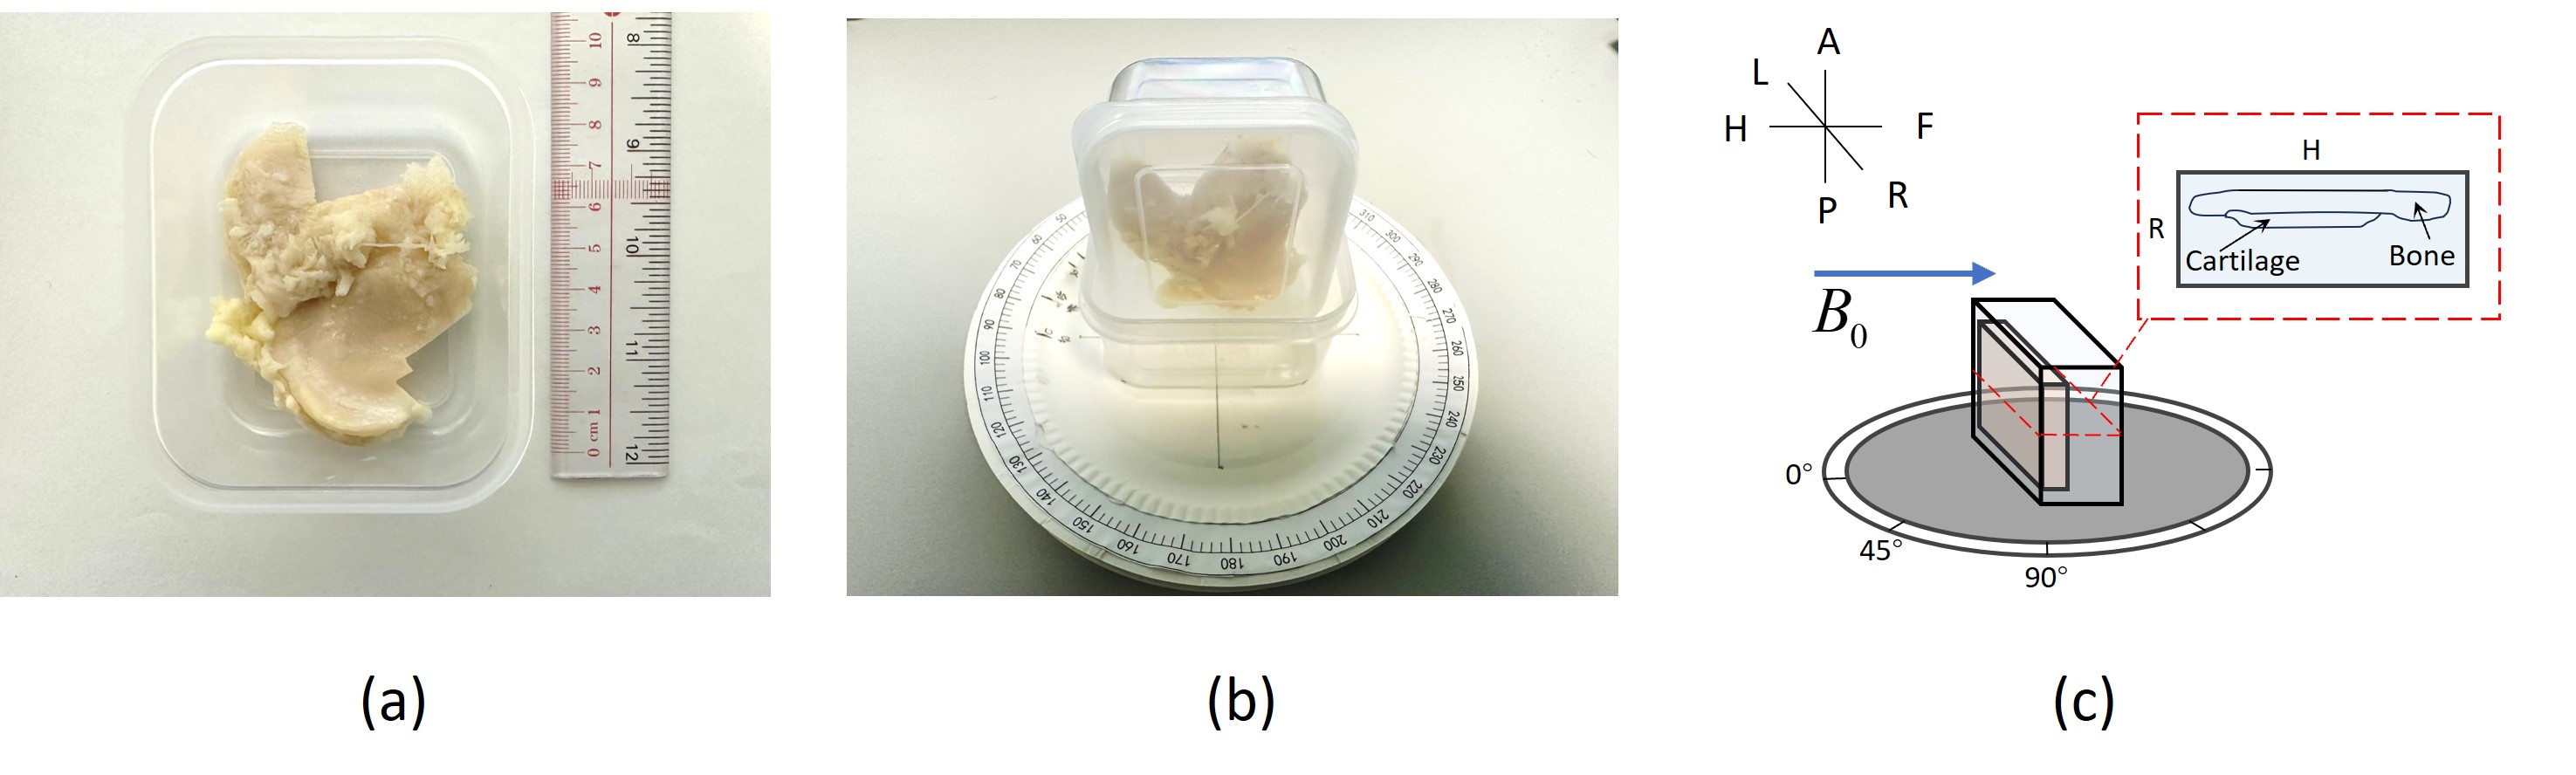
A human knee specimen from a total knee replacement surgery. All experiments were conducted under the approval from the Institutional Review Board. To ensure stability and proper positioning during imaging, the specimen was affixed to a sealed plastic square container using ethyl-2-cyanoacrylate adhesive (Henkel Ltd, Germany). The container, accommodating the specimen, was filled with phosphate-buffered saline (PBS) at room temperature. The container was attached to a hand-made device which allows precise orientational control in scanner. Figure 1 illustrates the experiment setup.
MR data acquisition and analysis
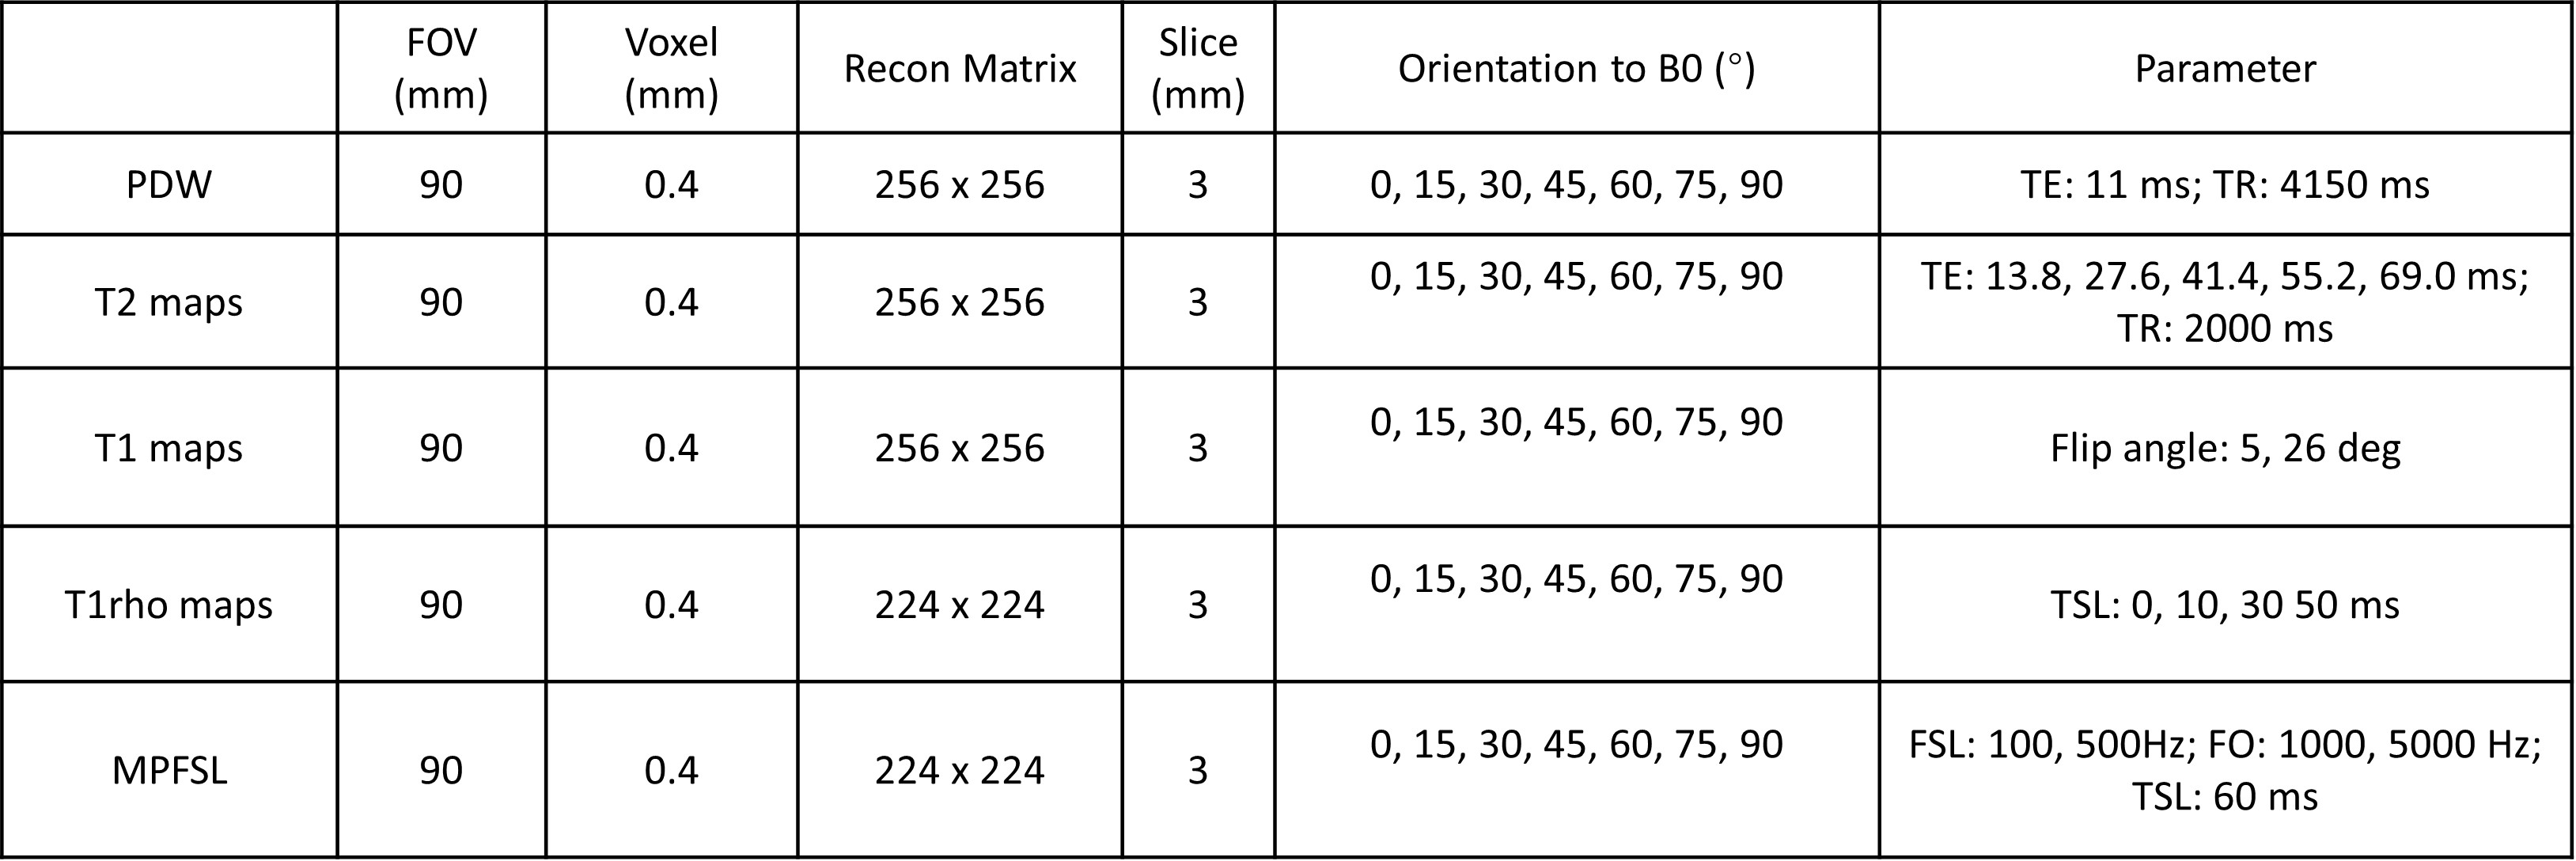
All specimen studies were performed using a 3T MRI Scanner (Prisma, Siemens Healthcare, Germany) with a Tx/Rx Knee Coil. The parameters of MPFSL protocol include FSL1/FSL2=100/500Hz, FO1/FO2=1000/5000Hz and time of spin-lock (TSL)=60ms. Additionally, PD-weighted (PDW), T2 maps, T1 maps, and on-resonance T1rho mapping (FSL=500Hz) were also acquired. The images were acquired at orientations 0°, 15°, 30°, 45°, 60°, 75°, and 90° with respect to $$$B_0$$$, respectively. Further details of MRI imaging protocol are shown in Table 1. The data analysis was performed using MATLAB (MathWorks,USA).
Results
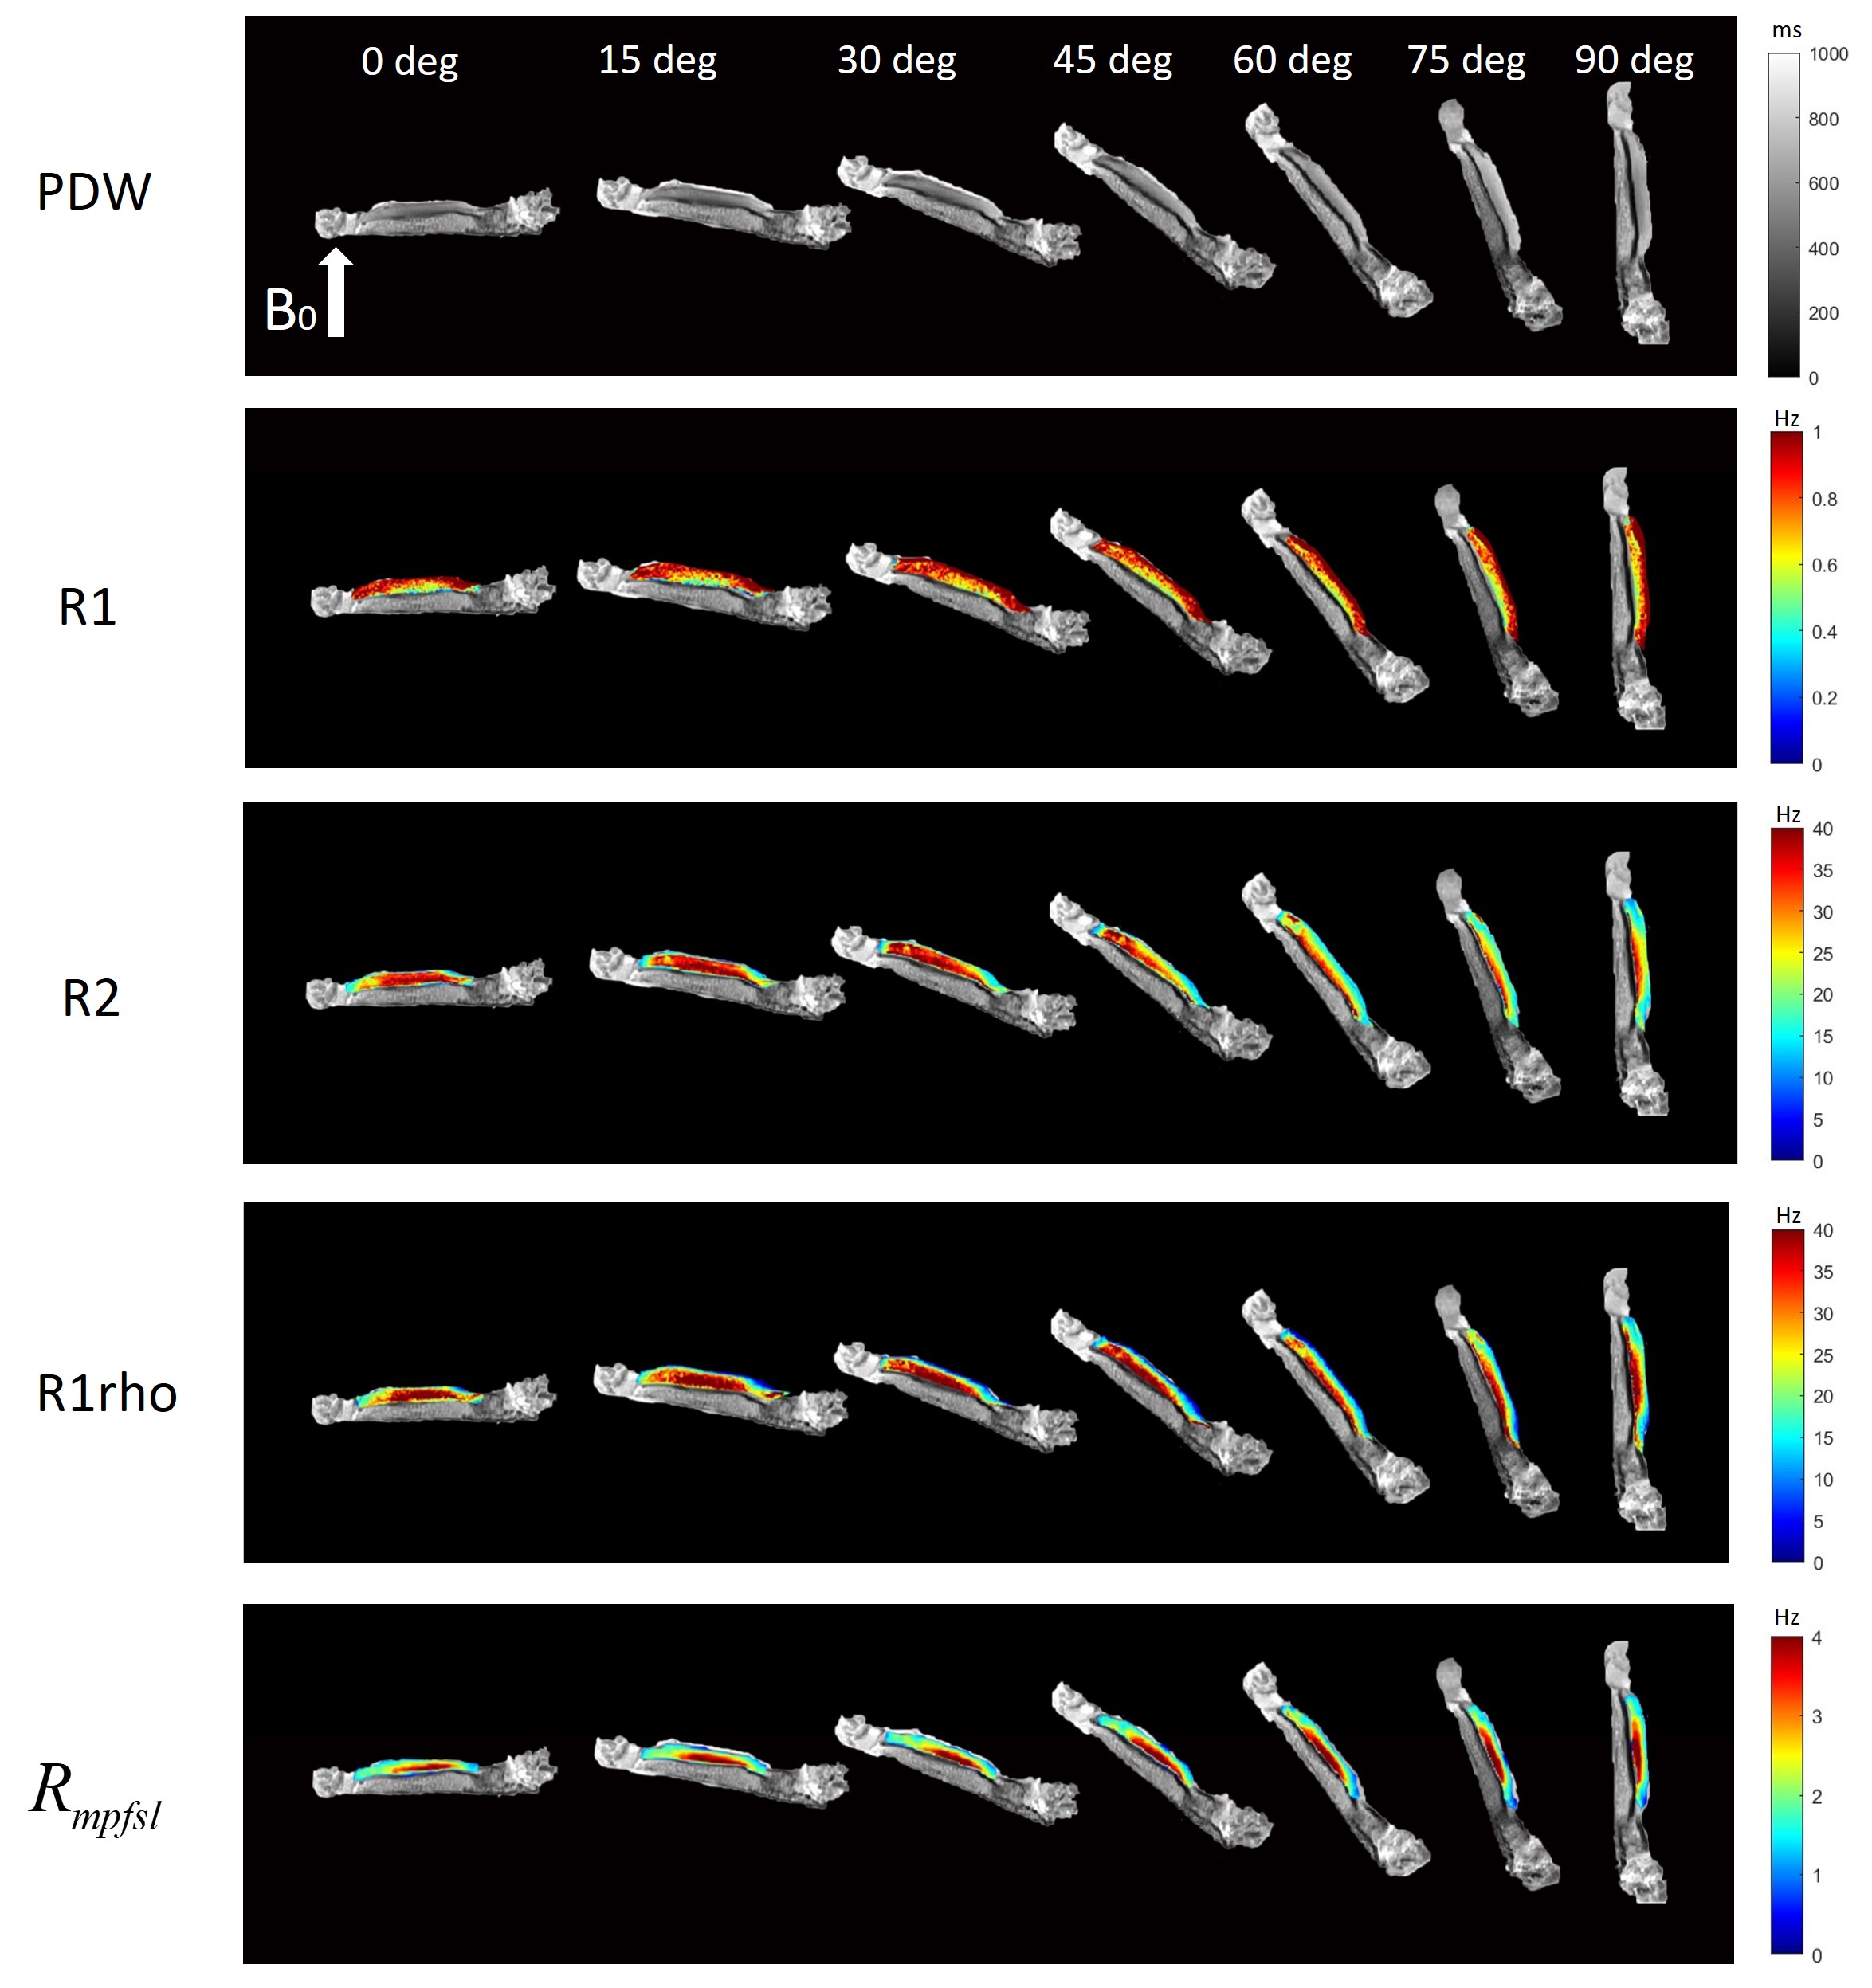
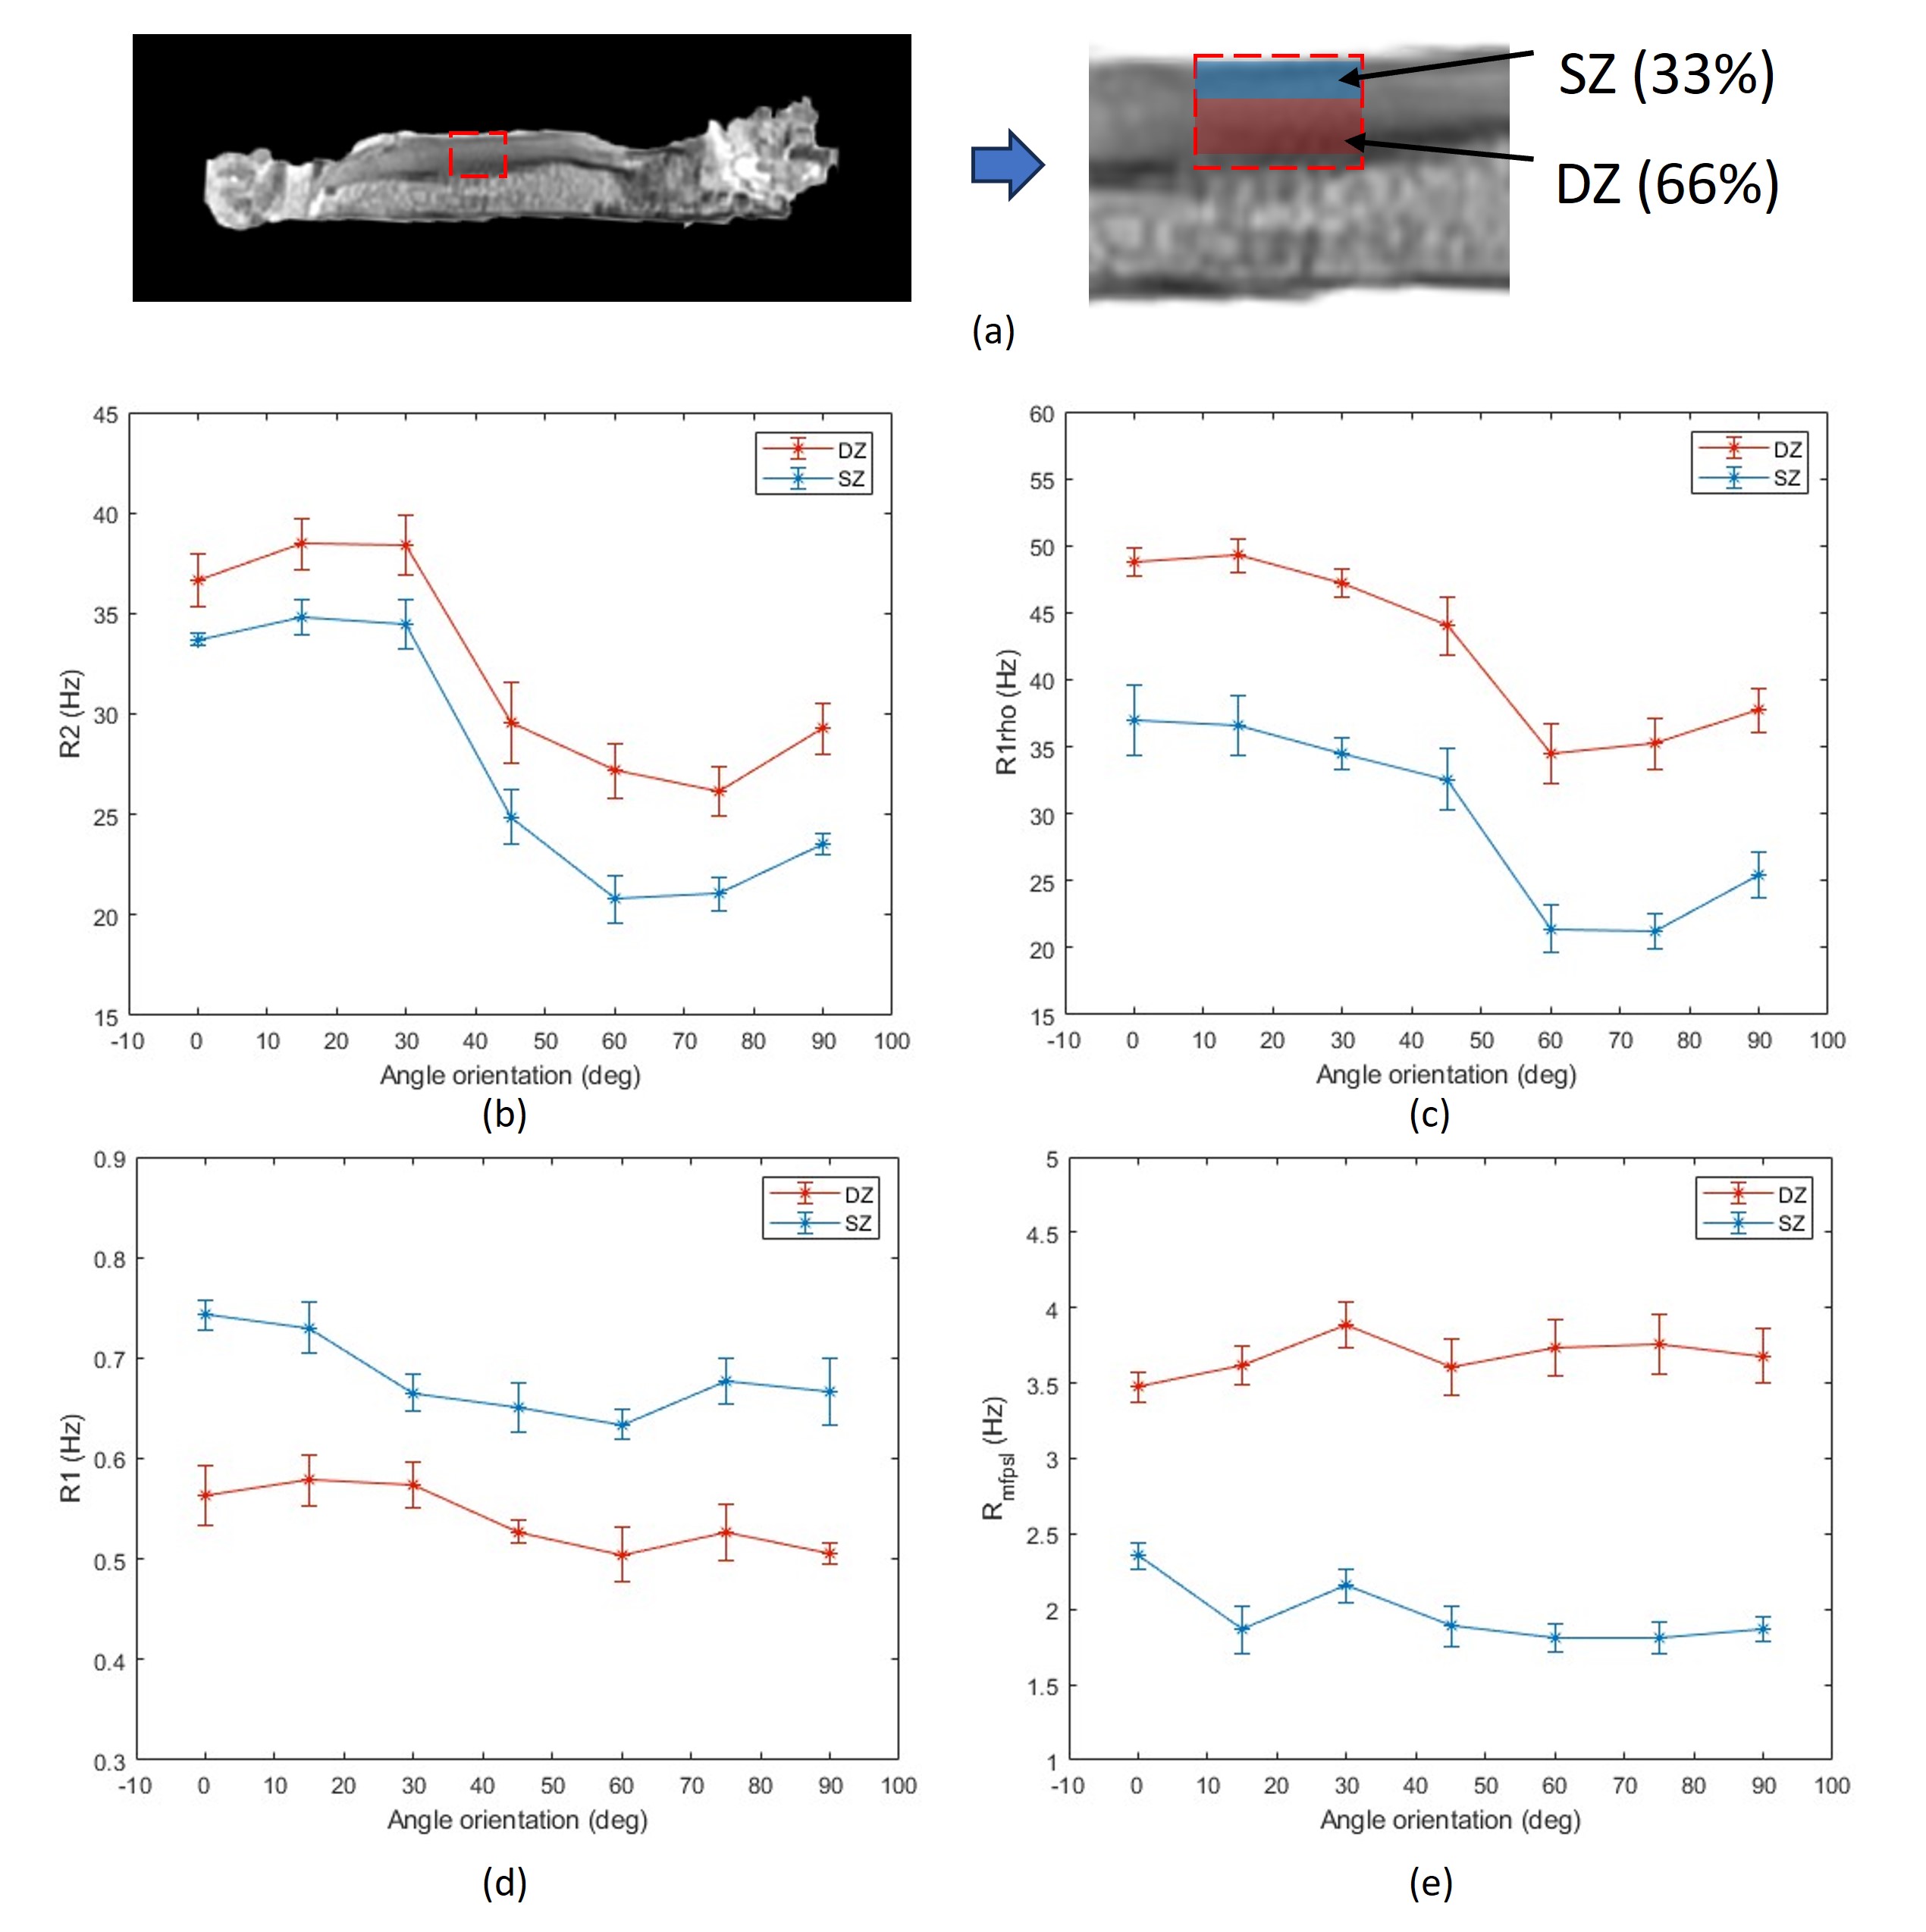
Figure 2 displays PDW images and the maps of R1, R2, R1rho and $$$R_{mpfsl}$$$ at different orientations. Note R2 and R1rho vary with orientation. Conversely, $$$R_{mpfsl}$$$, like R1, is independence of orientation.Figure 3 shows plots of the relaxation rates with varying orientations. Two ROIs was chosen in the superficial zone (SZ) and deep zone (DZ), respectively. R2 and R1rho show significant variations at different orientations. $$$R_{mpfsl}$$$ and R1 display minimal sensitivity to orientations.
Discussion and Conclusion
We demonstrated that quantitative MT based on spin-lock approach can suppress RDC and eliminate confounding effect from tissue orientation when measuring MPF. This can be achieved with a typical protocol used in MPFSL without violating the limit of RF power or SAR. The orientation independent MPF mapping is desirable for ordered tissue's characterization.Acknowledgements
This study was supported by a grant from the Research Grants Council of the Hong Kong SAR (Project GRF 14201721), and a grant from the Innovation and Technology Commission of the Hong Kong SAR (Project No.MRP/046/20x).References
1. Erickson SJ, Prost RW, Timins ME. The “magic angle” effect: background physics and clinical relevance. Radiology. 1993;188(1):23-25. doi:10.1148/radiology.188.1.7685531
2. Xia Y. Magic-angle effect in magnetic resonance imaging of articular cartilage: a review. Invest Radiol. 2000;35(10):602-621. doi:10.1097/00004424-200010000-00007
3. Mosher TJ, Smith H, Dardzinski BJ, Schmithorst VJ, Smith MB. MR imaging and T2 mapping of femoral cartilage: in vivo determination of the magic angle effect. American Journal of Roentgenology. 2001;177(3):665-669.
4. Wang L, Regatte RR. Investigation of regional influence of magic-angle effect on T2 in human articular cartilage with osteoarthritis at 3 T. Academic Radiology. 2015;22(1):87-92.
5. Leskinen HPP, Hänninen NE, Nissi MJ. T 2 orientation anisotropy mapping of articular cartilage using qMRI. Phys Med Biol. 2023;68(8):085004. doi:10.1088/1361-6560/acc169
6. Fast macromolecular proton fraction mapping from a single off‐resonance magnetization transfer measurement - Yarnykh - 2012 - Magnetic Resonance in Medicine - Wiley Online Library. https://onlinelibrary.wiley.com/doi/full/10.1002/mrm.23224. Accessed October 31, 2023.
7. Kisel AA, Naumova AV, Yarnykh VL. Macromolecular proton fraction as a myelin biomarker: principles, validation, and applications. Frontiers in neuroscience. 2022;16:819912.
8. Eckstein F, Burstein D, Link TM. Quantitative MRI of cartilage and bone: degenerative changes in osteoarthritis. NMR in Biomedicine. 2006;19(7):822-854. doi:10.1002/nbm.1063
9. Joseph T. Myelin water, magnetization transfer, and inhomogeneous magnetization transfer imaging orientation dependence : observations and thoughts. 2023. doi:10.14288/1.0435676
10. Karan P, Edde M, Gilbert G, Barakovic M, Magon S, Descoteaux M. Data-driven characterization and correction of the orientation dependence of magnetization transfer measures using diffusion MRI. October 2023:2023.10.05.561088. doi:10.1101/2023.10.05.561088
11. Pampel A, Müller DK, Anwander A, Marschner H, Möller HE. Orientation dependence of magnetization transfer parameters in human white matter. NeuroImage. 2015;114:136-146. doi:10.1016/j.neuroimage.2015.03.068
12. Hou J, Wong VWS, Wong GLH, et al. Macromolecular proton fraction mapping based on spin-lock for the non-invasive diagnosis of early stage liver fibrosis. Int Soc Magn Reson Med, International Society for Magnetic Resonance in Medicine. 2021. https://index.mirasmart.com/ISMRM2021/PDFfiles/0314.html. Accessed October 31, 2023.
13. Hou J, Wong VW, Jiang B, et al. Macromolecular proton fraction mapping based on spin‐lock magnetic resonance imaging. Magn Reson Med. 2020;84(6):3157-3171. doi:10.1002/mrm.28362
14. Rautiainen J, Nissi MJ, Liimatainen T, Herzog W, Korhonen RK, Nieminen MT. Adiabatic rotating frame relaxation of MRI reveals early cartilage degeneration in a rabbit model of anterior cruciate ligament transection. Osteoarthritis and Cartilage. 2014;22(10):1444-1452. doi:10.1016/j.joca.2014.04.023
15. Casula V, Nissi MJ, Podlipská J, et al. Elevated adiabatic T1ρ and T2ρ in articular cartilage are associated with cartilage and bone lesions in early osteoarthritis: A preliminary study. J Magn Reson Imaging. 2017;46(3):678-689. doi:10.1002/jmri.25616
16. Hänninen N, Rautiainen J, Rieppo L, Saarakkala S, Nissi MJ. Orientation anisotropy of quantitative MRI relaxation parameters in ordered tissue. Sci Rep. 2017;7(1):9606. doi:10.1038/s41598-017-10053-2
17. Hänninen NE, Nykänen O, Prakash M, Hanni M, Nieminen MT, Nissi MJ. Orientation anisotropy of quantitative MRI parameters in degenerated human articular cartilage. Journal Orthopaedic Research. 2021;39(4):861-870. doi:10.1002/jor.24778 18. Zaiss M, Zu Z, Xu J, et al. A combined analytical solution for chemical exchange saturation transfer and semi-solid magnetization transfer. NMR Biomed. 2015;28(2):217-230. doi:10.1002/nbm.3237
19. Wáng YXJ, Zhang Q, Li X, Chen W, Ahuja A, Yuan J. T1ρ magnetic resonance: basic physics principles and applications in knee and intervertebral disc imaging. Quantitative imaging in medicine and surgery. 2015;5(6):858.
20. Pang Y. An order parameter without magic angle effect (OPTIMA) derived from dispersion in ordered tissue. Magnetic Resonance in Med. 2020;83(5):1783-1795. doi:10.1002/mrm.28045
Figures