1097
Amide proton transfer weighted signal of multiple sclerosis lesions and normal appearing white matter1School of Health Sciences, University of Newcastle, Callaghan, Australia, 2Hunter Medical Research Institute, New Lambton Heights, Australia, 3College of Applied Medical Sciences, University of Jeddah, Jeddah, Saudi Arabia, 4School of Biomedical Sciences and Pharmacy, University of Newcastle, Callaghan, Australia, 5Department of R&D Advanced Applications, Olea Medical, La Ciotat, France, 6Department of Radiology, King Fahd Hospital of the University, Imam Abdulrahman Bin Faisal University, Al Khobar, Saudi Arabia, 7Siemens Healthineers, Erlangen, Germany, 8School of Medicine and Public Health, University of Newcastle, New Lambton Heights, Australia, 9Department of Neurology, John Hunter Hospital, New Lambton Heights, Australia
Synopsis
Keywords: CEST / APT / NOE, Multiple Sclerosis
Motivation: Monitoring disease progression in people with relapsing-remitting multiple sclerosis (pw-RRMS) presents a substantial clinical challenge. Conventional MRI often fails to provide molecular biomarkers for pathophysiological changes like myelin protein accumulation indicative of demyelination.
Goal(s): The study aimed to validate whether amide proton transfer weighted (APTw) imaging could be a sensitive molecular marker for detecting demyelination in MS lesions.
Approach: We conducted APTw imaging at 3T on 24 pw-RRMS, evaluating the signal intensity within MS lesions compared to contralateral normal-appearing white matter (cNAWM) regions.
Results: The investigation revealed a statistically significant increase in APTw signal intensity in MS lesions compared to cNAWM regions.
Impact: Elevated APTw signal intensity could serve as a non-invasive molecular biomarker for demyelination, potentially aiding in the more accurate monitoring of MS disease progression and treatment efficacy.
Introduction
Multiple Sclerosis (MS) is a chronic neurodegenerative disease whose diagnosis and monitoring relies on conventional MRI1. Unfortunately, the MRI biomarkers of MS are not unique to its pathophysiological substrates 2. Autoimmune attacks in MS disease cause inflammatory demyelination, leading to axonal loss and destruction of myelin. Axonal loss and demyelination in MS lead to the breakdown of myelin proteins2,3. Novel MRI techniques attempt to unravel the biochemical changes and demyelination processes occurring in the focal MS lesions and normal-appearing white matter (NAWM) of pw-MS. Some of these studies have validated their MRI findings with histological results of breakdown products of myelin proteins within macrophages/microglia in post-mortem MS brains4,5. To gain insight into proteins involved in demyelination in MS, amide proton transfer weighted (APTw) imaging has been developed as an endogenous proteins contrast technique in tissue6,7. APTw imaging is a novel advanced MRI technique capable of indirectly measuring intra/extra-cellular proteins by detecting the chemical exchange between amide protons of mobile proteins and water protons6,8. This study aims to evaluate APTw signal differences between MS lesions and contralateral normal-appearing white matter (cNAWM). Cellular changes during the demyelination process were assessed by comparing APTw signal intensity in T1-weighted isointense (ISO) and hypointense (black hole-BH) lesions in relation to cNAWM.Methods
$$24 people with relapsing-remitting MS on stable therapy were recruited (19 females and 5 males with mean age:48.11 years; mean disease duration:11.25 years; median EDSS:2). MRI/APTw acquisitions were undertaken on 3T MRI. For assessment of MS lesions, 3D T1-MPRAGE and T2-FLAIR were used. The APTw sequence used a 3D snapshot-GRE. The acquisition time for APTw volumes at two B1 values (1.8μT and 2.6μT) was 3:07 minutes for each B1 (RF saturation with 20 Gaussian pulses with duration/interpulse delay=50/40ms, 55% Duty Cycle, one off-resonance (300ppm) pre-saturation M0 volume and 25 APTw M( ) volumes with equally-spaced relative offsets from -6ppm to 6ppm from water frequency). Additional WASAB1 sequence was acquired for simultaneous B0 and B1 mapping (2:03 minutes)9. The APTw data were denoised10,11, normalised by M0, and B0/B1 corrected (reconstructed with B1=2.6μT)12,13. APTw map was computed around amide relative resonance frequency offset from water (3.5ppm) using the following non-punctual metric13:$$$ APTw =\int_{-4ppm}^{-3ppm} Z(\triangle \omega)\delta \omega -\int_{4ppm}^{3ppm} Z(\triangle \omega)\delta \omega $$$
Where Z(Δω)= M (Δω)/ M0 is the APTw-Z_Spectrum. Pre/post-processing APTw analysis, co-registration with structural MRI maps, and identifying regions of interest (ROI) were all performed with Olea Sphere 3.0 software. Generalized linear model univariate ANOVA was undertaken to test the hypotheses that differences in mean APTw signal intensity. The mean APTw signal intensity was computed from 530 MS lesions and 521 cNAWM ROIs. Receiver operating characteristic curve analyses were performed to evaluate the diagnostic performance of these comparisons.
Results
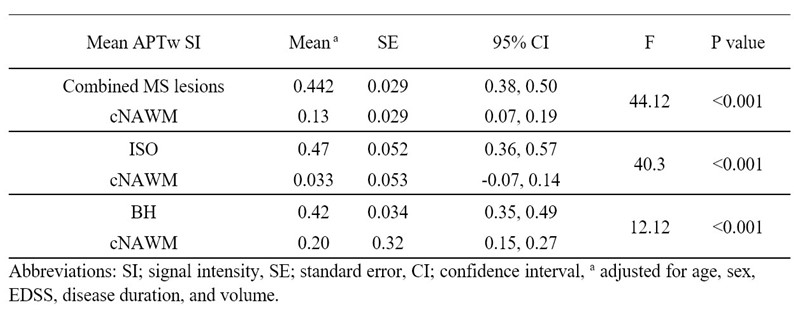
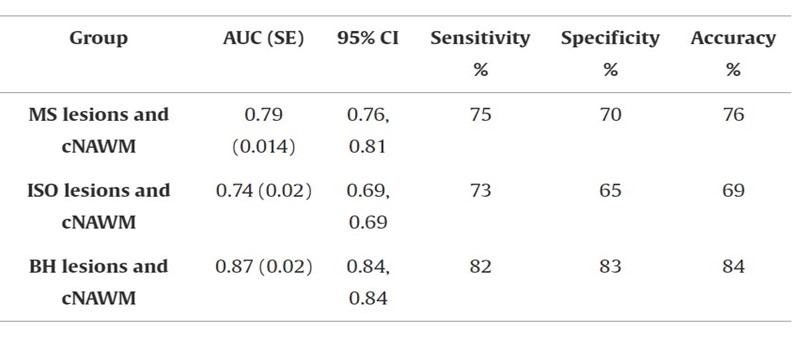
Mean APTw signal intensity values of MS lesions were higher than cNAWM (lesion=0.44, cNAWM=0.13, F=44.12, p<0.001). The mean APTw values of ISO lesions were higher than cNAWM (ISO lesions=0.42,cNAWM=0.21,F=12.12,p<0.001). The mean APTw signal intensity values of BH were higher than cNAWM (BH lesions=0.47, cNAWM=0.033,F=40.3,p<0.001), Table 1. The effect size (difference between lesion and cNAWM) for BH was found to be higher than for ISO (14 vs.2). Diagnostic performance showed that APTw was able to discriminate between all lesions and cNAWM with an accuracy of greater than 75% (AUC=0.79,SE=0.014). Discrimination between ISO lesions and cNAWM was accomplished with an accuracy greater than 69% (AUC=0.74,SE=0.018), while discrimination between BH lesions and cNAWM was achieved at an accuracy of greater than 80% (AUC=0.87,SE=0.021), Table 2.Discussion
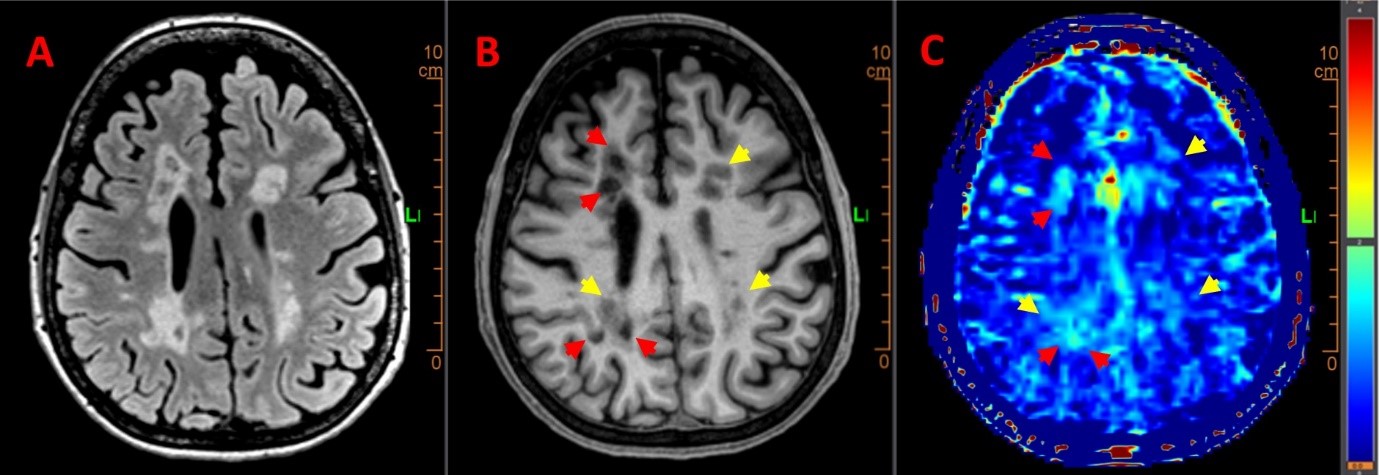
These results present a novel application for assessing APTw signal across different MS lesions in RRMS. We found significantly elevated APTw signal intensity in MS lesions compared to cNAWM regions. These findings are consistent with several studies that confirmed higher APTw signal intensity among MS lesions6,14. These results could be explained by the increase of mobile myelin proteins decomposition and accumulation from the demyelination process5,6. In addition, the signal intensity of BH lesions in APTw is higher than ISO lesions when compared to their respective regions of cNAWM, Figure 1. Gadolinium-free APTw maps could help identify different stages and characteristics of MS that depend on the demyelination status of the various lesion types and stages. APTw imaging has the potential to provide an advantage over FLAIR hyper signal in detecting and characterizing MS lesions.Conclusion
The APTw technique is novel and has the potential to be a useful and sensitive tool for investigating the pathophysiology of MS. Increasing APTw signal intensity in MS lesions supports MS post-mortem histological results. Gadolinium-free APTw contrast mechanism provides promising insight into pathologies on a molecular level.Acknowledgements
- This research was kindly supported by MS Research Australia.
- The authors acknowledge the facilities and scientific and technical assistance of the National Imaging Facility, a National Collaborative Research Infrastructure Strategy (NCRIS) capability, at the Hunter Medical Research Institute Imaging Center, University of Newcastle.
- We thank Dr. Scott Quadrelli, the neuroradiologist who provided valuable advice on identification of MS lesions and sub-categorizing them into two groups.
- We thank the RELIEF staff and investigator teams, and the participants involved.
- Ibrahim Khormi was supported by a PhD scholarship from University of Jeddah, Saudi
Arabia.
References
1. Weidauer S, Raab P, Hattingen E. Diagnostic approach in multiple sclerosis with MRI: an update. Clinical Imaging 2021.
2. Weil MT, Mobius W, Winkler A, et al. Loss of Myelin Basic Protein Function Triggers Myelin Breakdown in Models of Demyelinating Diseases. Cell Rep 2016;16(2):314-322.
3. Lubetzki C, Stankoff B. Demyelination in multiple sclerosis. Handbook of clinical neurology. Volume 122: Elsevier; 2014. p. 89-99.
4. De Groot CJ, Bergers E, Kamphorst W, et al. Post-mortem MRI-guided sampling of multiple sclerosis brain lesions: increased yield of active demyelinating and (p)reactive lesions. Brain 2001;124(Pt 8):1635-1645.
5. Kuhlmann T, Ludwin S, Prat A, Antel J, Bruck W, Lassmann H. An updated histological classification system for multiple sclerosis lesions. Acta Neuropathol 2017;133(1):13-24.
6. Sartoretti E, Sartoretti T, Wyss M, et al. Amide Proton Transfer Weighted Imaging Shows Differences in Multiple Sclerosis Lesions and White Matter Hyperintensities of Presumed Vascular Origin. Front Neurol 2019;10:1307.
7. Falk Delgado A, Van Westen D, Nilsson M, et al. Diagnostic value of alternative techniques to gadolinium-based contrast agents in MR neuroimaging-a comprehensive overview. Insights Imaging 2019;10(1):84.
8. Ye H, Shaghaghi M, Chen Q, et al. In Vivo Proton Exchange Rate (k(ex) ) MRI for the Characterization of Multiple Sclerosis Lesions in Patients. J Magn Reson Imaging 2021;53(2):408-415.
9. Schuenke P, Windschuh J, Roeloffs V, Ladd ME, Bachert P, Zaiss M. Simultaneous mapping of water shift and B(1) (WASABI)-Application to field-Inhomogeneity correction of CEST MRI data. Magn Reson Med 2017;77(2):571-580.
10. Buckheit J, Chen S, Donoho D, Johnstone I, Scargle J. About wavelab. Handbook of WaveLab Version 1995;850:1-37.
11. Breitling J, Deshmane A, Goerke S, et al. Adaptive denoising for chemical exchange saturation transfer MR imaging. NMR in Biomedicine 2019;32(11):e4133.
12. Windschuh J, Zaiss M, Meissner JE, et al. Correction of B1‐inhomogeneities for relaxation‐compensated CEST imaging at 7 T. NMR in biomedicine 2015;28(5):529-537.
13. Papageorgakis C, Firippi E, Gy B, et al. CEST 2022–Fast WASABI post-processing: Access to rapid B0 and B1 correction in clinical routine for CEST MRI. Magnetic Resonance Imaging 2023.
14. Dula AN, Asche EM, Landman BA, et al. Development of chemical exchange saturation transfer at 7 T. Magn Reson Med 2011;66(3):831-838.
Figures