1096
High-Resolution Reduced FOV Renal Chemical Exchange Saturation Transfer MRI Using orthogonal RF pulses1School of Biomedical Engineering, Southern Medical University, Guangzhou, China, 2Guangdong Provincial Key Laboratory of Medical Image Processing & Guangdong Province Engineering Laboratory for Medical Imaging and Diagnostic Technology, Southern Medical University, Guangzhou, China, 3Medical Imaging Center, Nanfang Hospital, Southern Medical University, Guangzhou, China, 4Philips Healthcare, Shenzhen, China, 5Philips Healthcare, Guangzhou, China, 6Department of Rehabilitation, Zhujiang Hospital, Southern Medical University, Guangzhou, China
Synopsis
Keywords: CEST / APT / NOE, CEST & MT
Motivation: Long scanning time and low resolution limit the chemical exchange saturation transfer (CEST) clinical translation.
Goal(s): We aimed to develop a high-resolution renal reduced field of view CEST (rCEST) technique to reduce scanning time.
Approach: The rFOV based on orthogonal RF pulses in combination with conventional CEST module was performed on a volunteer and compared this technique with full-size FOV CEST (fCEST).
Results: Compared to fCEST, rCEST has shorter scanning time, higher image quality, and better saturation efficiency at the same image resolution.
Impact: The rCEST technique may have potential for clinical applications requiring high resolution and metabolic renal CEST-MR image.
Introduction
Given its capacity to identify renal metabolites such as urea, creatinine, glutamate, and others, chemical exchange saturation transfer (CEST) exhibits great potential in the detection of kidney diseases, including chronic kidney disease, clear renal cell carcinama (1-3). However, its clinical application is restricted due to its low spatial resolution and long scanning duration. Reduced field of view (rFOV) techniques have been used in combination with BOLD, diffusion, ect. for renal imaging (4-5). In this study, we proposed a technique based on the use of orthogonal RF pulses in phase encoding to achieve rFOV and combined with conventional CEST sequences to excite small rectangular volumes of interest, which will shorten imaging time and obtain excellent resolution.Methods
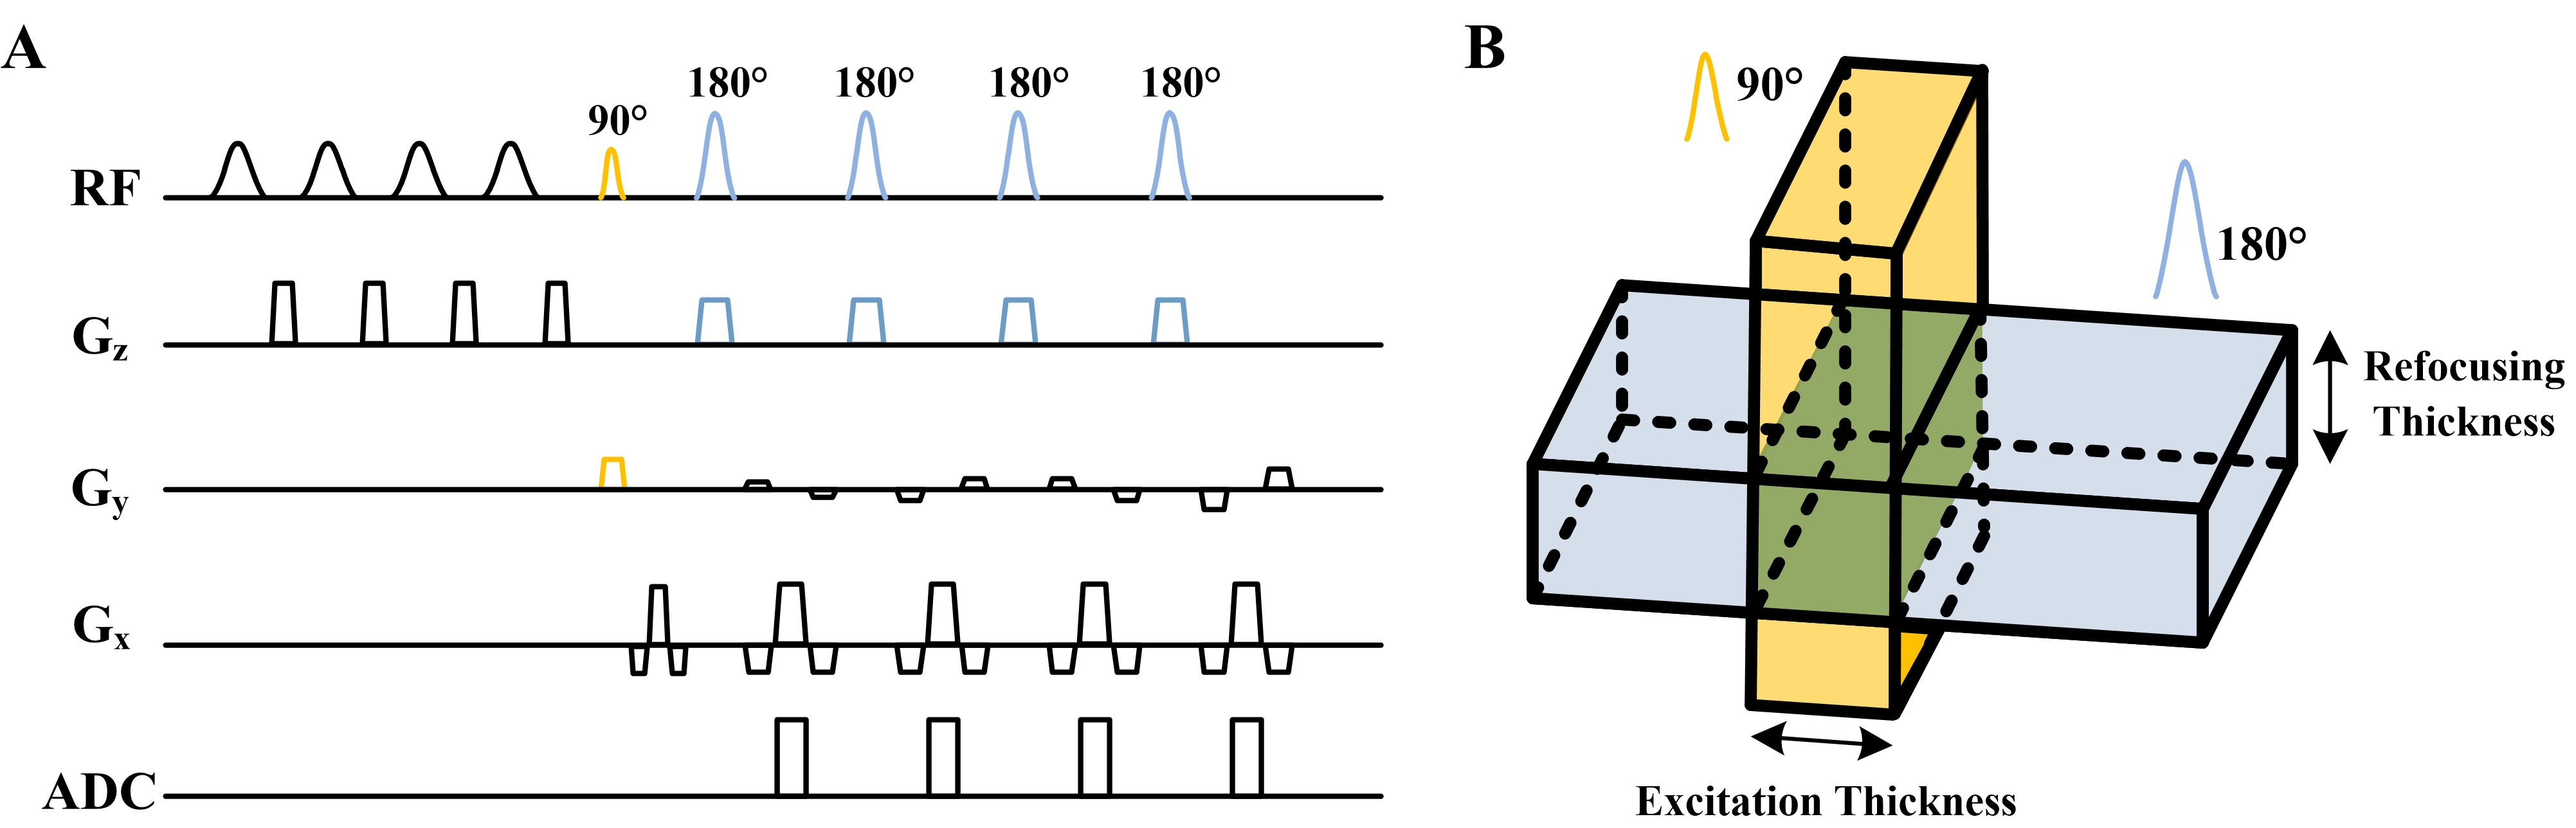
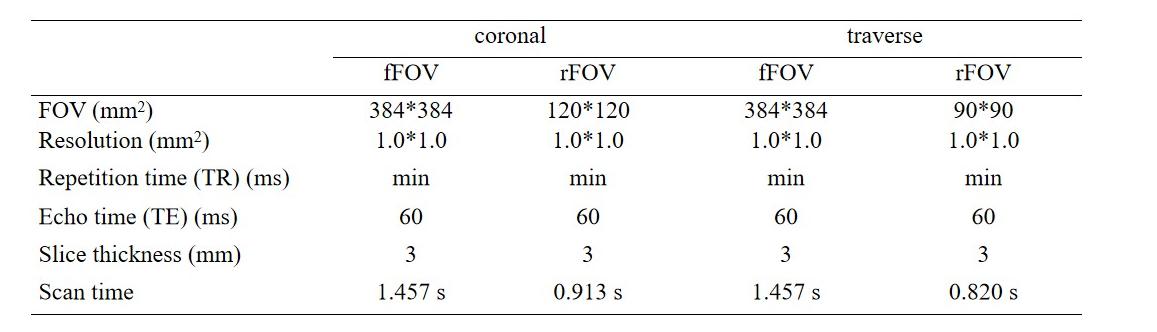
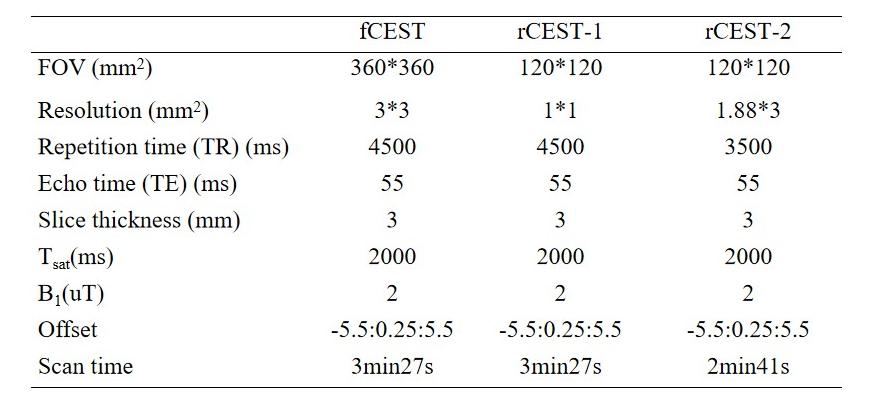
The rFOV approach was integrated with the conventional CEST (pseudocontinuous-wave saturation with TSE as readout) sequence. Figure 1A shows the rCEST sequence design. As shown in Figure 1B, the 90° excitation RF pulse is applied along the phase direction and the 180° refocusing RF pulse is applied along the slice-selective direction, then, the signal is generated only within the overlapping central region. To evaluate the performance of rCEST, a pilot study was done for human kidney on a Philips 3.0T Ingenia system (Philips Healthcare, Best, The Netherlands) equipped with 32 channel torso coil for abdomen. The study was approved by the local IRB. The renal MR protocol included high resolution T2w, fCEST (full-size FOV CEST) and rCEST. Detailed scanning parameters are summarized in Table 1 and Table 2.Results
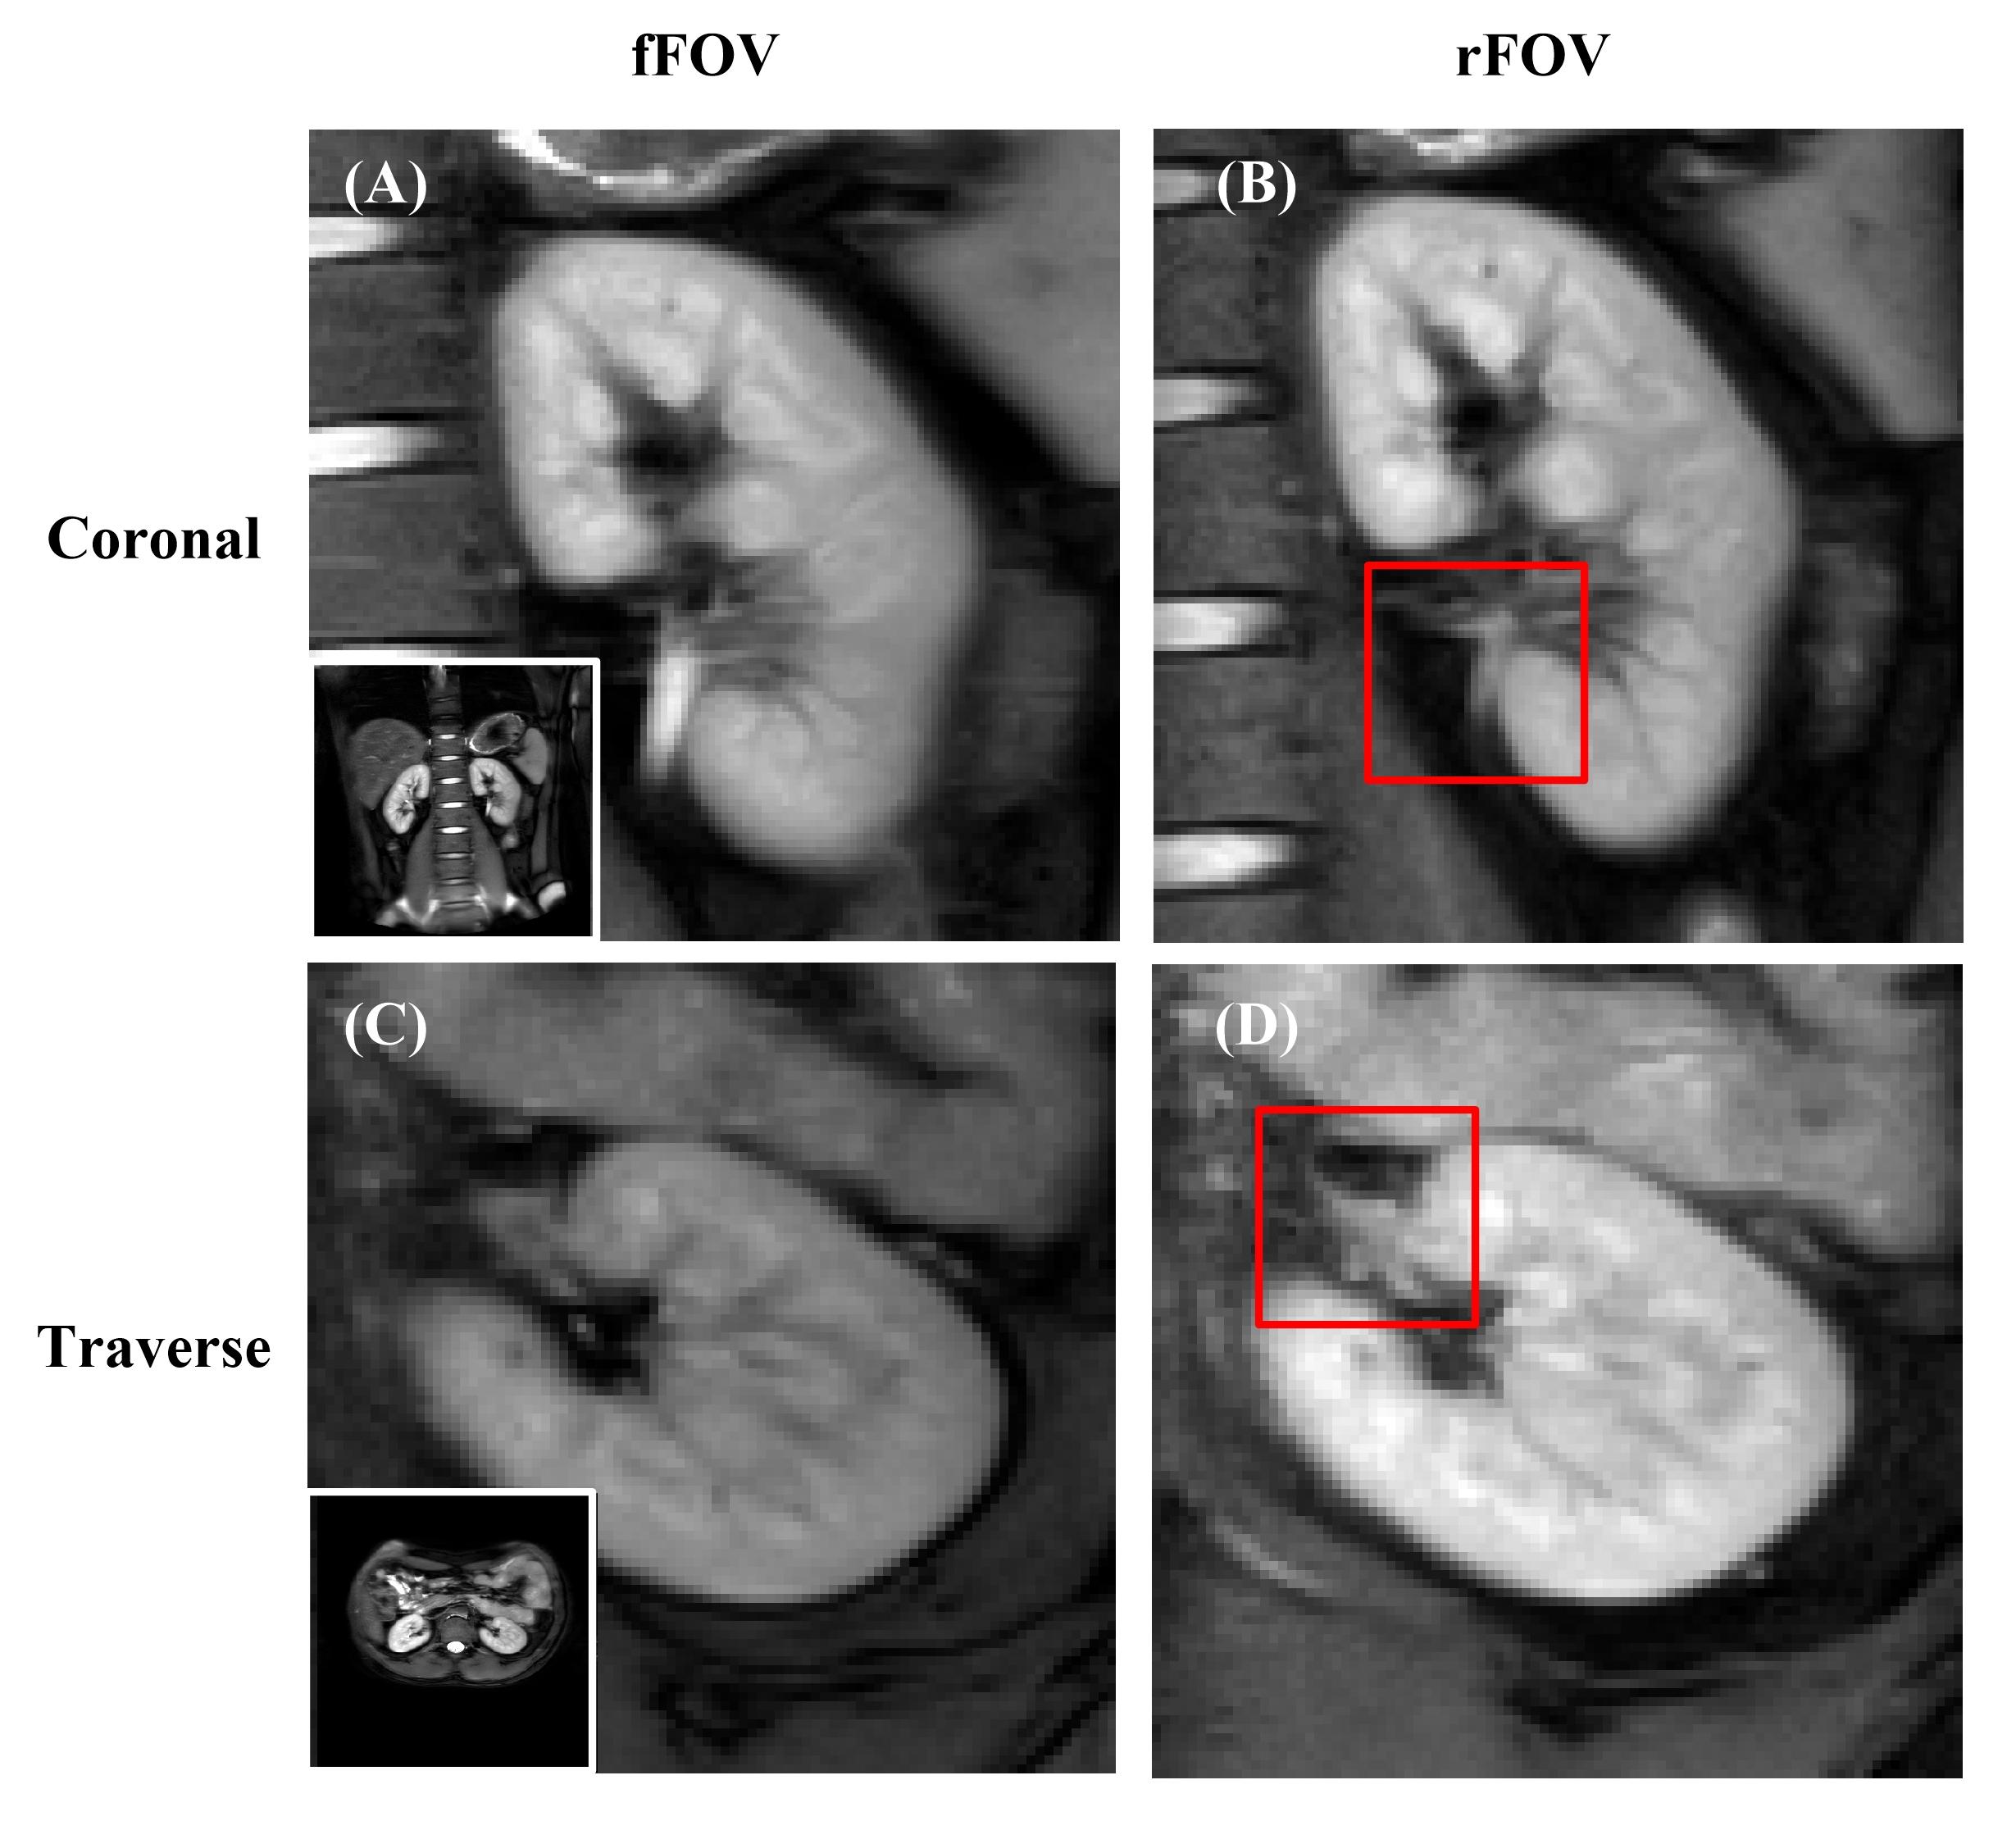
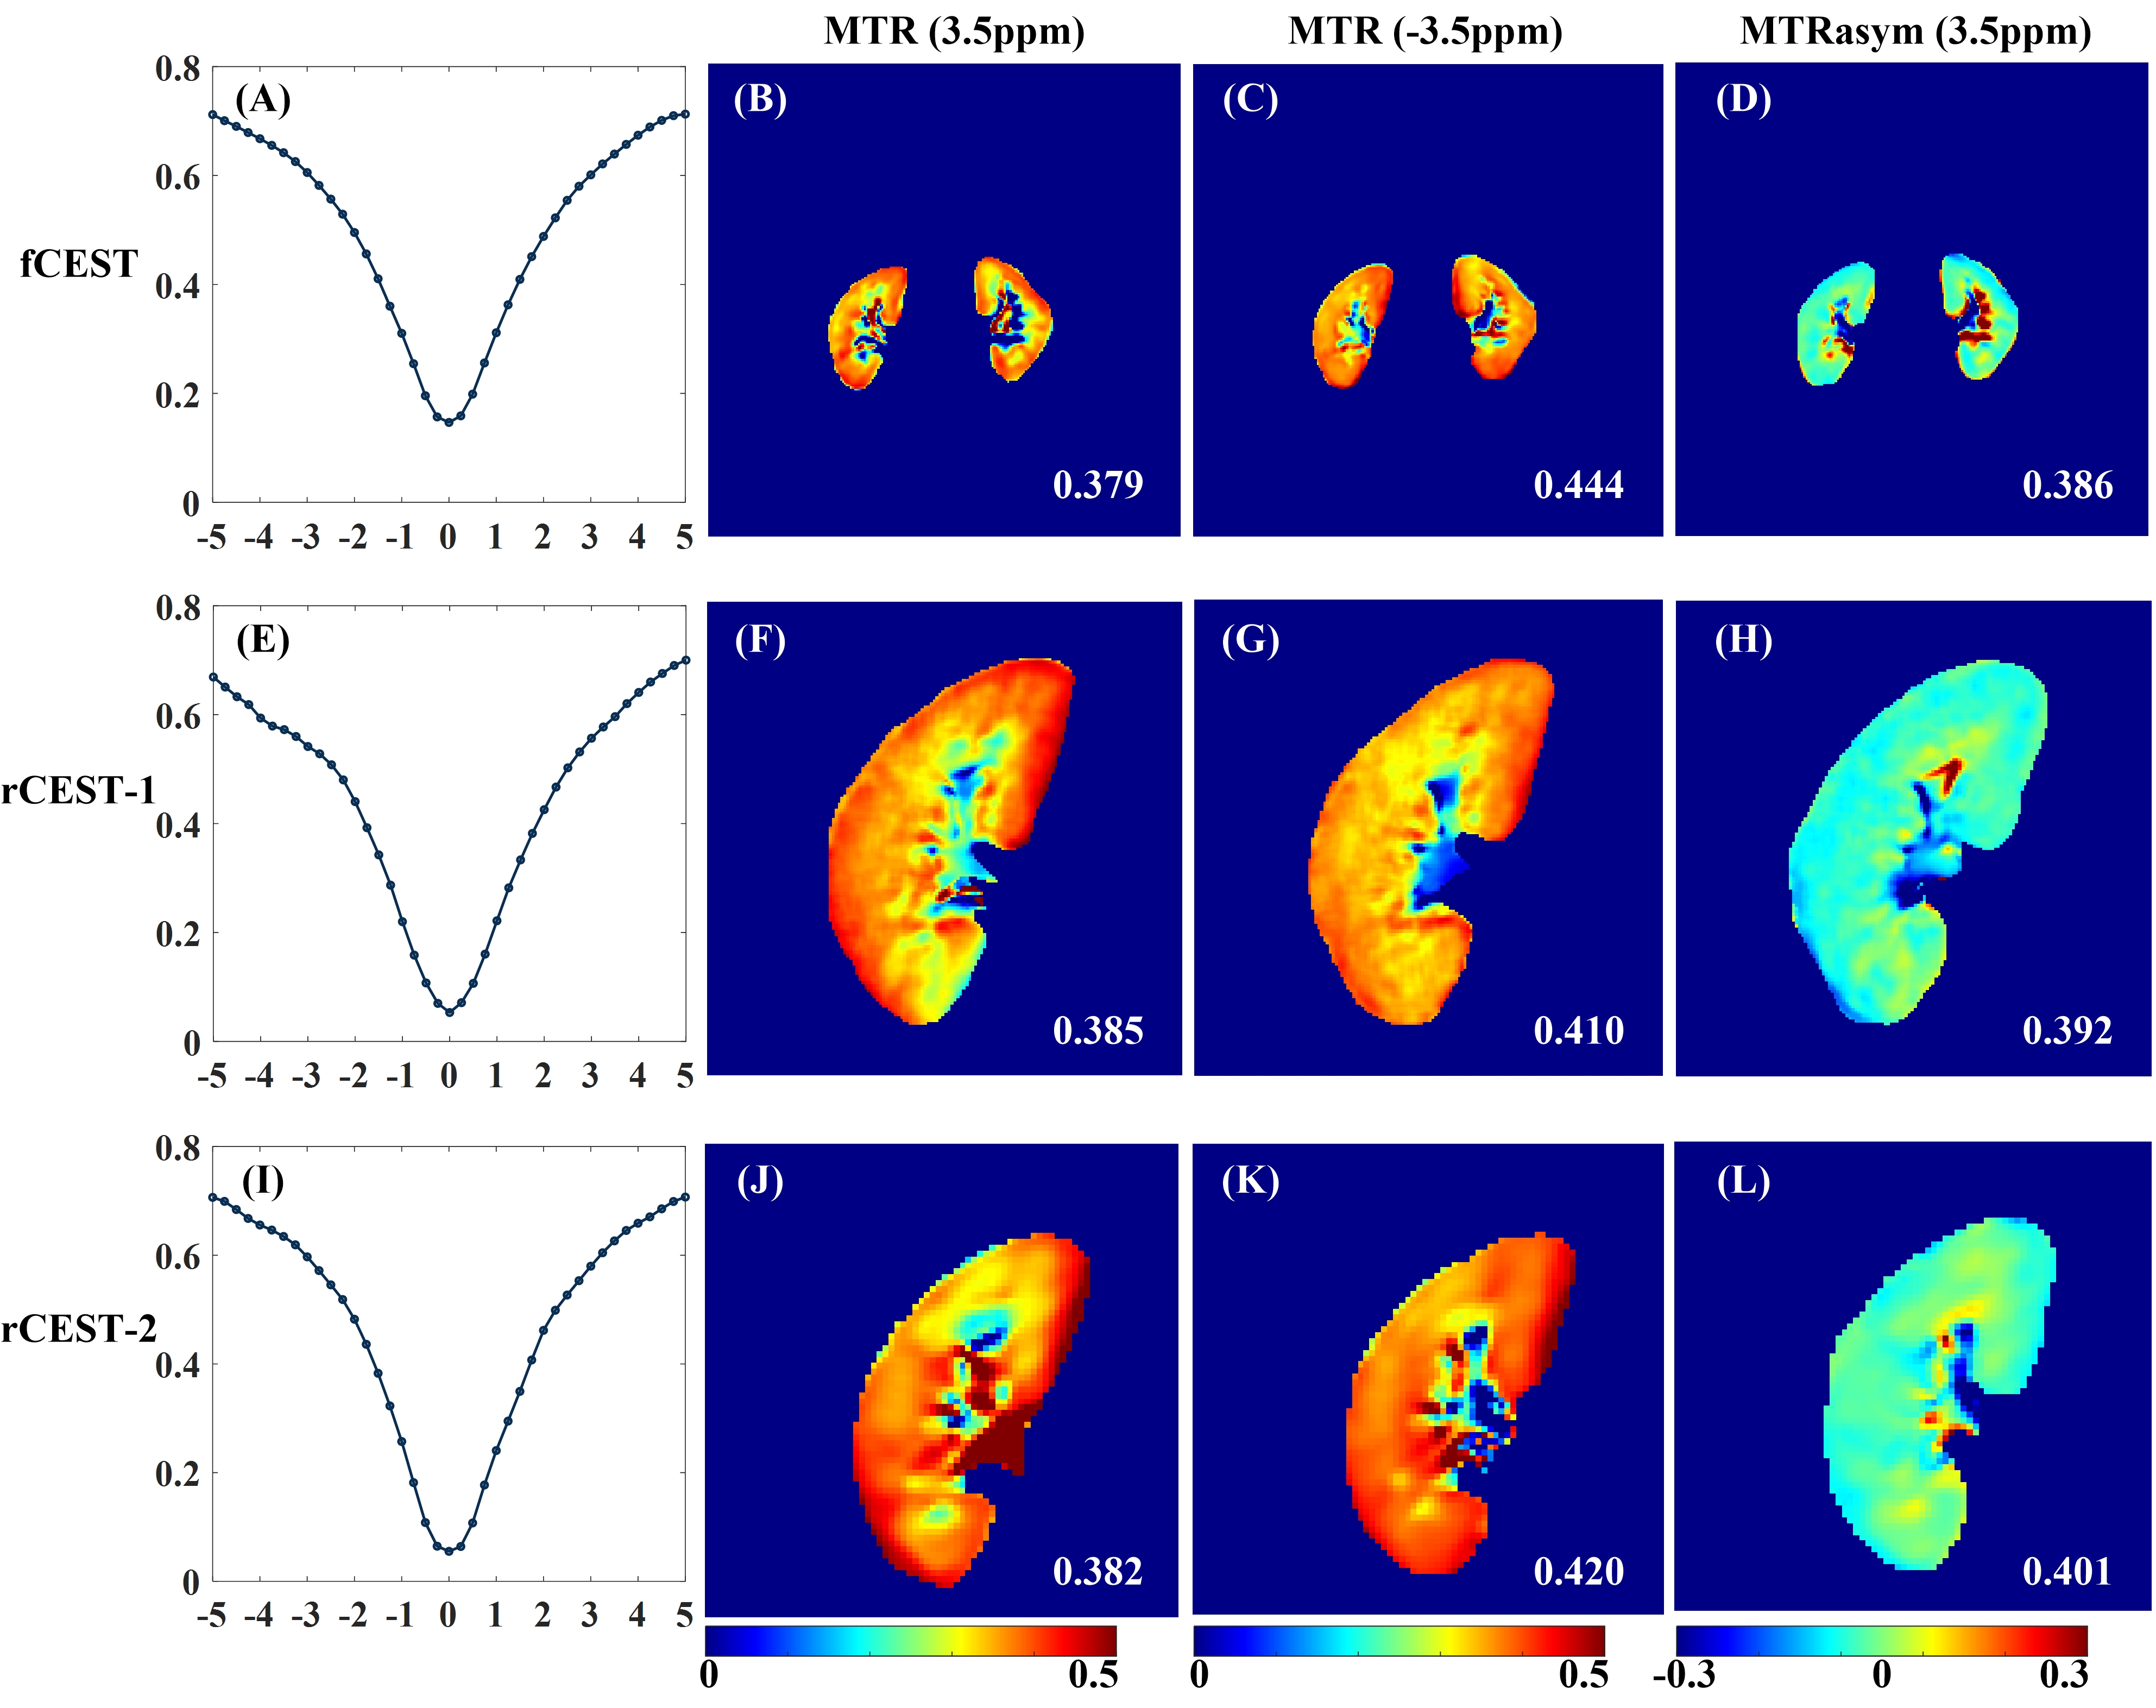
Compared to fFOV, Figure 2 shows that the coronal and traverse rFOV T2 weighted images of the kidney, rFOV technique improves the image quality and shows more detailed information (as show the red boxed section) with shorter scanning time. The first column of Figure 3 shows the smooth cortical renal Z-spectra in a volunteer at different resolutions and scanning times. The pseudo-color maps of MTR (3.5ppm), MTR (-3.5ppm), and MTRasym (3.5ppm) revealed the structurally distinct and morphologically well-defined kidneys. The cortical rCEST and fCEST signals are consistent.Discussion
In this study, we designed rFOV CEST imaging based on orthogonal RF pulses. The preliminary results suggested that it can reduce scanning time, meanwhile, with high resolution. Besides, the Z-spectrum of rCEST has lower S/S0 signals around 0 ppm, this suggests that better saturation efficiency for rFOV. Further studies are needed to test experimental stability and performance in a clinical setting to provide new solutions for renal patients requiring high resolution and endogenous metabolite alterations.Conclusion
We investigated the feasibility of rCEST, which combines rFOV and CEST for the first time. The rCEST technique can achieve higher image resolution and shorter scanning time, with the potential for clinical applications.Acknowledgements
This study was supported by National Natural Science Foundation of China (U21A6005), Key-Area Research and Development Program of Guangdong Province (2018B030340001, 2018B030333001).References
1、Ju Y, Liu A, Wang Y, et al. Amide proton transfer magnetic resonance imaging to evaluate renal impairment in patients with chronic kidney disease. Magnetic Resonance Imaging 2022;87: 177-182.
2、Li S, He K, Yuan G, et al. WHO/ISUP grade and pathological T stage of clear cell renal cell carcinoma: value of ZOOMit diffusion kurtosis imaging and chemical exchange saturation transfer imaging. European Radiology 2023; 33(6):4229-4439.
3、Wang X, Cao Y, Jiang Y, et al. Effects of Breathing Patterns on Amide Proton Transfer MRI in the Kidney: A Preliminary Comparative Study in Healthy Volunteers and Patients With Tumors. Journal of Magnetic Resonance Imaging Imaging 2023. doi: 10.1002/jmri.29099.
4、Jin N, Deng J, Zhang L, et al. Targeted Single-Shot Methods for Diffusion-Weighted Imaging in the Kidneys. Journal of Magnetic Resonance Imaging 2011;33:1517-1525.
5、Beckett A, Dadakova T, Townsend J, et al. Comparison of BOLD and CBV using 3D EPI and 3D GRASE for cortical layer functional MRI at 7 T. Magnetic Resonance in Medicine 2020;84(6):3128-3145.
Figures