1093
Magnetic Resonance Fingerprinting of the Chemical Exchange Relayed Nuclear Overhauser Effect In Vivo (rNOE-MRF)1Department of Biomedical Engineering, Tel Aviv University, Tel Aviv, Israel, 2School of Chemistry, Tel Aviv University, Tel Aviv, Israel, 3Sagol School of Neuroscience, Tel Aviv University, Tel Aviv, Israel
Synopsis
Keywords: CEST / APT / NOE, CEST & MT
Motivation: Despite its demonstrated ability to provide biological insights into various pathologies, relayed nuclear Overhauser effect (rNOE) imaging is lengthy and biased by water T1 and semisolid MT contrast.
Goal(s): To develop a rapid rNOE quantification MR-Fingerprinting (MRF) method and validate its performance in-vivo.
Approach: An rNOE-MRF acquisition protocol was designed and employed at 7T for imaging three in-vitro tissue types and wild-type mice (n=7). Quantitative glycogen, rNOE, and semisolid MT maps were simultaneously reconstructed.
Results: In-vitro rNOE exchange parameter maps were highly correlated with ground truth (r>0.99, p<0.01, NRMSE<7%). The rNOE and MT quantitative trends in mice were in agreement with previous literature.
Impact: A quantitative molecular MR-Fingerprinting method was developed, allowing for the simultaneous extraction of rNOE and semisolid MT proton-exchange parameter maps. These in-vivo, bias-dismantled maps are expected to aid in the diagnosis and characterization of cancer, stroke, and spinal cord injury.
Introduction
Noninvasive imaging of the relayed nuclear Overhauser effect (rNOE) has provided biological/clinical insights in cancer1, stroke, liver2, and spinal cord injury3 imaging. In the typical settings, rNOE contrast-weighted images are obtained following a full Z-spectrum acquisition, as commonly performed in chemical exchange saturation transfer (CEST) experiments.Distilling the pure rNOE signal from confounding factors, such as water relaxivity, direct saturation, and semisolid magnetization transfer (MT) contrast, is challenging. While several previous works were able to mitigate/eliminate the T1, T2, and semisolid MT contributions from the rNOE signals4-5, they either required a lengthy acquisition or were still affected by the saturation pulse settings employed. In any case, the resulting signals still represented a combined contribution from the proton volume fraction and exchange rate, hindering the direct extraction of the compound of interest concentration.
Since the establishment of magnetic resonance fingerprinting (MRF)6, it has been further developed to quantify various biophysical parameters7,8, including the amide and semisolid MT exchange parameters8,9. Here, we designed an rNOE-MRF approach aimed at the rapid acquisition and simultaneous reconstruction of quantitative rNOE and semisolid MT maps.
Methods
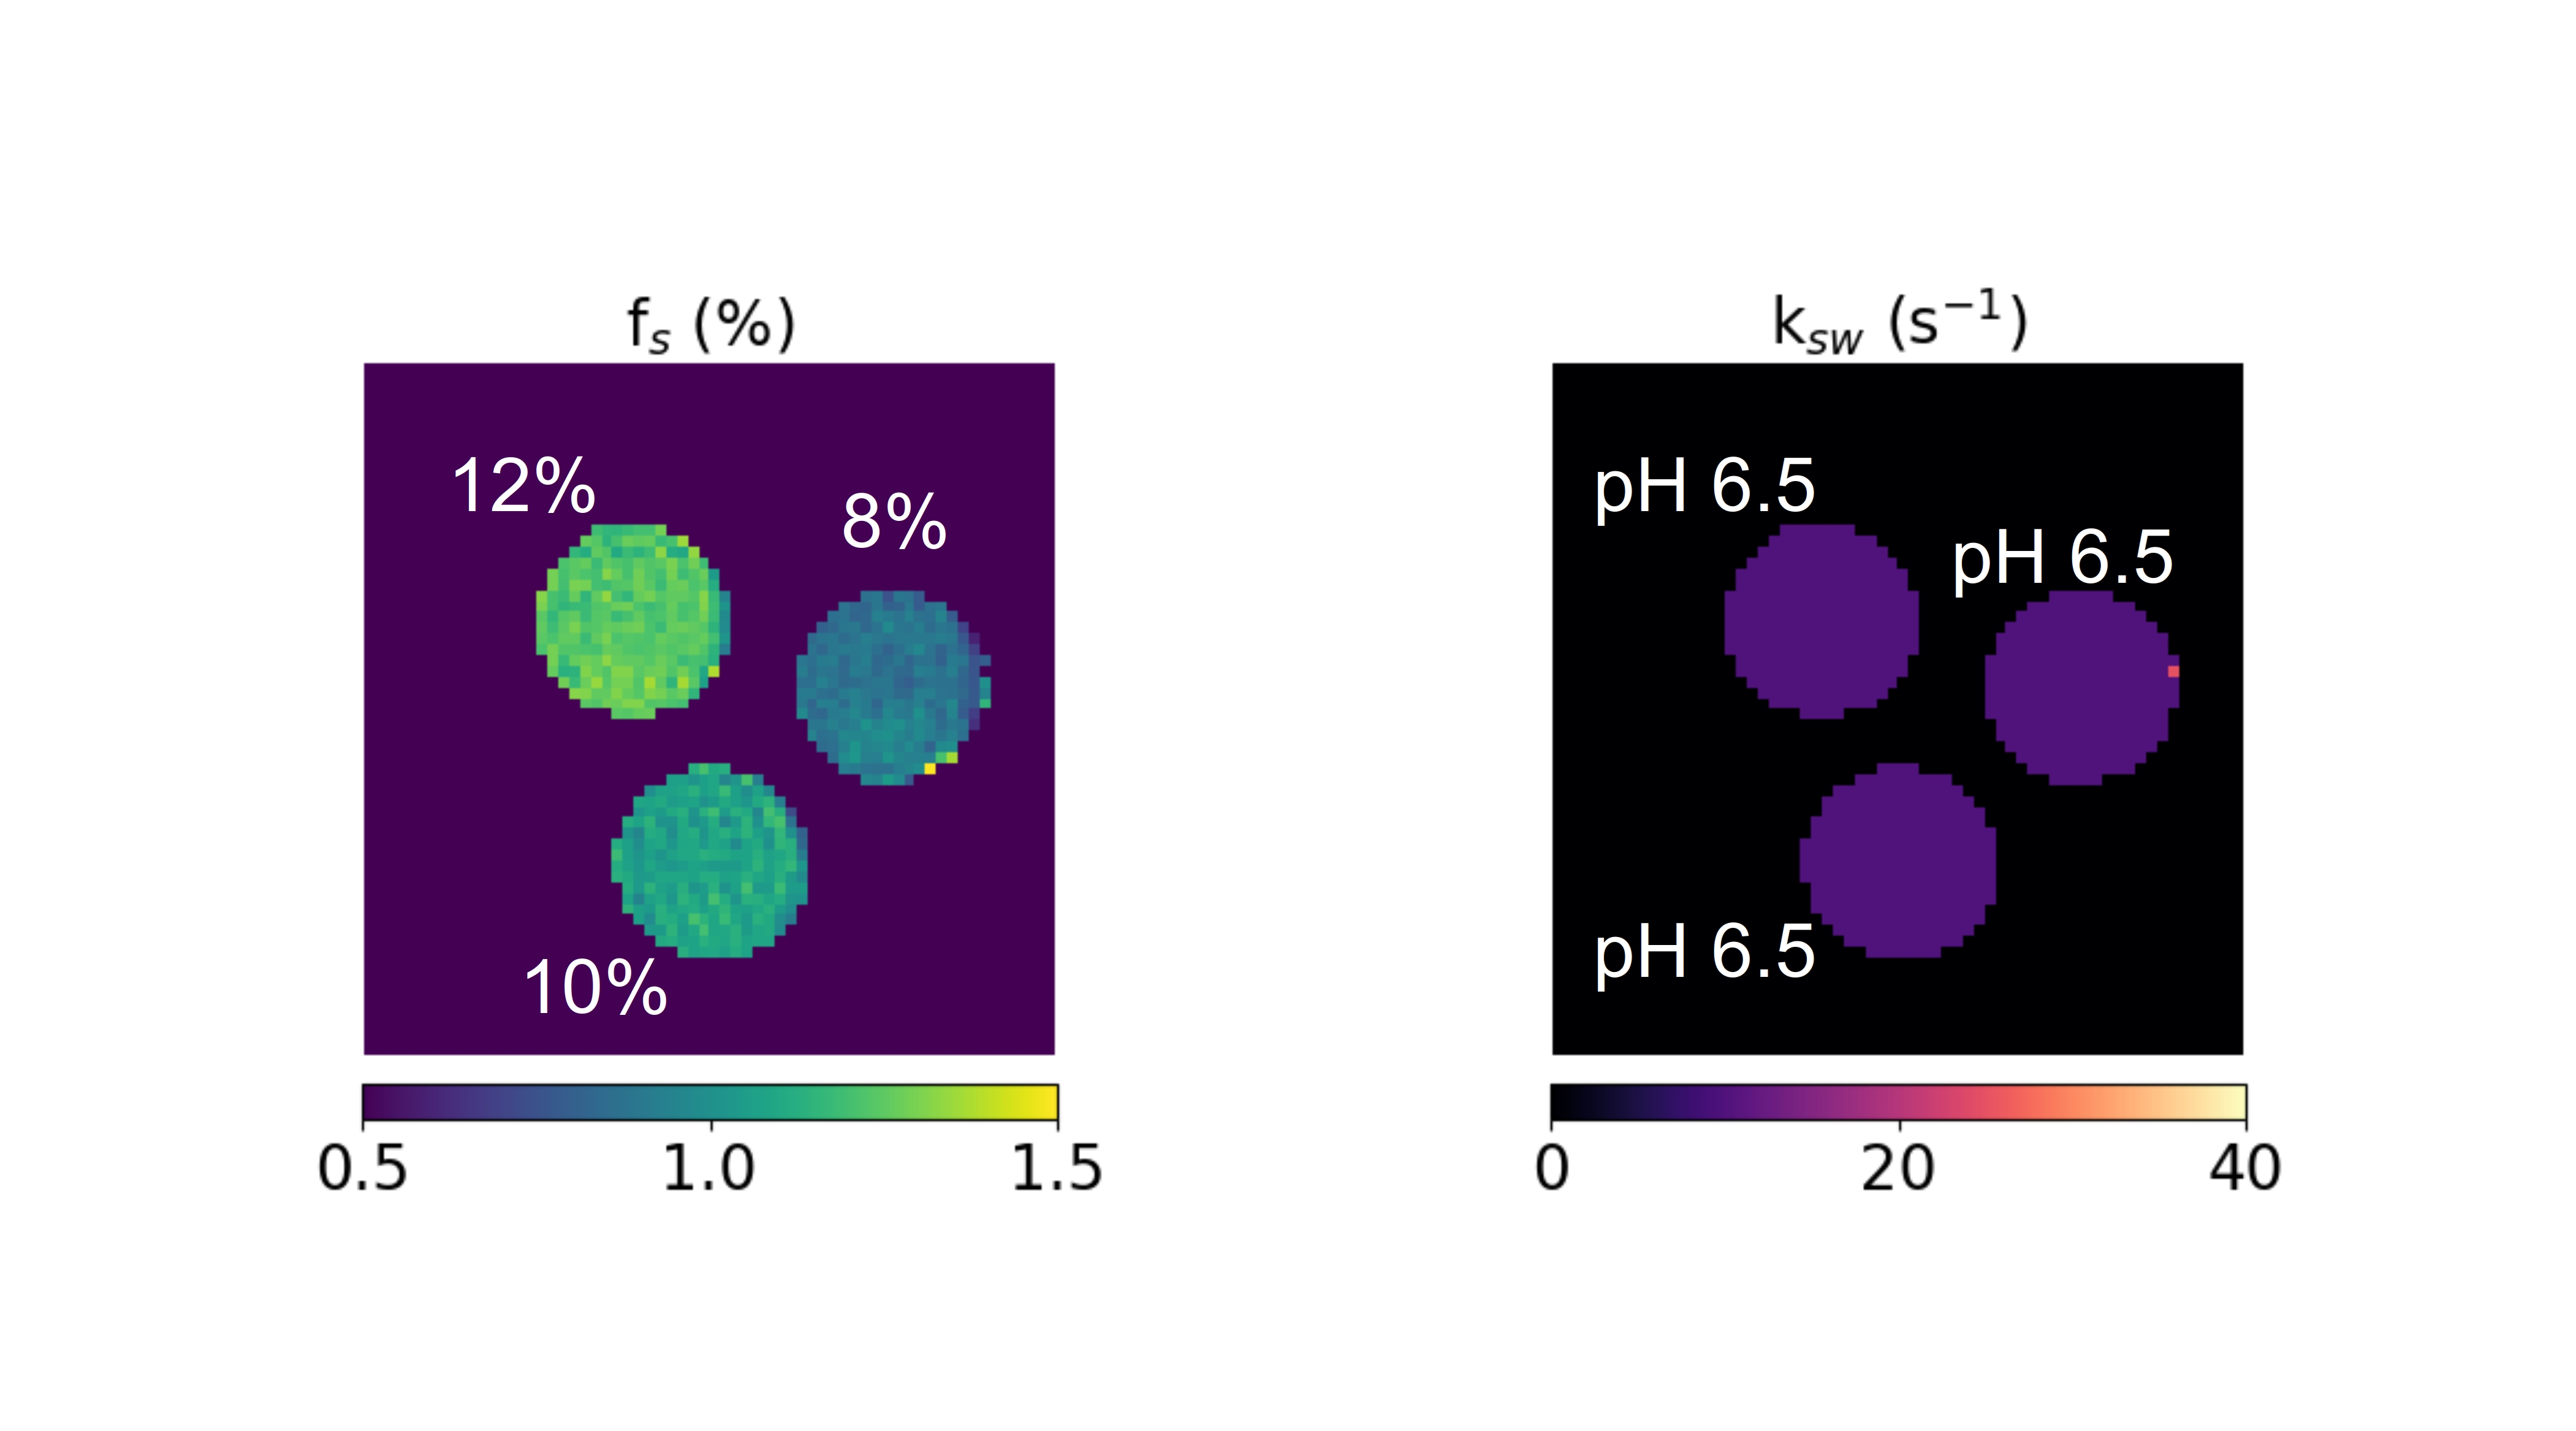
Phantom PreparationTo demonstrate applicability with a variety of rNOE-related targets, three in-vitro phantoms were assembled, including bovine and rabbit liver glycogen (where the glycoNOE effect is centered at -1 ppm) and bovine serum albumin (BSA, where the rNOE effect is centered at approximately -3.5 ppm). The glycogen phantoms included six vials of 25-300 mM glucose units at pH 7.4. The BSA phantom included three vials of 8%-12% BSA at pH 6.5.
Animal Preparation
All animal experiments and procedures complied with the principles of the Israel National Research Council (NRC) and were approved by the Tel Aviv University Institutional Animal Care and Use Committee (IACUC). Wild-type female ICR mice (3-month-old, n=7) were purchased from ENVIGO RMS (Israel) and anesthetized during the scan using isoflurane.
MRI Acquisition
The glycogen rNOE-MRF acquisition schedule fixed the saturation pulse frequency at -1 ppm and randomly varied the saturation power (B1) for 30 iterations between 0-0.5 μT. The saturation pulse length (Tsat) was 1 s, TE/TR = 20/4000 ms, and flip angle (FA) = 90°. For the BSA and in-vivo brain rNOE imaging the saturation pulse frequency was -3.5 ppm, B1 varied for 30 iterations between 0-4 μT, Tsat = 2.5 s, and TE/TR = 20/3500 ms. Imaging was performed using a preclinical 7T scanner (Bruker, Germany), implementing a CW MRF sequence with a SE-EPI readout7,8, matrix = 64x64, field of view (FOV) = 32×32 mm (phantoms) or 19x19 mm (mice). The slice thickness was 5 mm for phantoms and 1 mm for the in-vivo scans. The scan time for glycoNOE imaging was 120 s and 105 s for BSA and in-vivo brain imaging.
Data Processing
Dictionaries of simulated signal intensity trajectories were generated using a Bloch–McConnell equations numerical solver9, implemented in C++ according to the pulseq-based standard10. A total of 1,394,820, 4,757,688, or 9,336,600 entries were generated for the BSA phantoms, glycogen phantoms, or the combined in-vivo rNOE and MT dictionary, respectively. Dot-product-based pattern matching took 60.20 s / 117.6 s for glycogen phantoms / in-vivo mice, respectively.
Results and Discussion
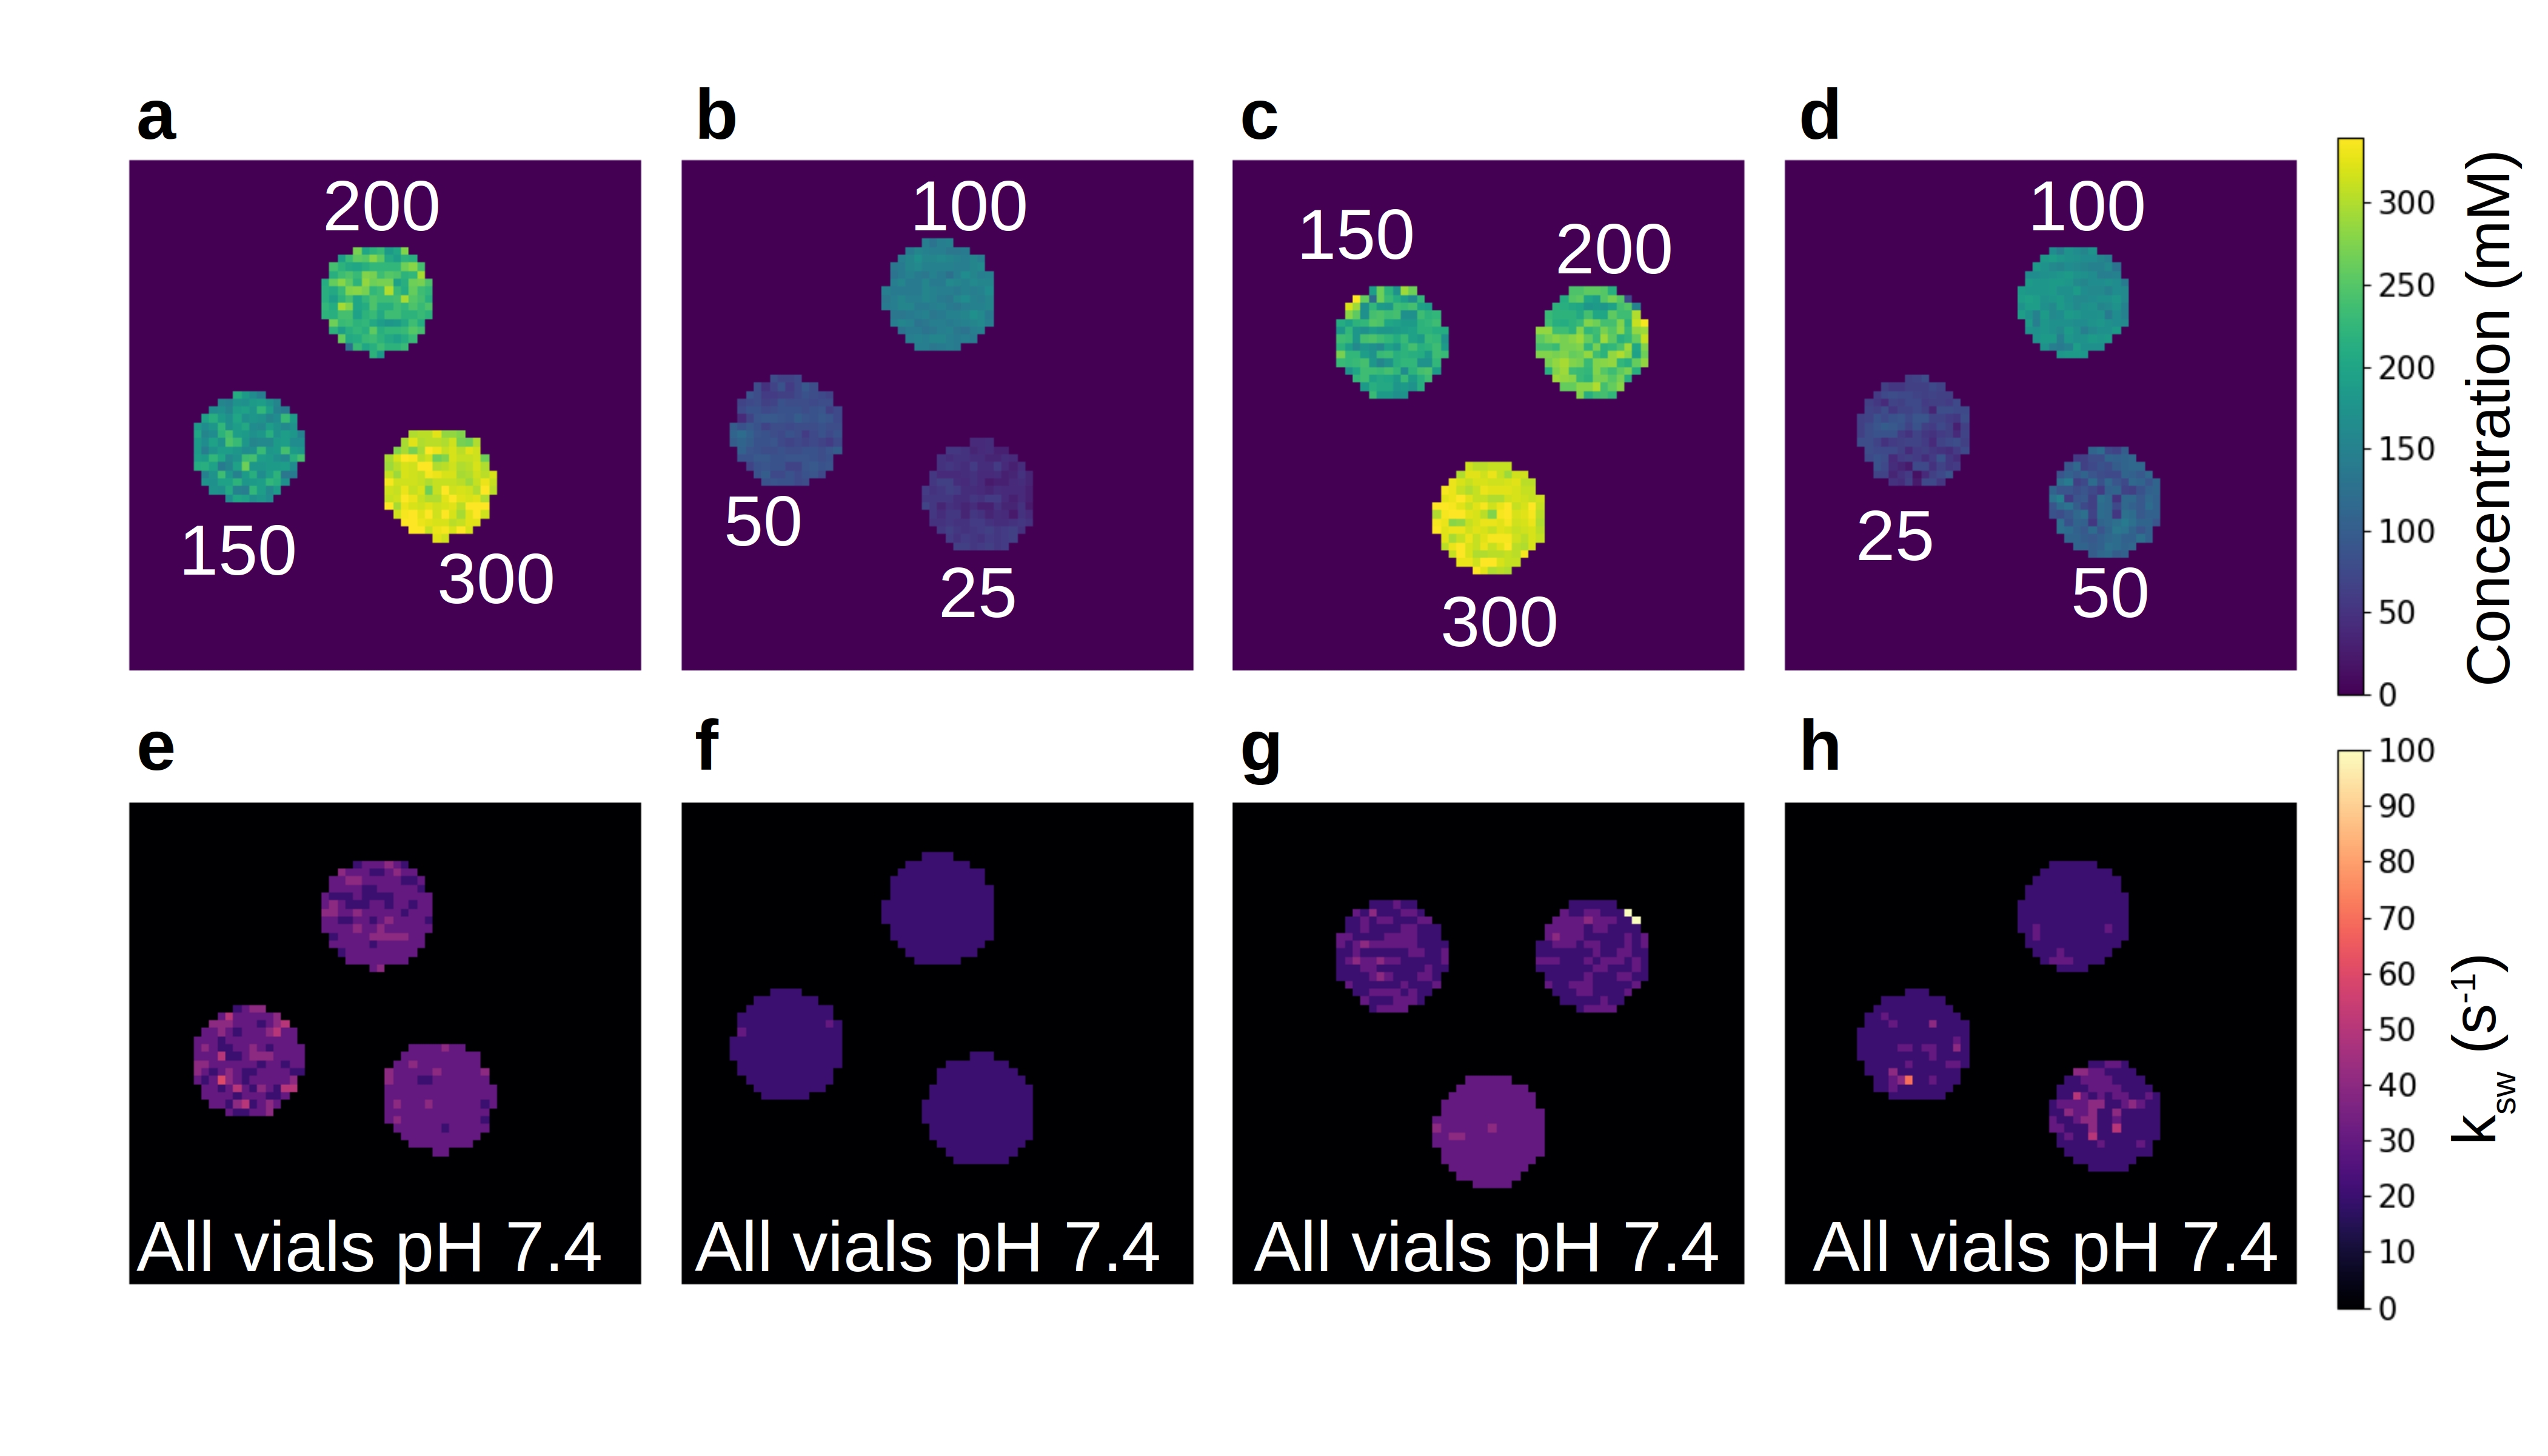
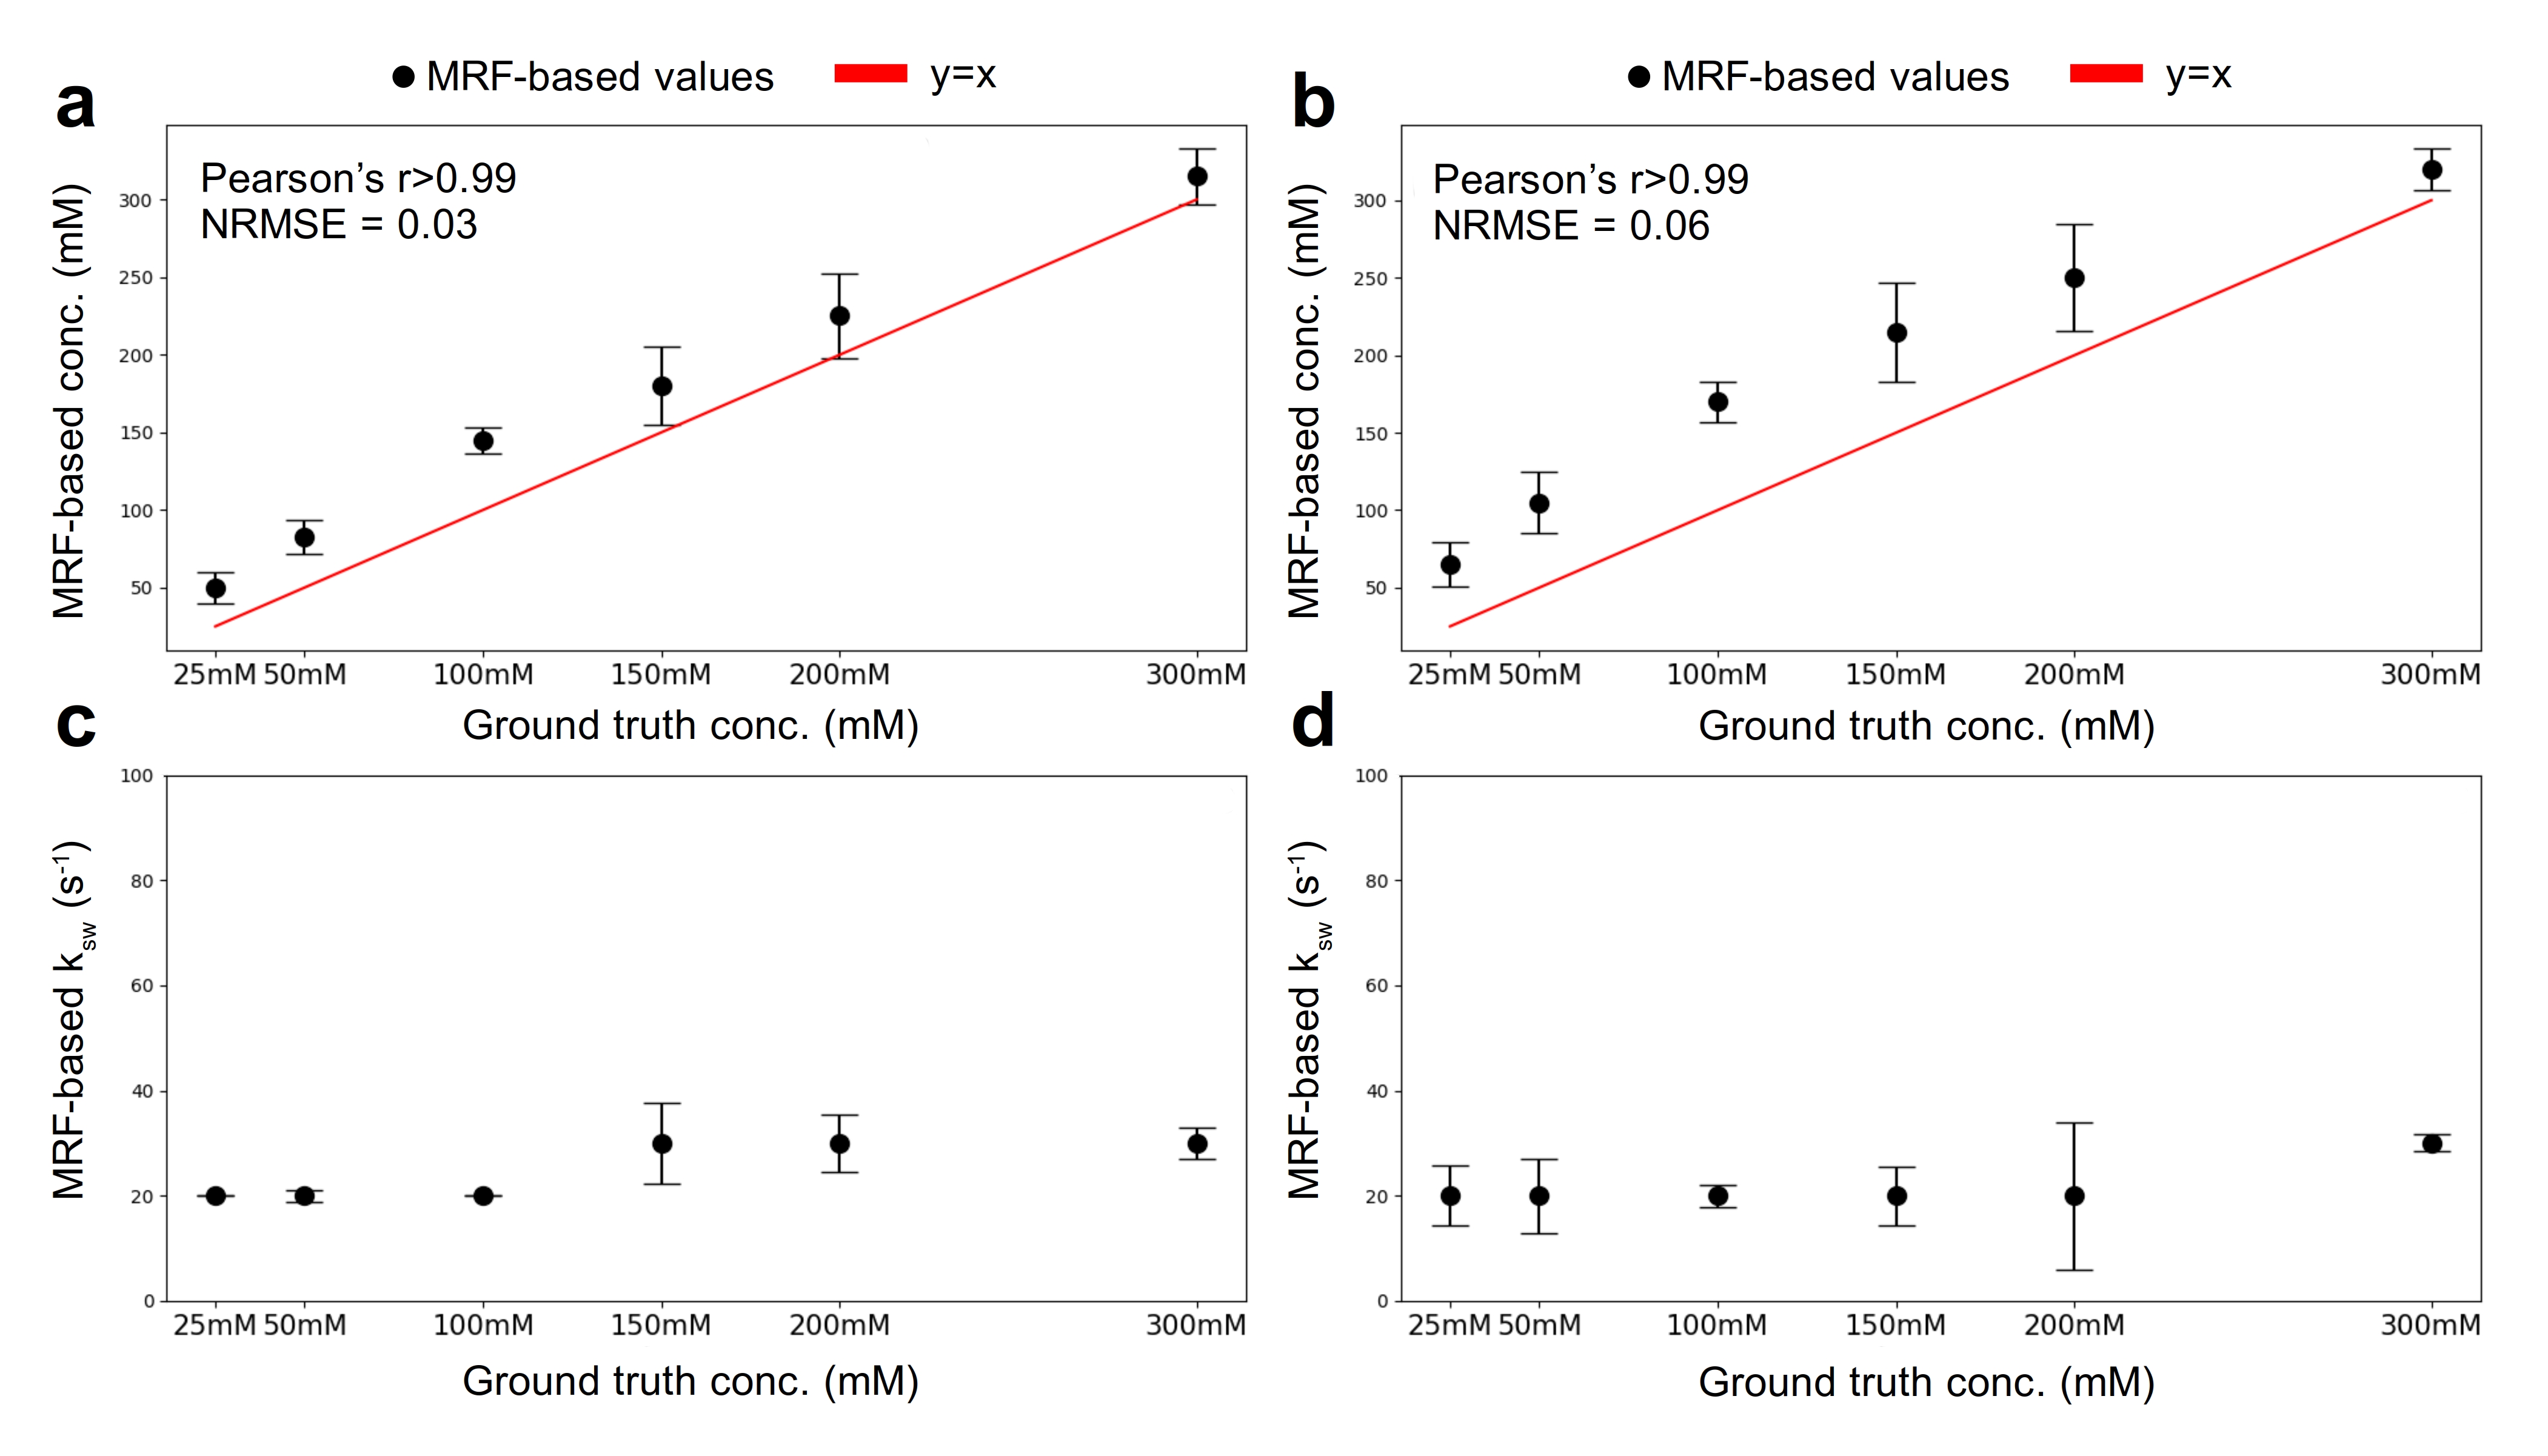
rNOE-MRF of Glycogen and BSA PhantomsIn bovine and rabbit liver glycogen phantoms, the MFR-matched concentrations demonstrated excellent agreement with the ground truth (Fig. 1a-d, Fig. 2a-b, Pearson’s r>0.99, p<0.01, normalized root mean squared error (NRMSE) <7%). The matched proton exchange rates (Fig.1e-h, Fig. 2c-d) were successfully decoupled from the concentration dynamics, demonstrating a slow exchange rate of ~20 s-1, as expected2. The MRF-matched rNOE proton volume fractions were correlated with ground truth BSA concentrations (Fig. 3, Pearson’s r>0.99, p<0.05).
In vivo MRF
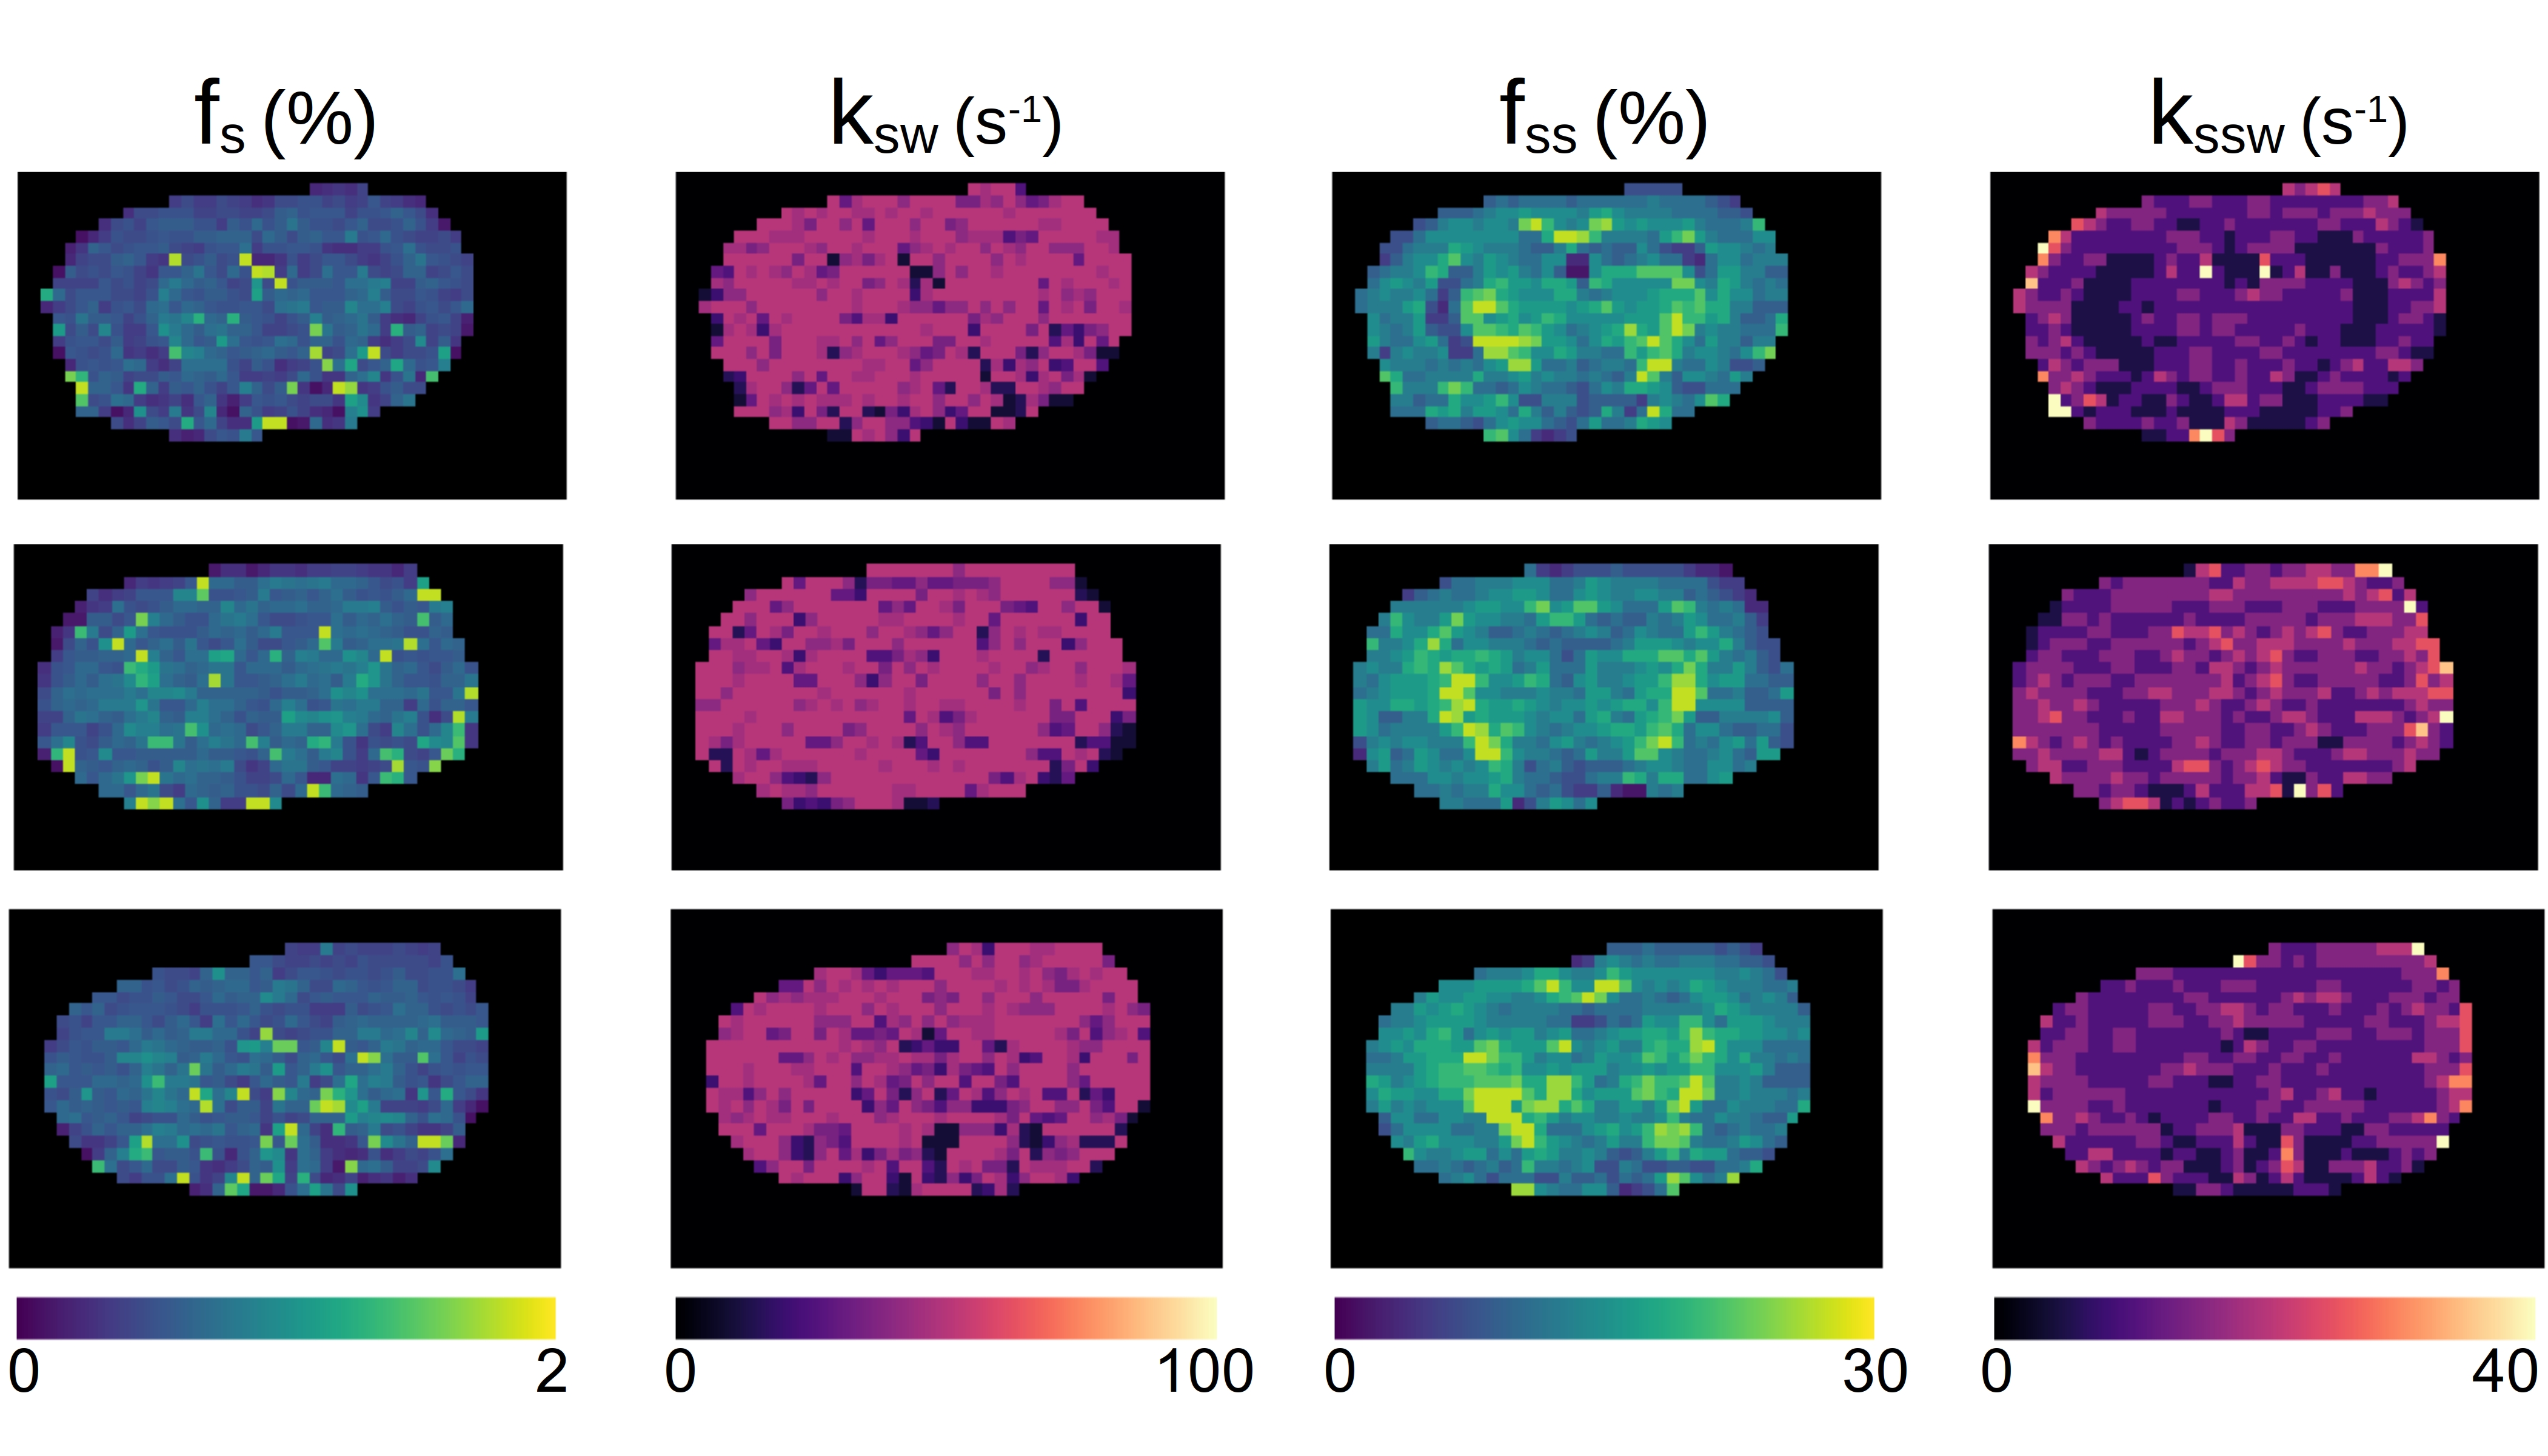
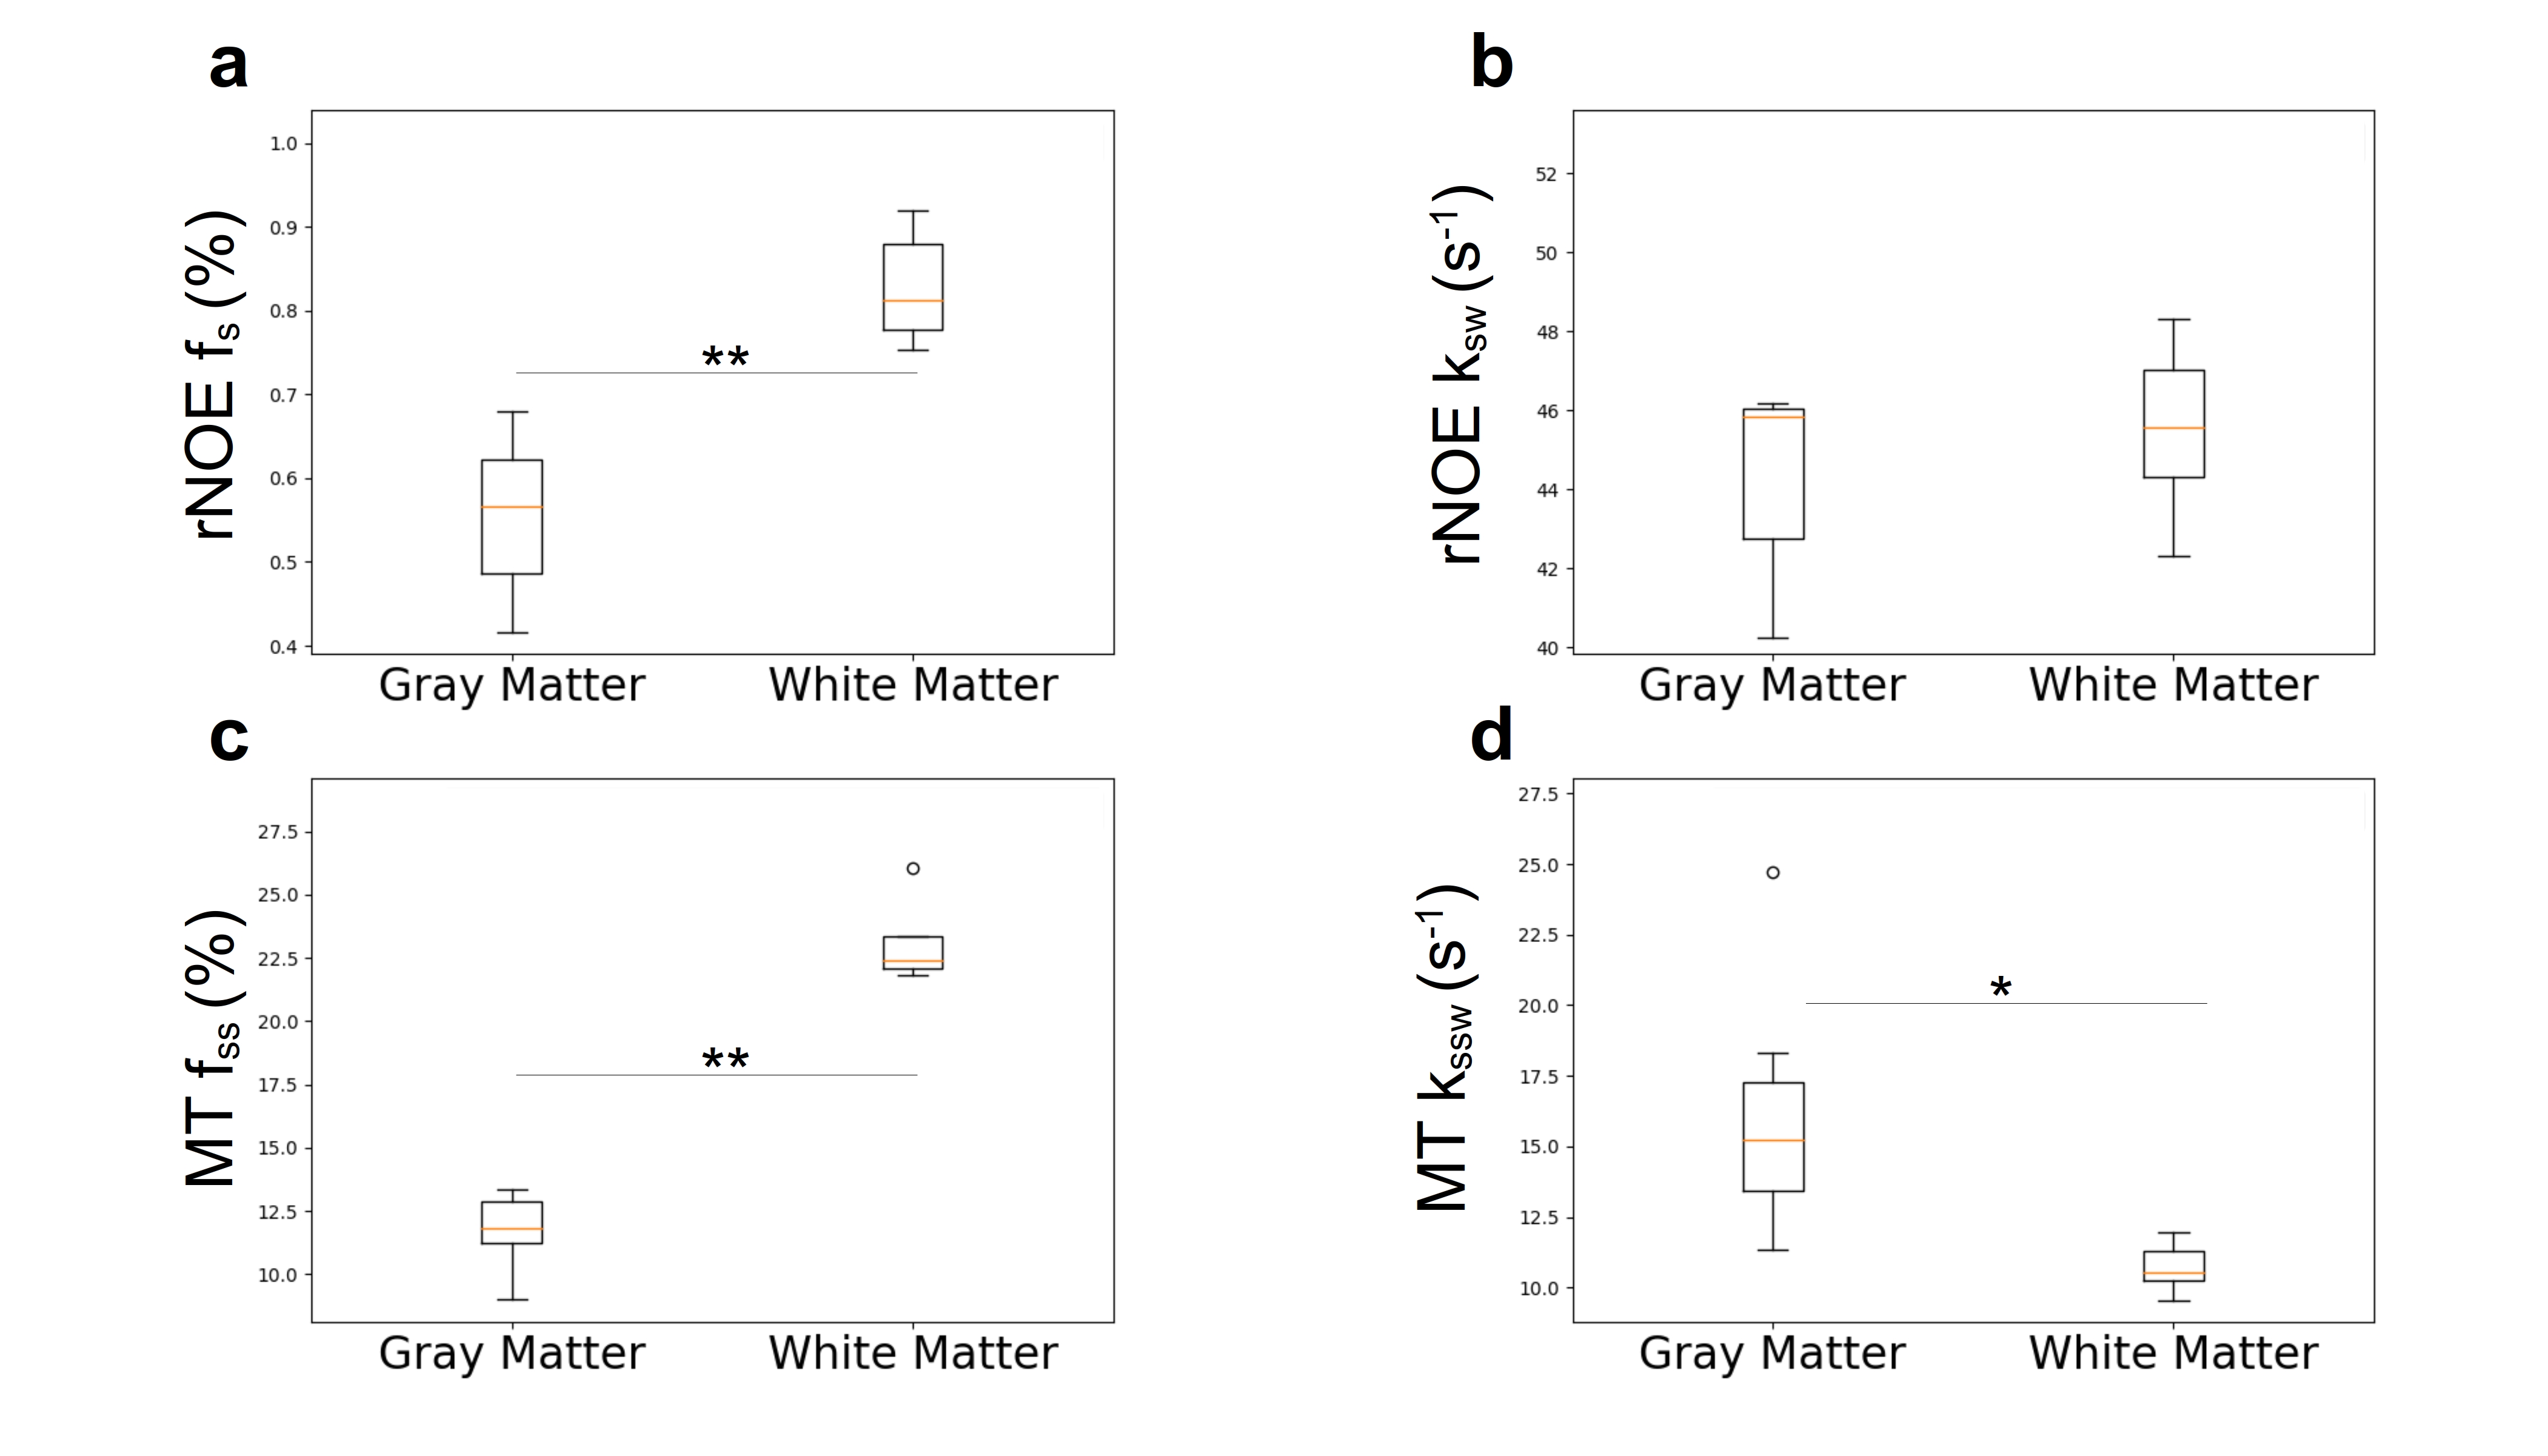
Representative quantitative images from the simultaneous quantification of brain rNOE and semisolid MT exchange parameters are shown in Fig. 4. The rNOE and the semisolid MT proton volume fractions (fs and fss, respectively) were significantly higher in the white matter compared to the gray matter (p<0.01), with quantitative values (Fig. 5) comparable to previous literature11-14. The semisolid MT proton exchange rates were significantly higher in the gray matter (p<0.05) compared to the white matter, as expected, yet slightly lower than previous reports15. While the dot-product reconstruction yielded several noisy pixels, these effects are expected to be mitigated by incorporating neural-network-based reconstruction, as previously reported in CEST-MRF8.
Conclusion
A quantitative molecular MR-Fingerprinting method was developed, providing a noninvasive and rapid means for simultaneously extracting rNOE and semisolid MT proton exchange parameter maps in-vivo. These bias-dismantled maps are expected to become beneficial for cancer, stroke, and spinal cord characterization.Acknowledgements
This project received funding from the European Research Council under the Horizon Europe program (grant agreement no. 101115639), the Ministry of Innovation, Science and Technology, Israel, and a Tel Aviv University Center for AI and Data Science (TAD) grant.References
1. Zaiss, Moritz, et al. "Relaxation-compensated CEST-MRI of the human brain at 7 T: unbiased insight into NOE and amide signal changes in human glioblastoma." Neuroimage 112 (2015): 180-188.
2. Zhou, Yang, et al. "Magnetic resonance imaging of glycogen using its magnetic coupling with water." Proceedings of the National Academy of Sciences 117.6 (2020): 3144-3149.
3. Wang, Feng, et al. "Sensitivity and specificity of CEST and NOE MRI in injured spinal cord in monkeys." NeuroImage: Clinical 30 (2021): 102633.
4. Huang, Jianpan, et al. "Relayed nuclear Overhauser enhancement imaging with magnetization transfer contrast suppression at 3 T." Magnetic Resonance in Medicine 85.1 (2021): 254-267.
5. Desmond, Kimberly L., Firas Moosvi, and Greg J. Stanisz. "Mapping of amide, amine, and aliphatic peaks in the CEST spectra of murine xenografts at 7 T." Magnetic Resonance in Medicine 71.5 (2014): 1841-1853.
6. Ma, Dan, et al. "Magnetic resonance fingerprinting." Nature 495.7440 (2013): 187-192.
7. Cohen, Ouri, et al. "Rapid and quantitative chemical exchange saturation transfer (CEST) imaging with magnetic resonance fingerprinting (MRF)." Magnetic Resonance in Medicine 80.6 (2018): 2449-2463.
8. Perlman, Or, et al. "Quantitative imaging of apoptosis following oncolytic virotherapy by magnetic resonance fingerprinting aided by deep learning." Nature Biomedical Engineering 6.5 (2022): 648-657.
9. Perlman, Or, Christian T. Farrar, and Hye‐Young Heo. "MR fingerprinting for semisolid magnetization transfer and chemical exchange saturation transfer quantification." NMR in Biomedicine 36.6 (2023): e4710.
10. Herz, Kai, et al. "Pulseq‐CEST: Towards multi‐site multi‐vendor compatibility and reproducibility of CEST experiments using an open‐source sequence standard." Magnetic Resonance in Medicine 86.4 (2021): 1845-1858.
11. Liu, Dapeng, et al. "Quantitative characterization of nuclear overhauser enhancement and amide proton transfer effects in the human brain at 7 tesla." Magnetic Resonance in Medicine 70.4 (2013): 1070-1081.
12. Van Zijl, Peter CM, et al. "Magnetization transfer contrast and chemical exchange saturation transfer MRI. Features and analysis of the field-dependent saturation spectrum." Neuroimage 168 (2018): 222-241.
13. van Gelderen, Peter, Xu Jiang, and Jeff H. Duyn. "Rapid measurement of brain macromolecular proton fraction with transient saturation transfer MRI." Magnetic Resonance in Medicine 77.6 (2017): 2174-2185.
14. Perlman, Or, et al. "An end‐to‐end AI‐based framework for automated discovery of rapid CEST/MT MRI acquisition protocols and molecular parameter quantification (AutoCEST)." Magnetic Resonance in Medicine 87.6 (2022): 2792-2810.
15. Stanisz, Greg J., et al. "T1, T2 relaxation and magnetization transfer in tissue at 3T." Magnetic Resonance in Medicine 54.3 (2005): 507-512.
Figures