1089
Fast, motion-robust CEST imaging with inherent B0 correction using rosette trajectories1Russell H. Morgan Department of Radiology and Radiological Science, The Johns Hopkins University School of Medicine, Baltimore, MD, United States
Synopsis
Keywords: CEST / APT / NOE, CEST & MT
Motivation: CEST-MRI typically requires a long scan time and an additional B0 map scan for inhomogeneity correction.
Goal(s): To implement a rosette readout for fast CEST imaging with improved robustness to bulk-motion and inherent correction of B0 inhomogeneity.
Approach: Rosette trajectories which sample more densely near the k-space center provided faster and more motion-robust CEST imaging than Cartesian trajectories. B0 inhomogeneities were estimated using the phase difference between two images from two halves of the rosette lobe and corrected subsequently.
Results: Rosette trajectories significantly reduced the CEST imaging time. No extra scans were needed for B0 correction due to the inherent B0 mapping capability.
Impact: Fast, motion-robust, and inherent B0-corrected CEST imaging with rosette trajectories can help improve patient comfort and compliance. The work is expected to significantly accelerate the translation of CEST-MRI into a robust clinically viable approach.
INTRODUCTION
The clinical applications of CEST-MRI are very promising, for example, amide proton transfer (APT) imaging has been shown as a biomarker of brain tumor and ischemic stroke status1-5. However, a major limitation for routine clinical use is the requirement to add another scan to the already long clinical protocol. For conventional CEST imaging, the long scan time required due to the use of multiple saturation frequencies and multiple acquisitions is vulnerable to motion artifacts. Furthermore, the acquisition of an independent B0 map for inhomogeneity correction requires additional imaging time. Herein, rosette readout trajectories were designed and implemented in the CEST sequence. Compared to Cartesian trajectories, this is faster and more robust to bulk-motion artifacts due to repeated sampling near the center of the k-space6, 7. The rosette pattern crosses the k-space center multiple times in one shot, which can be segmented into multiple echoes, thus, enabling B0 mapping. The rosette-CEST imaging was evaluated against fully sampled Cartesian trajectories and demonstrated on CEST phantoms and healthy volunteers.METHODS
The rosette trajectory oscillates around the k-space center with angular-frequency ω1=2πf1 in the radial direction simultaneously rotating in the kx-ky plane with angular-frequency ω2=2πf2. The k-space trajectory is given by6-8$$k(t)=k_{m}sin(\omega_{1}t)e^{i\omega_{2}t}$$
where km=Nx/(2.FOV) is the maximum spatial frequency, FOV is the field of view, and Nx is the matrix size. The corresponding gradient was calculated by $$$G(t)=\frac{2\pi}{\gamma}\frac{\text{d}k(t)}{\text{d}t}$$$, where γ=1H gyromagnetic ratio7, 9. The rosette-CEST sequence consists of RF saturation preparation, fat suppression, and rosette sampling, as shown in Fig. 1. The RF saturation module consists of twenty 100-ms long rectangular pulses with 6-ms gaps. 5-ms long crusher gradients were executed during the gaps. The relaxation delay (Td) was 2s. All the experiments were performed using a 3T MRI scanner (Magnetom Prisma, Siemens, Erlangen, Germany). The maximum gradient and slew rate of the scanner were 80mT/m and 200T/m/s. The rosette-CEST sequence was tested on 10% cross-linked bovine serum albumin (BSA) in phosphate buffer solution (PBS) containing creatine (Cr) concentrations ranging from 50 to 100mM and pH ranging from 6 to 7. Sixty-five saturated images (Ssat) were acquired from -20 to 20ppm with B1 of 0.5 and 1.5μT in addition to one unsaturated image (S0).
Two healthy subjects participated in the study after obtaining informed consent according to IRB requirements. For in-vivo studies, rosette-CEST images were acquired with frequency offsets from -8 to 8ppm, and B1 of 1 and 2μT. Other rosette acquisition parameters were: FOV=256×256mm2, Nx=128, slice-thickness=4mm, slices=10, flip-angle=10°, f1=3500Hz, f2=4500Hz, shots=100, sampling-time=2μs, TE=1.04ms, and TR=4.58s. Rosette images were reconstructed using gridding and compressed sensing9. As the rosette trajectory crosses the k-space center twice for each shot, two low-resolution images with two echo times were generated from a single acquisition (Fig. 2A), and their phases were used to estimate the B0 map. For comparison, a B0 map was acquired using the conventional dual-echo Cartesian GRE sequence with TE1/TE2/TR=4.92/9.84/29ms. Magnetization transfer ratio asymmetry (MTRasym) was calculated for CEST measurement.
RESULTS AND DISCUSSION
The maximum gradient and slew rate for the rosette trajectory were 30.6mT/m and 190.8T/m/ms. Fig. 2B shows the comparison of B0 maps between rosette and dual-echo GRE acquisitions. Accurate B0 estimation was achieved during rosette-CEST acquisition and no image registration between CEST images and B0 maps was needed for B0 correction. The Bland-Altman analysis showed that the bias was negligible (mean difference of 0.01 and limits of agreement (±1.96SD) of +1.31 and -1.63) (Fig. 2C). Fig. 3 compares in-vivo brain images under Cartesian full k-space and rosette acquisitions. Accurate rosette-accelerated imaging was achieved with great image quality (3.2 vs 7.7s for rosette and full k-space reference, respectively). Fig. 4 shows Z-spectra and MTRasym curves of the cross-linked BSA/Cr phantom with guanidinium proton CEST signal around 2ppm using the rosette-CEST sequence. As expected, the CEST signals were correlated with Cr concentrations and increased with B1 due to improved saturation efficiency. In in-vivo study (Fig. 5), the acquired Z-spectra, particularly in white matter, were asymmetric around water resonance-frequency, with lower signal intensities at the negative frequency offsets and clearly showed APT peaks, particularly in gray matter. The MTRasym(3.5ppm) images at 1µT were negative due to higher rNOE at -3.5ppm compared to the downfield APT signals.CONCLUSION
The imaging time for rosette-CEST with a whole-brain coverage (inferior-superior FOV of 140mm) was 4.58s per saturation frequency offset (including 2s RF saturation) at the spatial resolution of 2x2x4mm3. Rosette-CEST saved additional imaging time due to inherent B0 estimation. Additionally, rosette-CEST is less sensitive to motion due to the frequent sampling of the k-space center and potentially has a wide range of clinical applications.Acknowledgements
This work was supported in part by grants from the National Institutes of Health (NIH).
References
1. van Zijl PCM, Lam WW, Xu J, Knutsson L, Stanisz GJ. Magnetization Transfer Contrast and Chemical Exchange Saturation Transfer MRI. Features and analysis of the field-dependent saturation spectrum. Neuroimage 2018;168:222-241.
2. Zhou J, Heo HY, Knutsson L, van Zijl PCM, Jiang S. APT-weighted MRI: Techniques, current neuro applications, and challenging issues. J Magn Reson Imaging 2019;50:347-364.
3. Heo HY, Tee YK, Harston G, Leigh R, Chappell MA. Amide proton transfer imaging in stroke. NMR Biomed 2022:e4734.
4. Zaiss M, Windschuh J, Goerke S, Paech D, Meissner JE, Burth S, Kickingereder P, Wick W, Bendszus M, Schlemmer HP, Ladd ME, Bachert P, Radbruch A. Downfield-NOE-suppressed amide-CEST-MRI at 7 Tesla provides a unique contrast in human glioblastoma. Magn Reson Med 2017;77:196-208.
5. Zhou J, Zaiss M, Knutsson L, Sun PZ, Ahn SS, Aime S, Bachert P, Blakeley JO, Cai K, Chappell MA, Chen M, Gochberg DF, Goerke S, Heo HY, Jiang S, Jin T, Kim SG, Laterra J, Paech D, Pagel MD, Park JE, Reddy R, Sakata A, Sartoretti-Schefer S, Sherry AD, Smith SA, Stanisz GJ, Sundgren PC, Togao O, Vandsburger M, Wen Z, Wu Y, Zhang Y, Zhu W, Zu Z, van Zijl PCM. Review and consensus recommendations on clinical APT-weighted imaging approaches at 3T: Application to brain tumors. Magn Reson Med 2022;88:546-574.
6. Noll DC. Multishot rosette trajectories for spectrally selective MR imaging. IEEE Trans Med Imaging 1997;16:372-377.
7. Mahmud SZ, Denney TS, Bashir A. High-resolution proton metabolic mapping of the human brain at 7 T using free induction decay rosette spectroscopic imaging. NMR Biomed 2023:e5042.
8. Schirda CV, Tanase C, Boada FE. Rosette spectroscopic imaging: optimal parameters for alias-free, high sensitivity spectroscopic imaging. J Magn Reson Imaging 2009;29:1375-1385.
9. Mahmud SZ, Denney TS, Bashir A. Feasibility of spinal cord imaging at 7 T using rosette trajectory with magnetization transfer preparation and compressed sensing. Sci Rep 2023;13:8777.
Figures
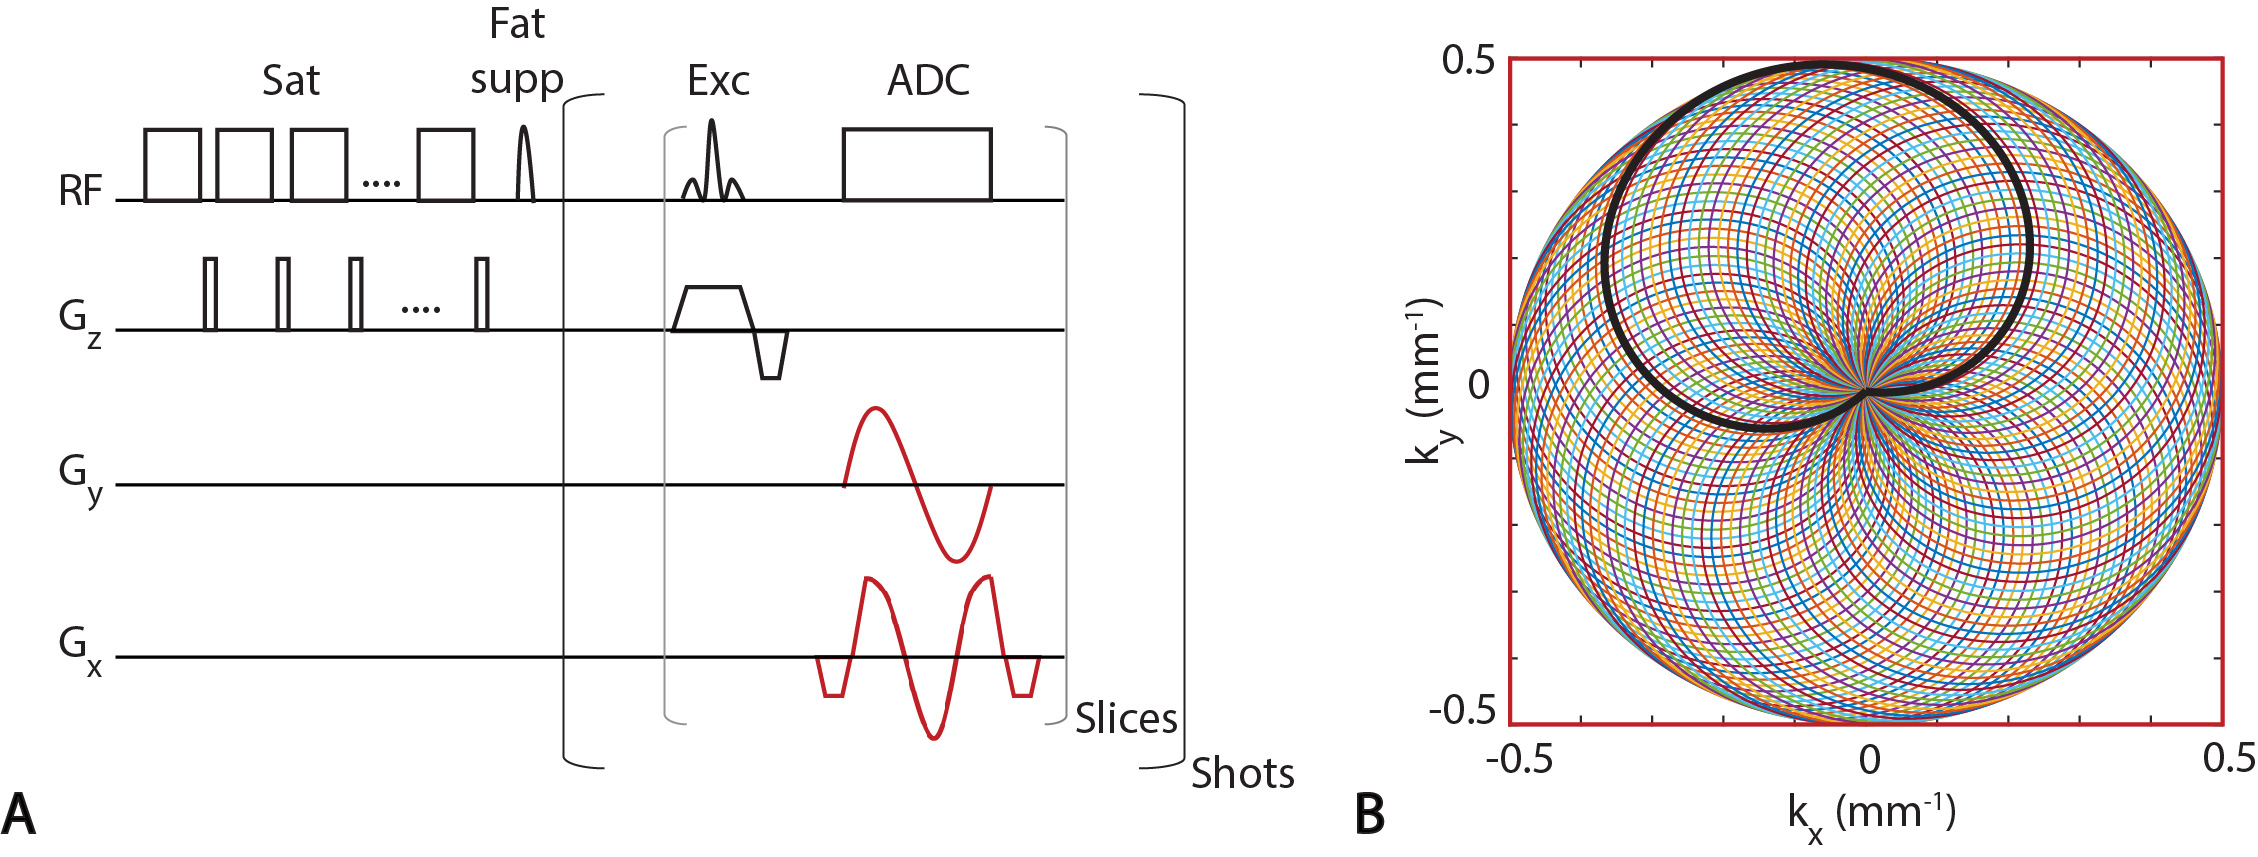
Figure 1: (A) Sequence diagram of CEST imaging with rosette trajectories. The sequence consists of twenty rectangular pulses (100 ms each), each followed by a crusher gradient (5 ms duration and 15 mT/m strength), and a fat suppression pulse. Slice selection was followed by rosette gradients to acquire the first shots in each slice. This was repeated to acquire all the shots to fill up the k-space. The corresponding rosette k-space trajectories are shown in (B), where the bold black line represents the k-space trajectory for a single shot.
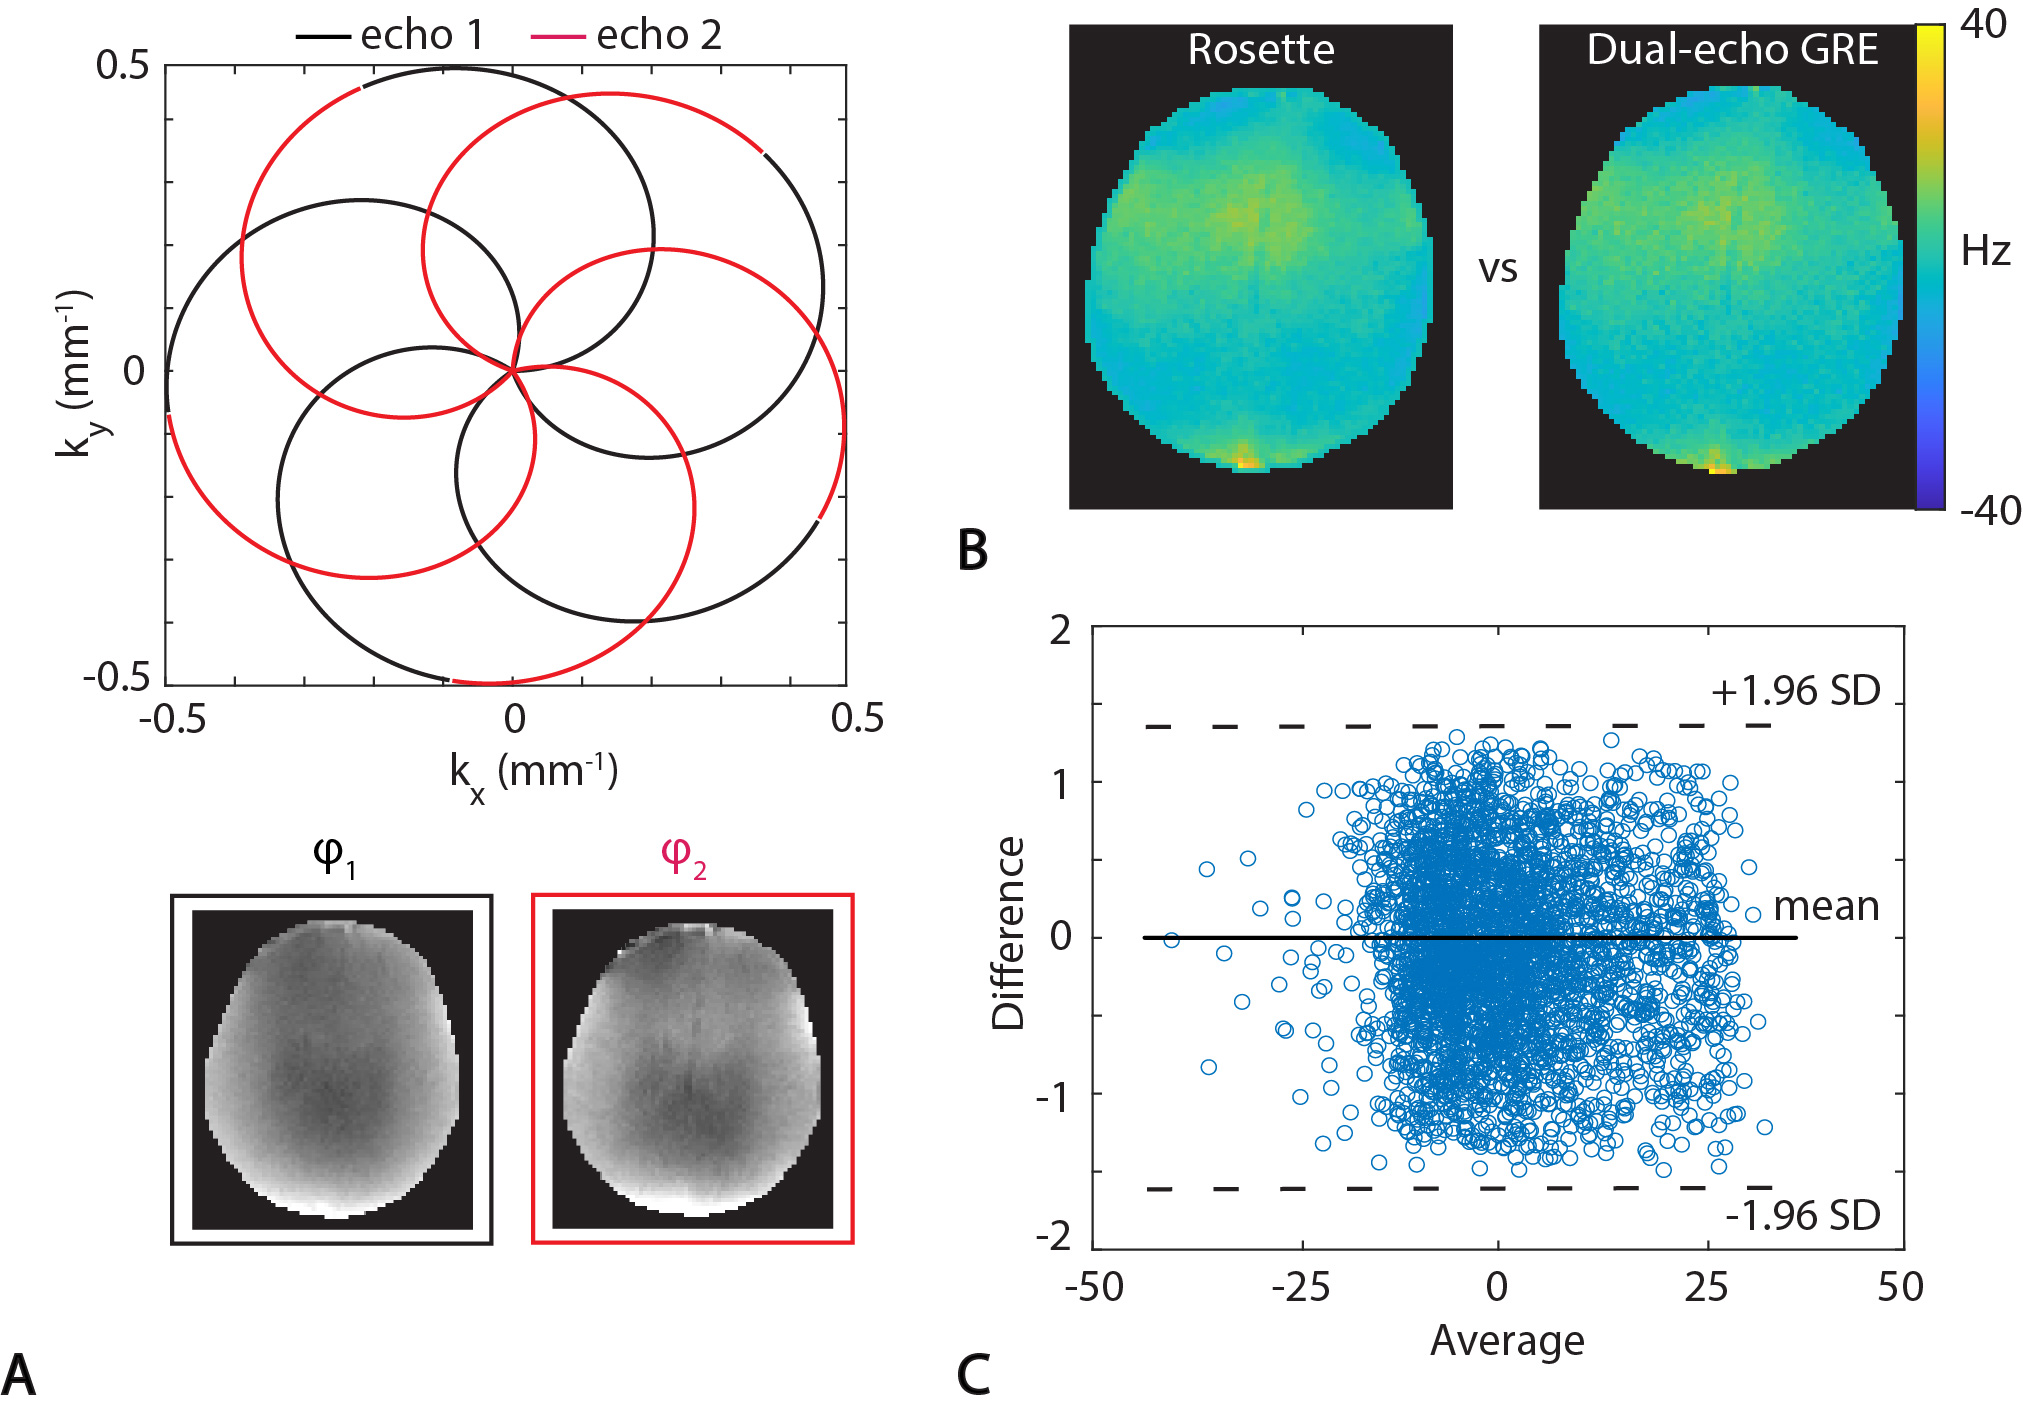
Figure 2: Estimation of the B0 map from a rosette-CEST itself. (A) As the rosette sampling pattern crosses the center of the k-space twice for each shot, a single lobe can be segmented into two halves to generate low-resolution dual-echo images (black and red lines for echo 1 and echo 2, respectively). Here, only five shots are shown for clarity. (B) With phase information (ϕ1 and ϕ2) of the dual-echo images, a B0 map was estimated and compared with the B0 map from a conventional dual-echo Cartesian GRE acquisition. (C) Bland-Altman analysis between two estimated B0 maps shows good agreement.
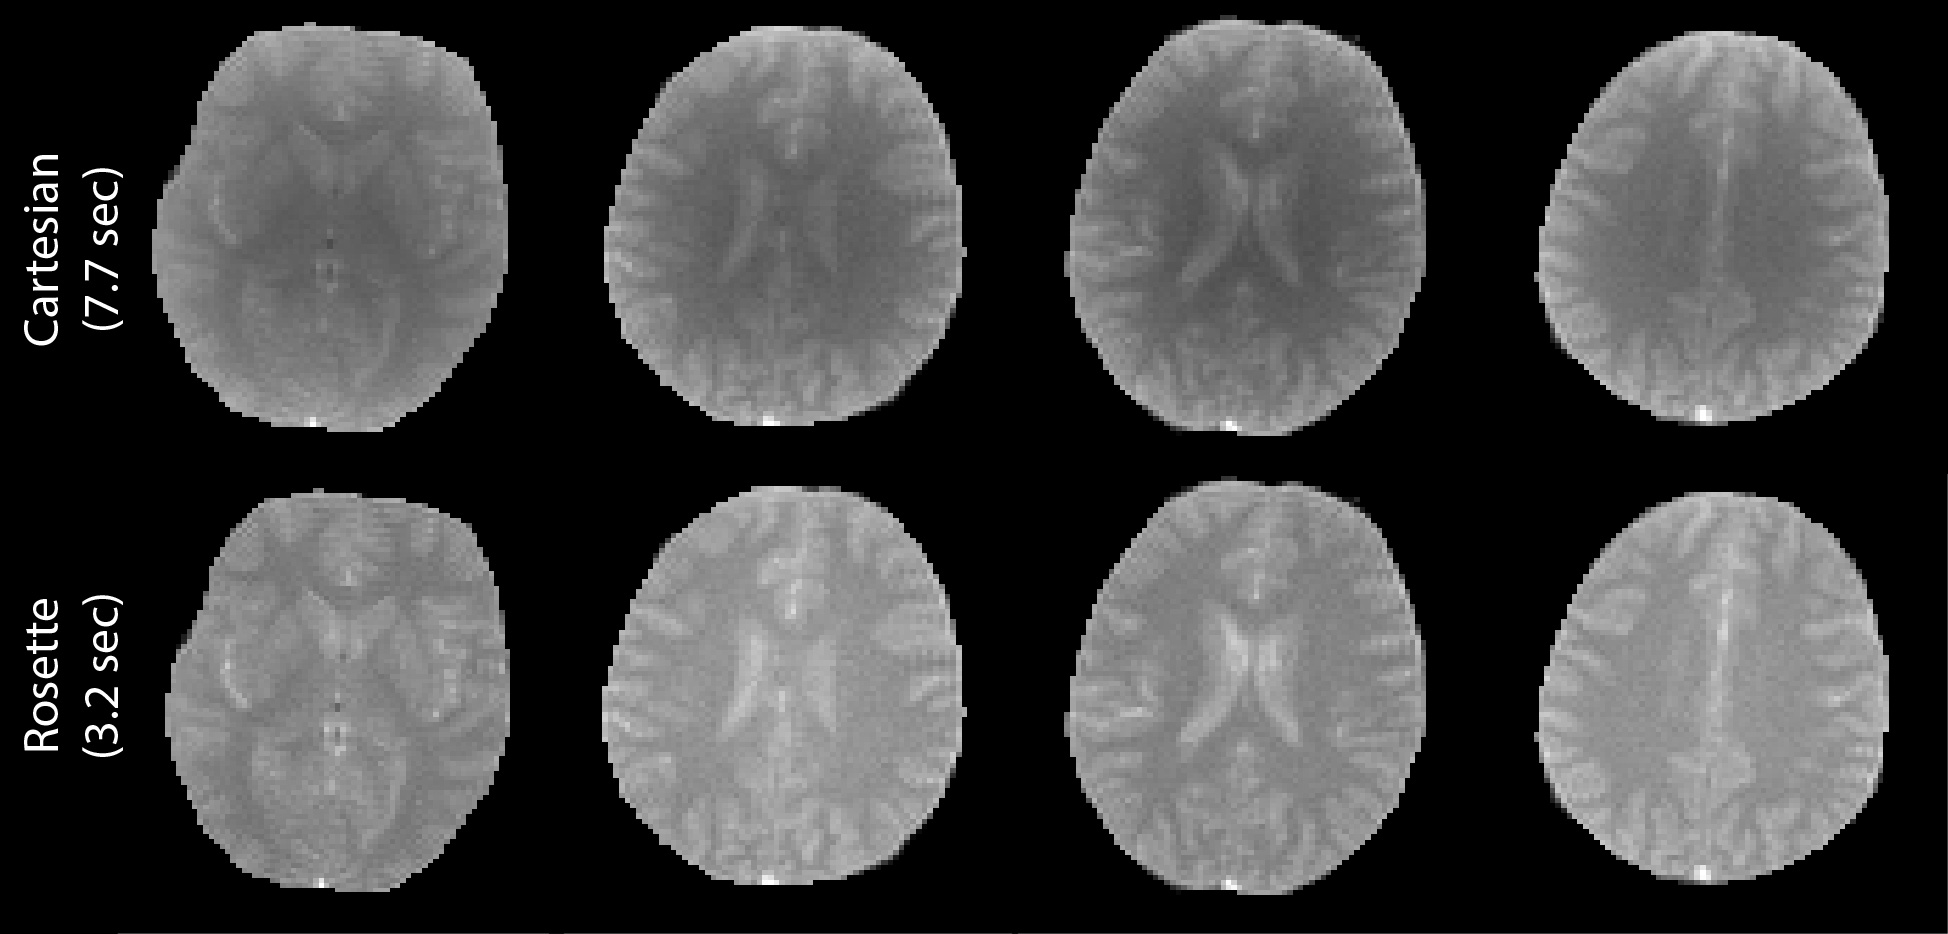
Figure 3: Comparison of the images acquired with rosette trajectory and conventional fully-sampled Cartesian trajectory (fast low-angle shot, FLASH) from the same subject with the same FOV, in-plane resolution, slice-thickness, and total number of slices. The rosette-CEST imaging speeded up image acquisition by over 2x with great image quality (SNR=81±15 vs 59±17 for rosette vs Cartesian, respectively).
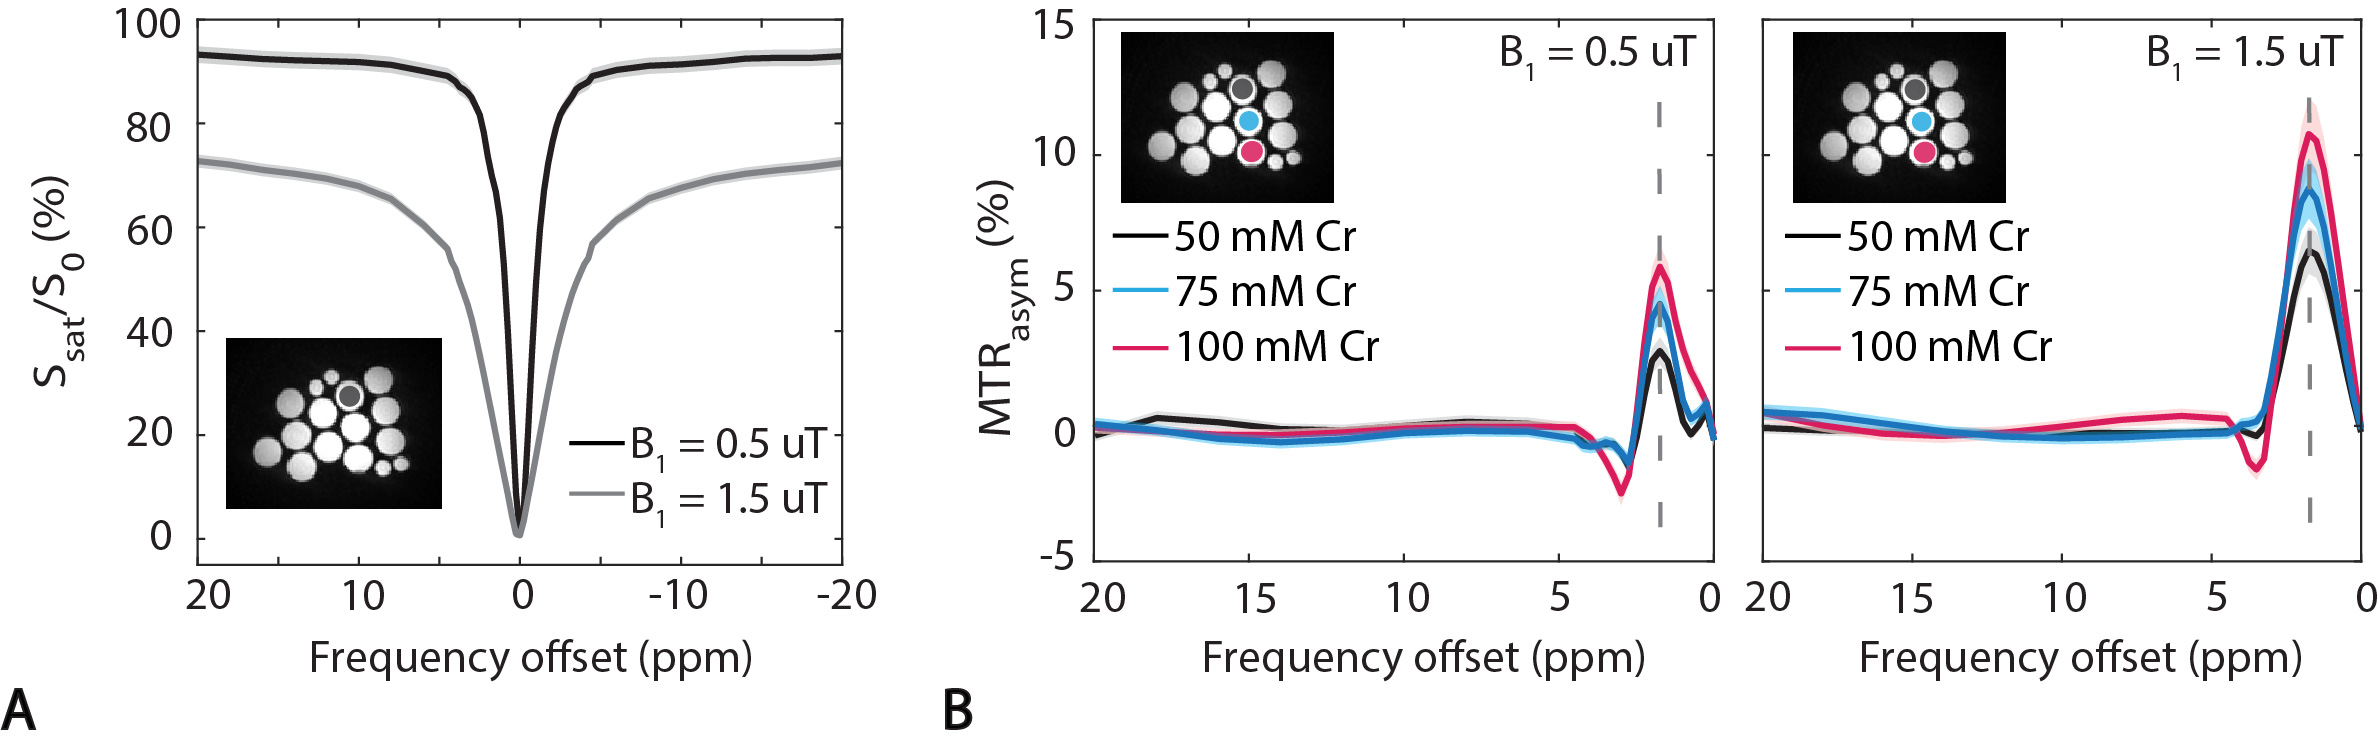
Figure 4: Cross-linked BSA and PBS/Cr phantom experiments. (A) Measured Z-spectra of 50 mM Cr concentration acquired at B1 of 0.5 and 1.5 µT. (B) MTRasym plots for Cr concentrations ranging from 50-100 mM at pH = 6.8.
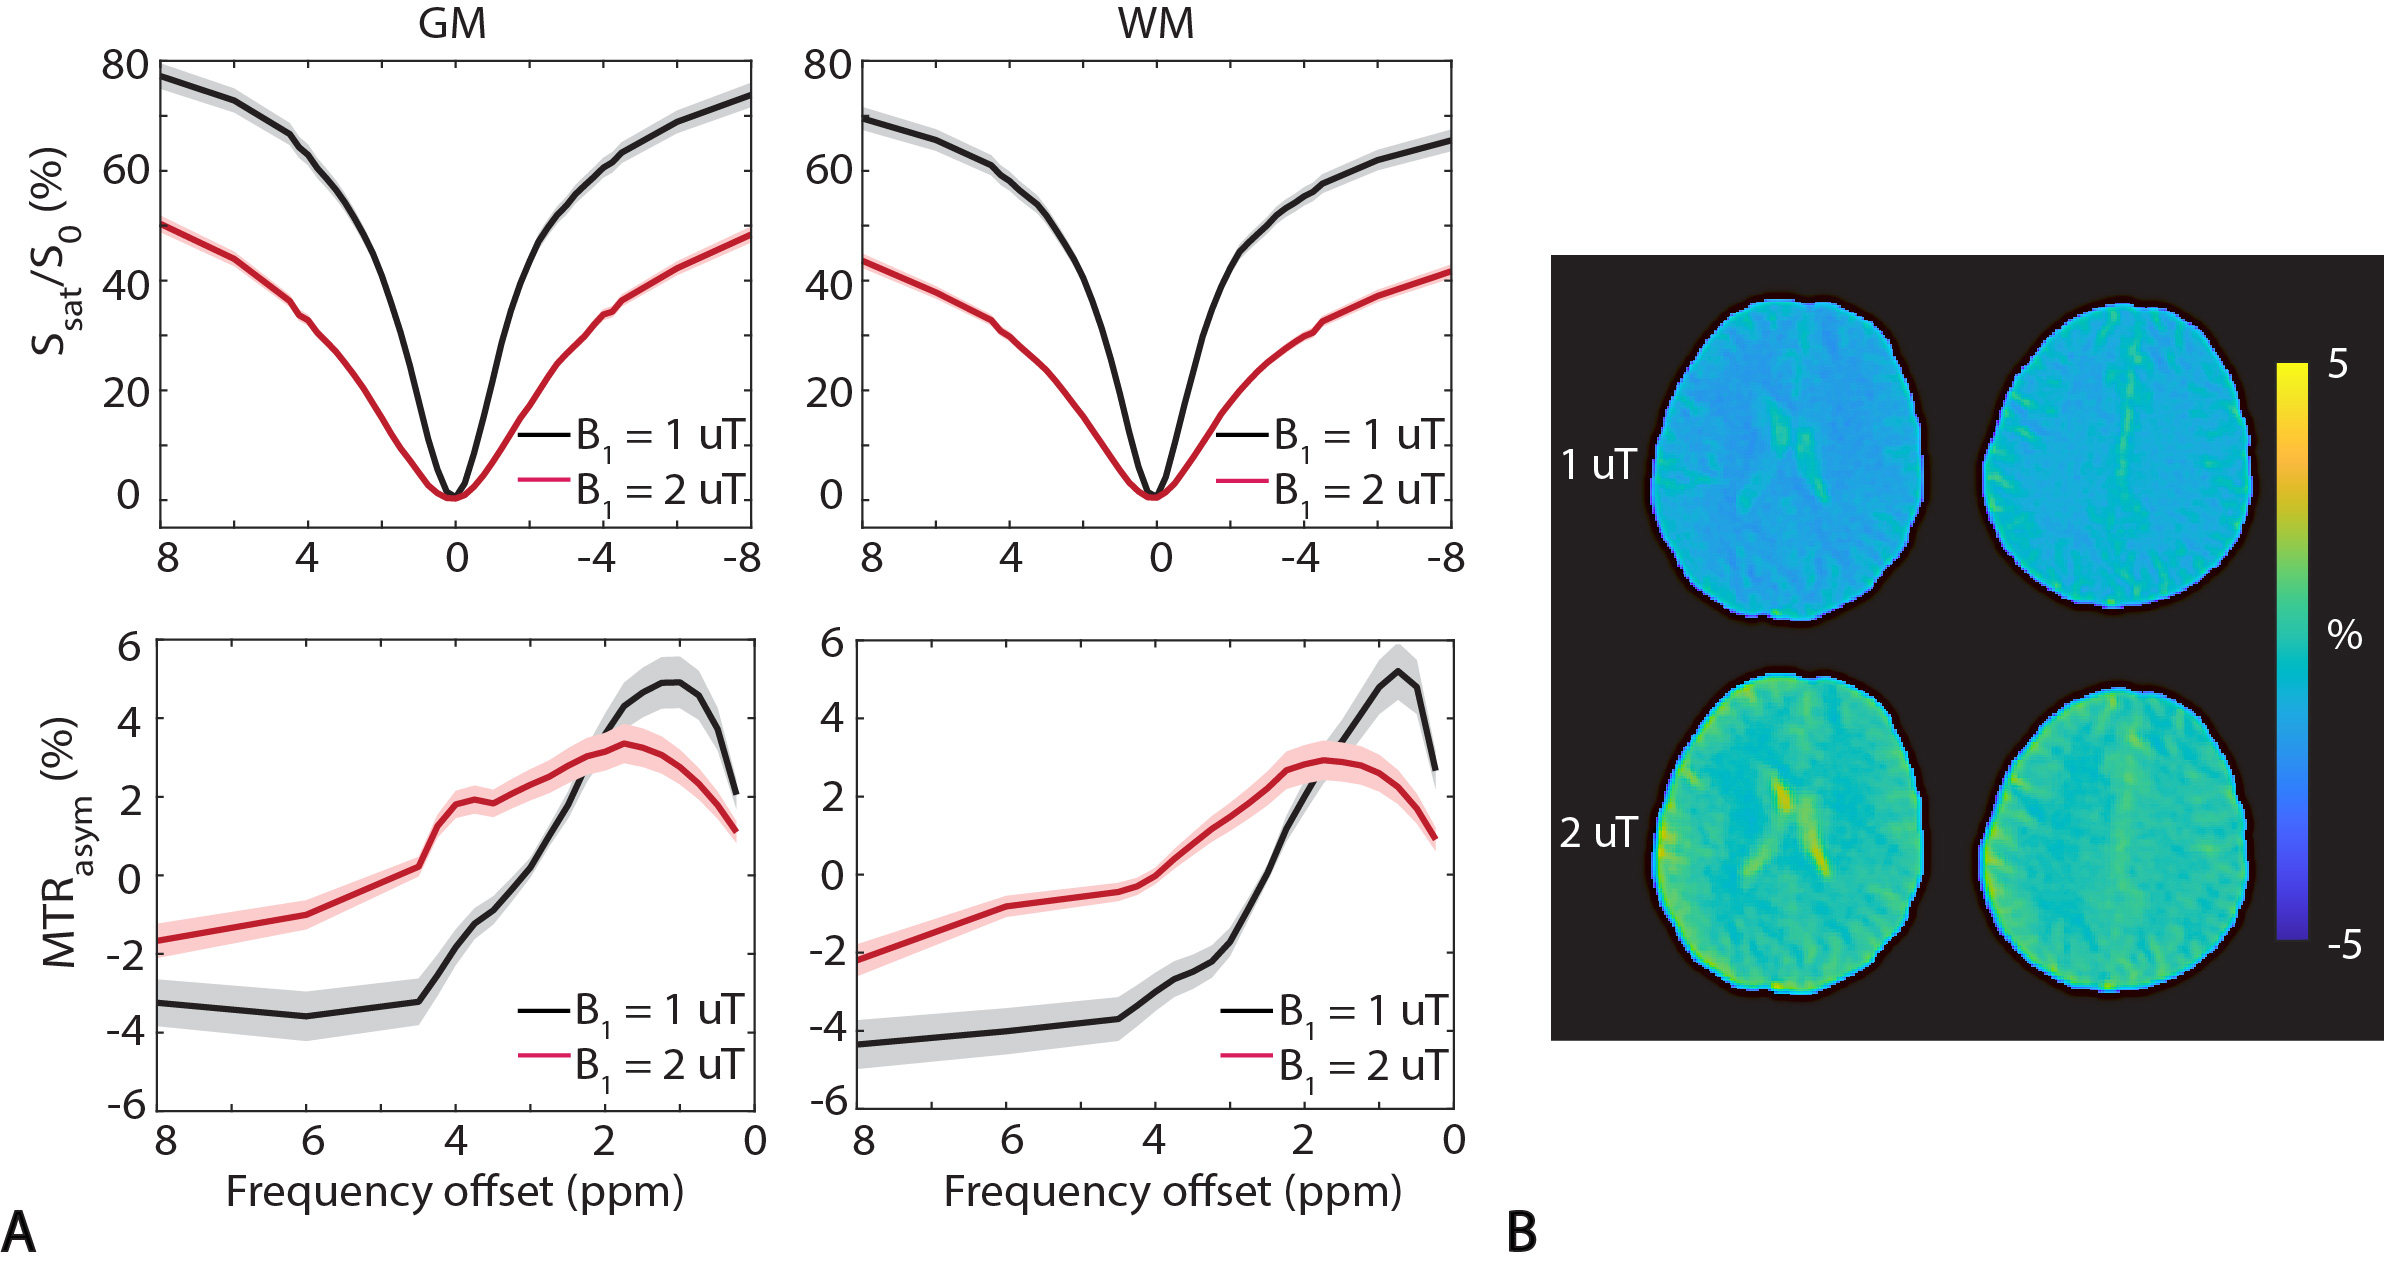
Figure 5: In-vivo healthy volunteer studies. (A) The average measured Z-spectra and corresponding MTRasym curves from gray matter and white matter. Note that shaded error bars depict standard deviations. (B) APTw maps (MTRasym at 3.5 ppm) at different B1 values.