1086
Non-invasive mapping of brown adipose tissue activity with MRI1Department of Radiology, Guangdong Provincial People’s Hospital (Guangdong Academy of Medical Sciences), Southern Medical University, Guangzhou, China, 2Guangdong Provincial Key Laboratory of Artificial Intelligence in Medical Image Analysis and Application, Guangzhou, China, 3Department of Radiology, Guangzhou Women and Children's Medical Center, Guangzhou Medical University, Guangdong Provincial Clinical Research Center for Child Health, Guangzhou, China, 4School of Biomedical Engineering, Southern Medical University, Guangzhou, China, 5Guangdong Provincial Key Laboratory of Medical Image Processing & Guangdong Province Engineering Laboratory for Medical Imaging and Diagnostic Technology, Southern Medical University, Guangzhou, China, 6Guangdong-Hong Kong-Macao Greater Bay Area Center for Brain Science and Brain-Inspired Intelligence & Key Laboratory of Mental Health of the Ministry of Education, Southern Medical University, Guangzhou, China, 7Philips Healthcare (Shenzhen) Ltd, Shenzhen, China, 8Physiology and Biophysics Department, University of Illinois at Chicago, Chicago, IL, United States, 9Rosalind & Morris Goodman Cancer Institute, McGill University, Montreal, QC, Canada, 10Department of Biochemistry, McGill University, Montreal, QC, Canada, 11Diabetes, Endocrinology, and Obesity Branch, Intramural Research Program, National Institute of Diabetes and Digestive and Kidney Diseases (NIDDK), Bethesda, MD, United States, 12Radiology Department, University of Illinois at Chicago, Chicago, IL, United States, 13Biomedical Engineering Department, University of llinois at Chicago, Chicago, IL, United States
Synopsis
Keywords: CEST / APT / NOE, Metabolism
Motivation: Through non-shivering thermogenesis, brown adipose tissue (BAT) plays a critical and beneficial role in obesity and metabolic diseases.
Goal(s): In this study, we developed non-invasive creatine CEST (CrCEST) MRI of adipose tissues for mapping BAT activity in both rodents and humans given to creatine’s important role in bioenergetics.
Approach: We observed by CrCEST MRI that the changes in BAT activity in rats and human after drug administration and/or cold exposure were in good agreement with traditional 18F-FDG PET/CT imaging.
Results: The results of this study demonstrated CrCEST MRI as an endogenous, non-invasive, and radiation-free method for in vivo mapping of BAT activity.
Impact: In this study, endogenous CrCEST MRI of adipose tissues was developed and found to serve as an imaging biomarker for BAT activity, the diagnosis of metabolic diseases, and the evaluation of new therapeutic strategies in a longitudinal and non-invasive means.
Introduction
The role of brown adipose tissue (BAT) plays in obesity and metabolic diseases makes its detection particularly important. Currently, 18F-fluorodeoxyglucose positron emission tomography/computed tomography (18F-FDG PET/CT) is the most commonly used method for detecting and quantifying BAT metabolic activity in humans1. However, radiation exposure and the pharmacodynamic profile of PET tracers limit the use of PET/CT in longitudinal imaging. Other innovative and promising approaches, such as multiple quantum coherence2 and hyperpolarized Xeon gas imaging3, face challenges including low signal-to-noise ratio, the requirement for exogenous contrast agents, limited specificity, and/or the need for special instruments. On the other hand, magnetic resonance imaging (MRI) has the advantages of no ionizing radiation and superb soft-tissue contrast, which makes it an ideal imaging technique for repeated evaluation or longitudinal studies of BAT4. Most currently available MRI techniques are designed for studying structural information of adipose tissues, such as Dixon’s MRI used for mapping fat water fraction. There is no endogenous MRI that is sensitive to the metabolic function of adipose tissues. Because of the important role of creatine in energy metabolism and the creatine-dependent ADP/ATP substrate cycling is an important thermogenic pathway in BAT5, in this study, we attempted to quantify the creatine levels by CrCEST MRI to reflect the metabolic activity of BAT.Methods
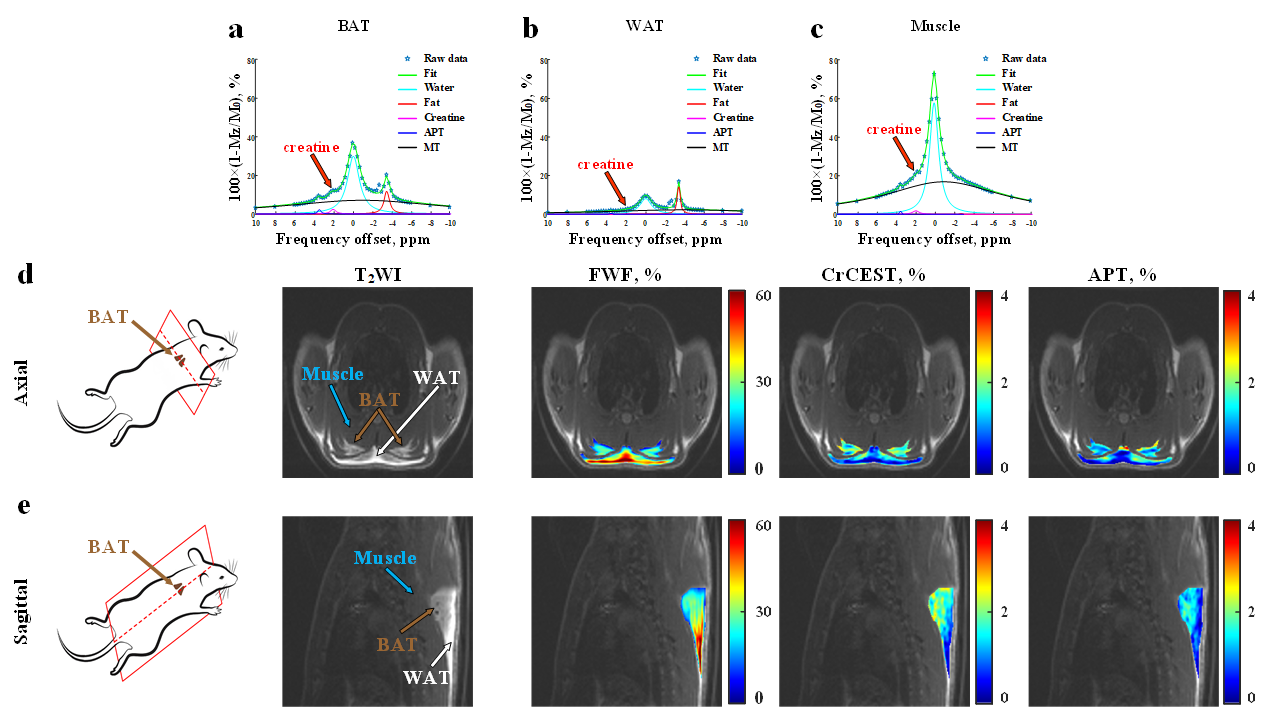
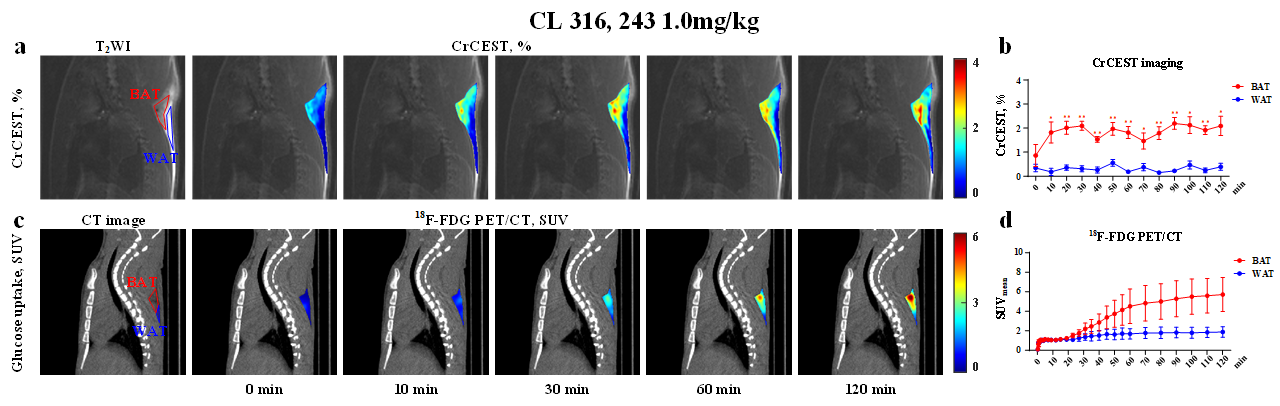
Rat and human MRI data were acquired on a 7T small-bore MRI and 3T whole-body MRI scanner, respectively. CrCEST data were collected by a CEST sequence with a pre-saturation pulse of 1.0μt for 3s duration, at a frequency range within ±10ppm and followed by a RARE (Rapid Acquisition with Relaxation Enhancement) readout. Z-spectral data were fitted to a multi-Lorentzian model to separately quantify the fat, water, CrCEST, amide proton transfer (APT) and the semi-solid magnetic transfer (MT) effect from tissues. The amplitudes of the fitted water and fat peaks were used to evaluate the fat-water fraction (FWF) map. Rat and human 18F-FDG PET/CT data were acquired on a Micro-PET/CT and Biograph mCT Flow 64 PET/CT system, respectively. Both CrCEST and PET/CT imaging were used to visualize the dynamic changes in BAT activity in rats for up to 120 mins post the administration of CL 316, 243 (1.0mg/kg, a specific drug for BAT adrenergic activation), as well as in rats and humans after 2 hours of cold exposure.Results
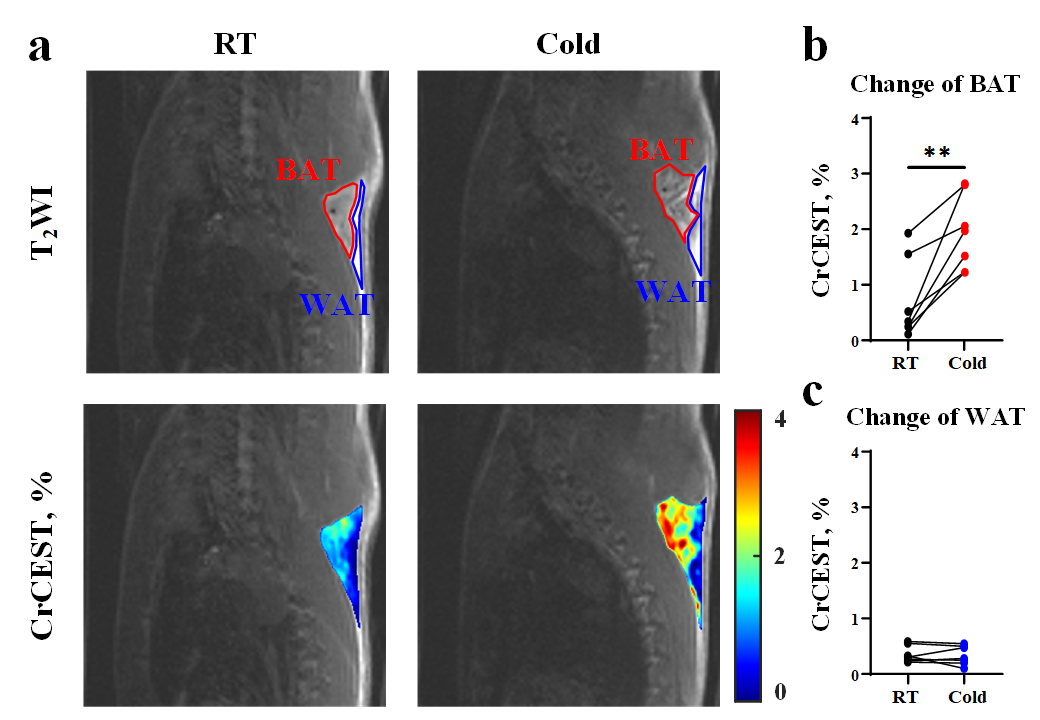
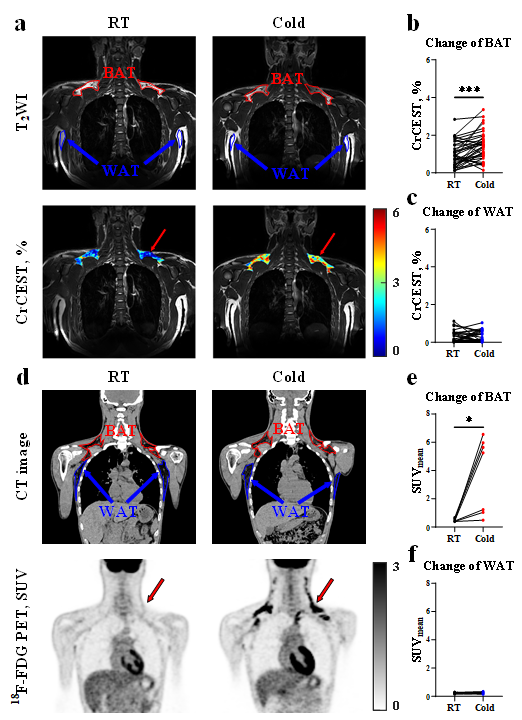
We consistently observed CrCEST peak at ~2.0 ppm and APT CEST peak at 3.5 ppm in the Z-spectra of BAT. Compared with BAT, WAT had a lower water signal (Fig.1a, b) and muscle tissue had a higher water signal (Fig.1c) as expected. BAT had higher Cr and APT CEST signals than WAT (Fig.1d, e). Increased CrCEST and PET/CT signals were observed in rat BAT during both CL 316, 243 stimulation and cold exposure experiments (Fig.2, 3). In clinical 3T MRI, CrCEST can also observe the increase of CrCEST signal in BAT after cold exposure for 2 hours, which is consistent with the results of PET/CT (Fig.4).Conclusion
In summary, we demonstrated the feasibility of the endogenous metabolic CrCEST MRI technique in mapping BAT activity in rodents and humans, showing great consistency to PET/CT imaging. Endogenous CrCEST MRI may provide molecular insight into the pathogenesis, help for the early detection and risk-stratification, and serve as a biomarker for developing, evaluating, and guiding new therapeutic strategies for metabolic diseases, in a longitudinal and non-invasive means, greatly reducing the social-economical cost due to obesity and other metabolic diseases.Acknowledgements
This work is supported by the NIH grant R01DK135772 and R01CA283548; the National Science Fund for Distinguished Young Scholars of China (No. 81925023); the Regional Innovation and Development Joint Fund of National Natural Science Foundation of China (No. U22A20345); the National Key R&D Program of China (No. 2021YFF1201003); the Key-Area Research and Development Program of Guangdong Province, China (No. 2021B0101420006, 2018B030340001, and 2018B030333001); the Guangdong Provincial Key Laboratory of Artificial Intelligence in Medical Image Analysis and Application (No. 2022B1212010011); the High-level Hospital Construction Project (No. DFJHBF202105); the National Natural Science Foundation of China (No. U21A6005).References
[1] Chen KY, Cypess AM, Laughlin MR, et al. Brown Adipose Reporting Criteria in Imaging STudies (BARCIST 1.0): Recommendations for Standardized FDG-PET/CT Experiments in Humans. Cell Metab. 2016;24(2):210-222.
[2] Branca RT, Warren WS. In vivo brown adipose tissue detection and characterization using water-lipid intermolecular zero-quantum coherences. Magn Reson Med. 2011;65(2):313-319.
[3] Branca RT, McCallister A, Yuan H, et al. Accurate quantification of brown adipose tissue mass by xenon-enhanced computed tomography. Proc Natl Acad Sci U S A. 2018;115(1):174-179.
[4] Chen YC, Cypess AM, Chen YC, et al. Measurement of human brown adipose tissue volume and activity using anatomic MR imaging and functional MR imaging. J Nucl Med. 2013;54(9):1584-1587.
[5] Kazak L, Chouchani ET, Jedrychowski MP, et al. A creatine-driven substrate cycle enhances energy expenditure and thermogenesis in beige fat. Cell. 2015;163(3):643-655.
Figures