1085
Non-invasive high-resolution in vivo pH mapping in brain tumors by 31P‑informed deepCEST MRI1Institute of Neuroradiology, Erlangen, Germany, 2Institute of Neuroradiology, Frankfurt am Main, Germany, 3Brain Imaging Center, Frankfurt am Main, Germany, 4Department Artificial Intelligence in Biomedical Engineering, Erlangen, Germany, 5Institute of Radiology, Erlangen, Germany, 6Max-Planck Institute for Biological Cybernetics, Tübingen, Germany
Synopsis
Keywords: CEST / APT / NOE, CEST & MT, Cancer, pH, CEST, 31P, Neuronal Network
Motivation: The pH value is an important biomarker for many diseases. MRI-based 3D pH mapping for clinical routine would be an enormous benefit for diagnostics.
Goal(s): Prediction of intracellular 31P-pHi maps from 1H APTw-CEST MRI data using a voxel-wise neural network, aiming to improve brain tumor imaging.
Approach: Fifteen glioblastoma patients underwent 3T MRI with both APTw-CEST and 31P-MRS. A neural network trained on 11 patients data to correlate APTw-CEST features with 31P-derived pHi values, tested on 4 additional patients.
Results: The neural network's pHi predictions closely matched 31P-pHi maps, showing potential for high-resolution, non-invasive pHi mapping in brain tumors.
Impact: High resolution pH imaging for better diagnosis of diseases (inflammation, stroke, tumor) and therapy monitoring in clinical routine.
Introduction
The prediction of the intracellular pH (pHi) plays an important role for e.g. inflammation processes, stroke or tumor imaging. The conventional method for pHi detection 31P-MRS however suffers from low resolution and long scan times. Already in its first description in vivo, 1H amide-proton transfer (APT) CEST imaging promised for pH-weighting1,2 on the basis of high SNR proton MRI providing the advantage of a higher spatial resolution and scan times below 2 minutes3. Such a 3D pH imaging is traded as the biggest promise or the holy grail of CEST MRI and highly for non-invasive characterization of different pathologies.Despite clear pHi-related changes of CEST signals in brain tissue4, previous comparison of 31P-pHi maps and 1H-APTw-CEST images did not show clear spatial correlation in brain tumors5,6. In the present work we aim to directly learn the 31P-pHi map from APTw-CEST data by a voxel-wise neural network approach and brain tumor data acquired with both methods.
Methods
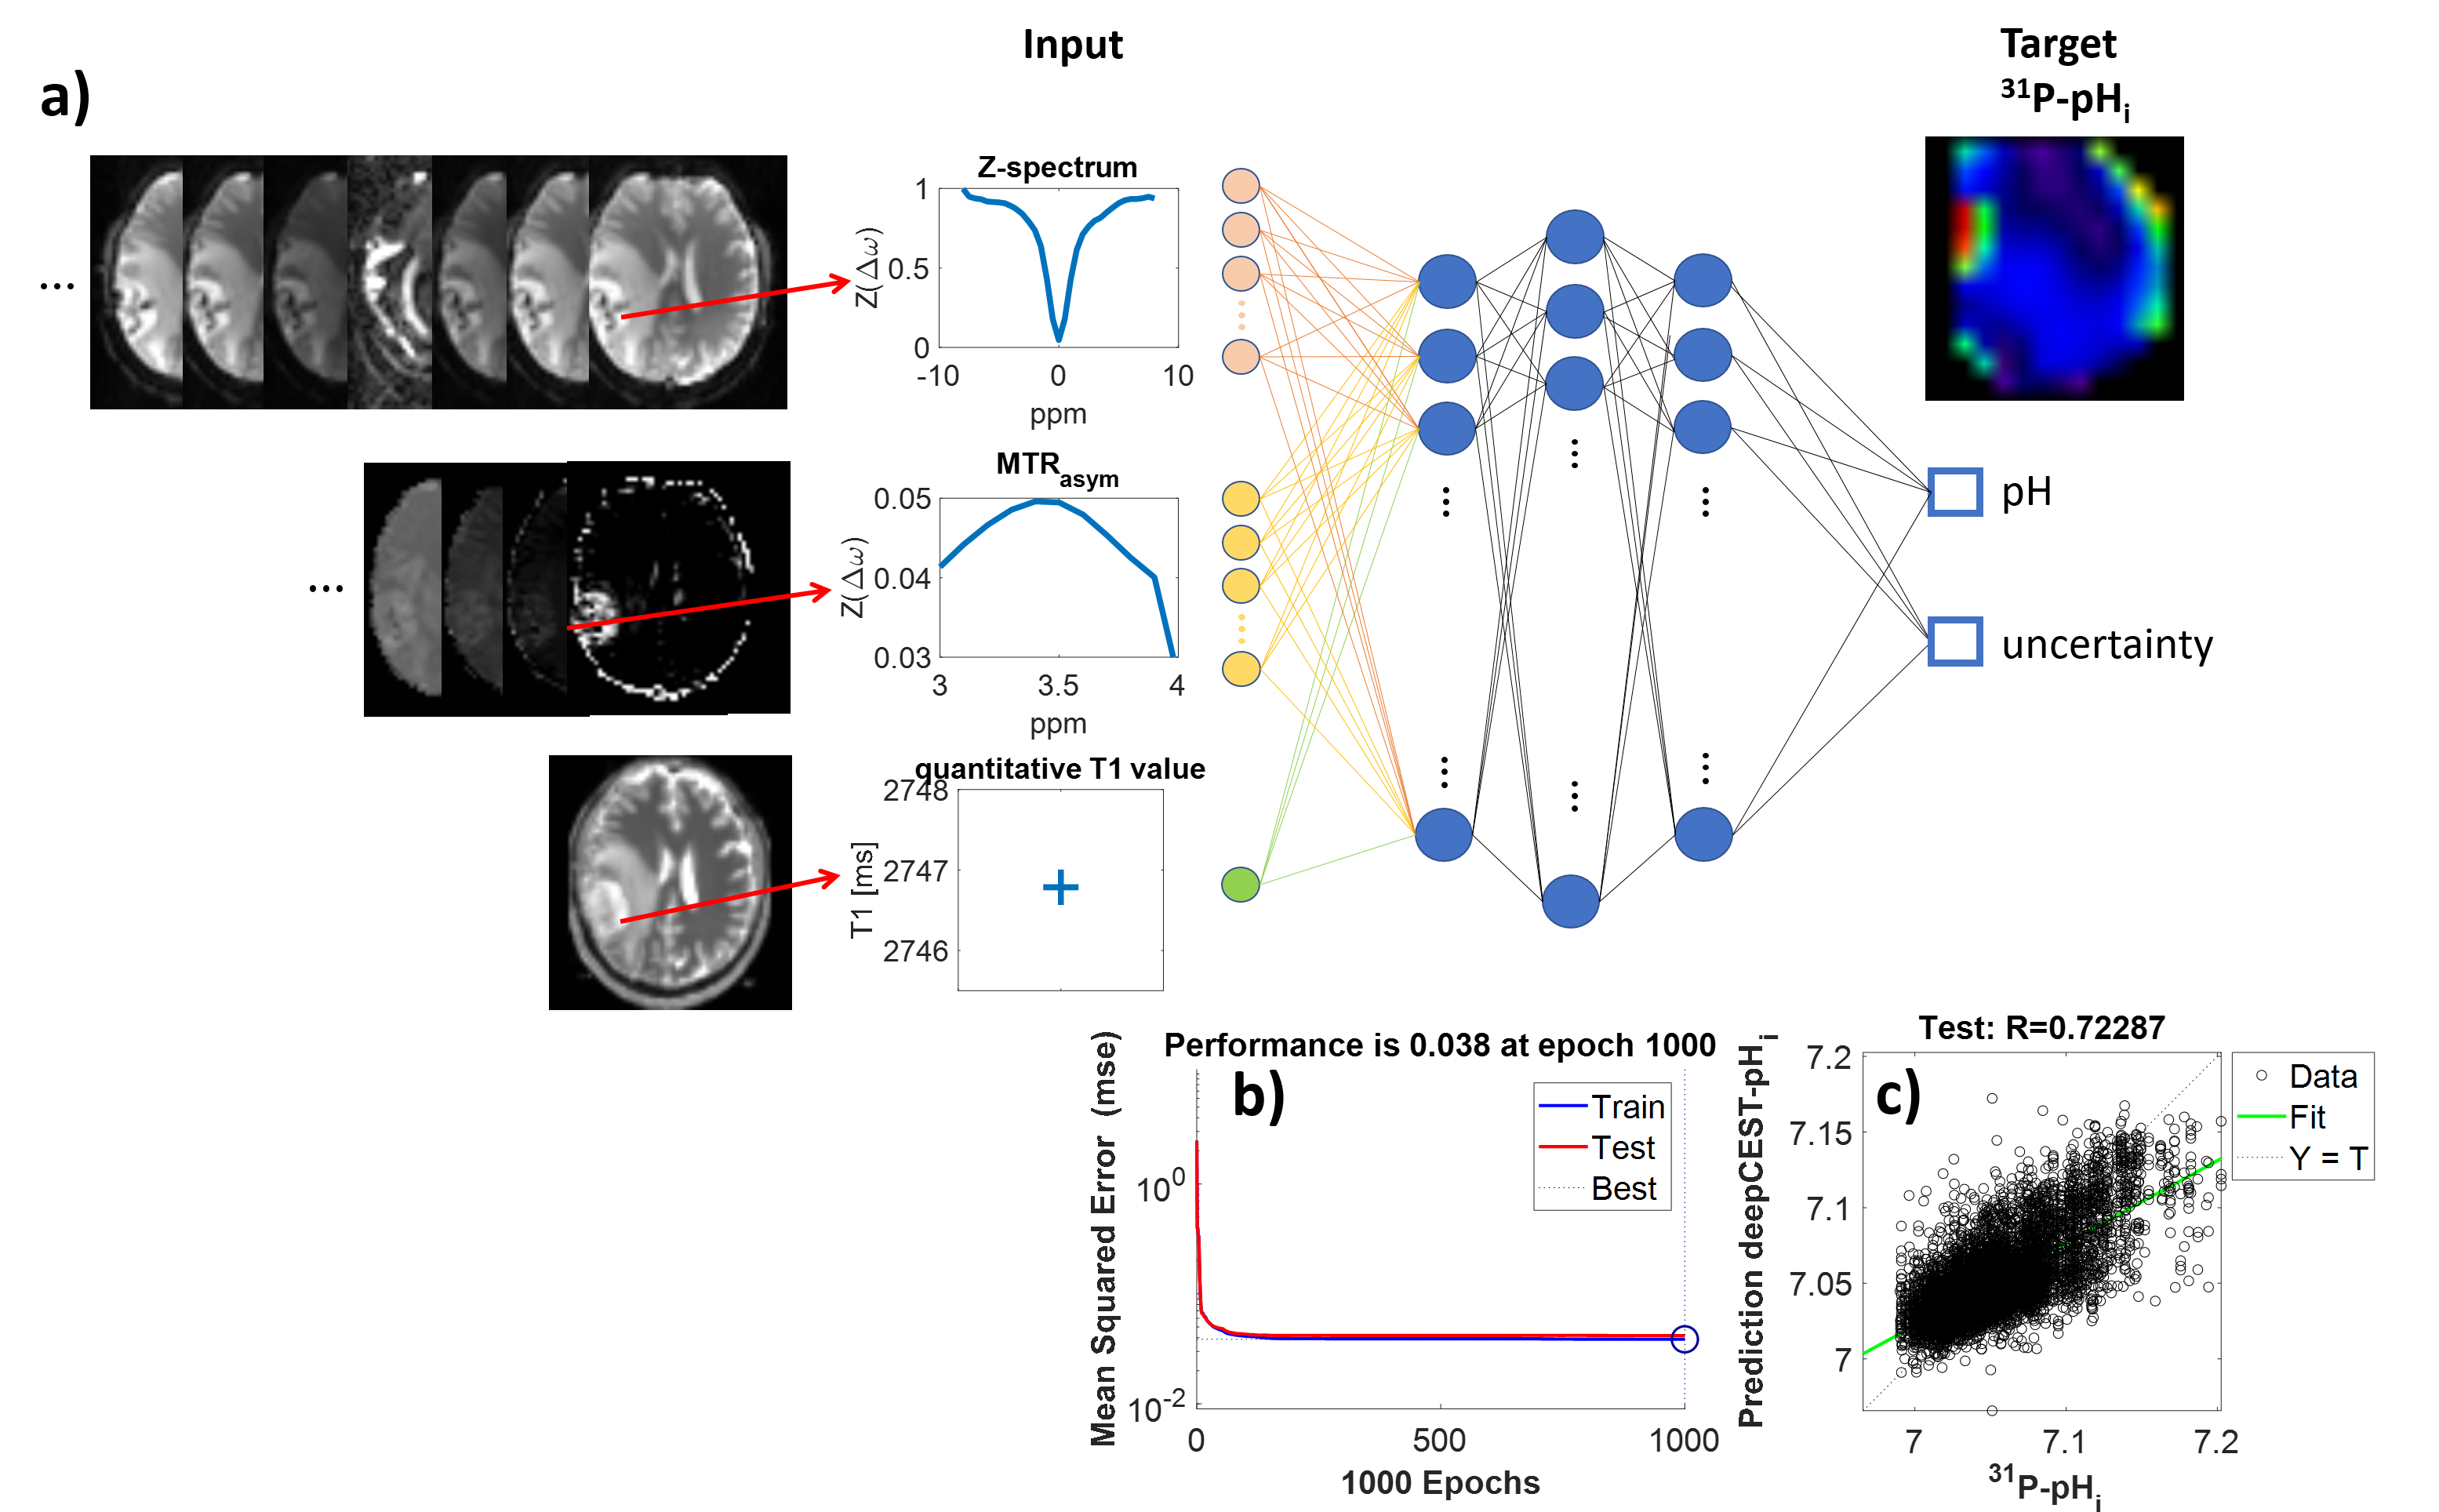
In total 15 glioblastoma patients were scanned after written informed consent on a 3T Siemens PRISMA scanner using a multislice EPI CEST readout7 (B1=1 µT, DC=50%,voxel size = 3x3x4mm3) across 16 slices, and a 1 mm isotropic T1 mapping with a 20-channel phase-array head/neck 1H receive coil.31P data was acquired using a 3D CSI sequence (voxel size = 30x30x 25mm3) and a double-tuned 1H/31P coil.A feedforward neural network (NN) with three hidden layers and a probabilistic output layer that provides the mean and uncertainty8 was realized in Python. The training was performed voxel-wise with the following input parameters (Fig.1):
(i) CEST data (51 offsets, -8 to 8 ppm) in the form of B0-corrected Z-spectra,
(ii) the APT-weighted MTRasym(3:0.1:4 ppm), and
(iii) quantitative T1 values.
Target data was the 31P-pHi value in each voxel. See Fig.1 for illustration.
The training data set consists of data from 11 patients with glioblastoma. For training all volumes were coregistered and resliced to the CEST images. In order to exclude outliers from the phosphor data near the skull, the coregistered data was filtered with an eroded mask, resulting in a total number of 107786 spectra. All final images were resliced to a high-res MPRAGE.
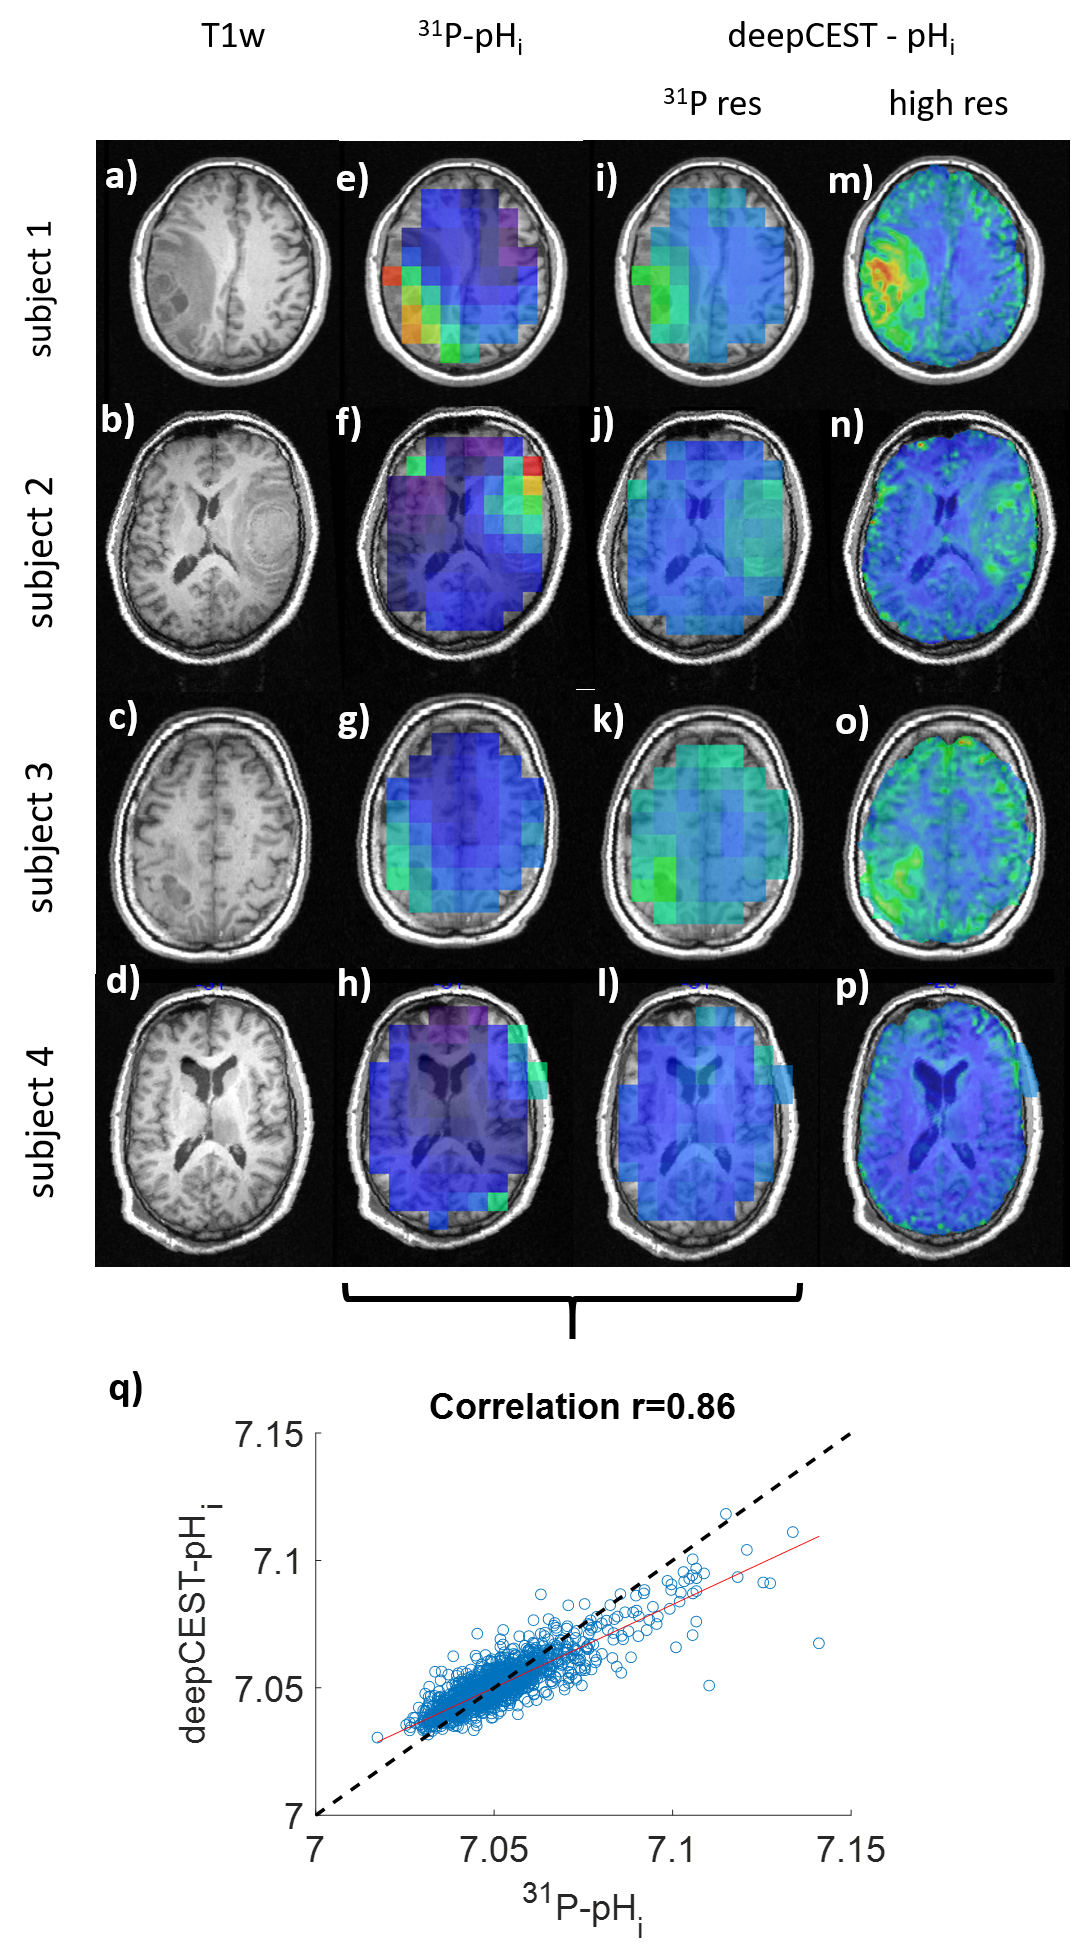
The model was tested on 4 additional patient datasets, which were not part of the training set. The predicted pHi maps were additionally down-sampled to the original the 31P-pHi resolution, to be able to calculate the RMSE and analyze the correlation.
Results
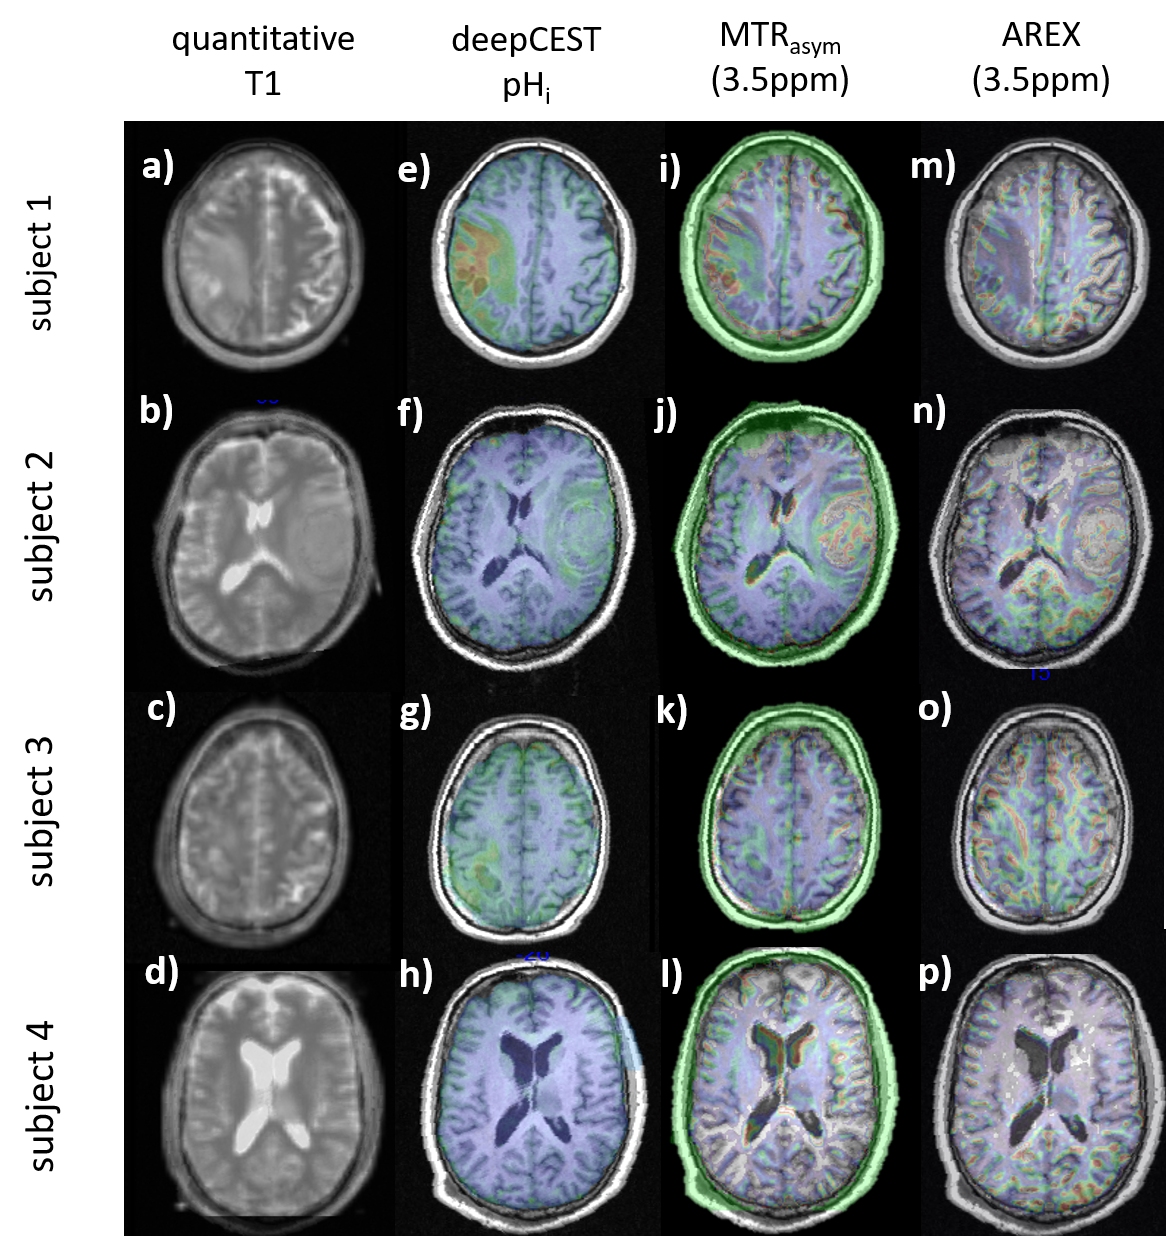
The visual comparison in the test data at low resolution shows surprising similarity of the deepCEST-pHi prediction and the measured 31P-pHi in 4 different unseen patients (Fig.2). The RMSE between target and down-sampled prediction was 0.08%, while the coefficient of determination was r=0.86. Applying the network to the original APTw-CEST resolution reveals complex substructures that might indicate tumor heterogeneity that is not visible in the 31P-pHi maps (Fig. 3 m-p). Interestingly, subject 4 showed no increased pHi in the deepCEST-pHi prediction (l,p) in agreement with 31P-pHi (h).The deepCEST-pHi maps interestingly show novel features that are not visible in conventional CEST MRI (APTw-MTRasym, APTw-AREX, quantitative T1) (Fig.3). Thus, the deepCEST-pHi network seems to extract the pH-weighting of CEST better from the data than conventional evaluation.
Discussion
We herein show the feasibility of predicting pHi maps from CEST data by a learning-based, 31P-informed approach. Although the downsampled data match well the 31P-pHi maps, the prediction shows slightly elevated pHi in normal appearing white matter. This could be due to the lack of a healthy control group during training. Surprisingly, the deepCEST-pHi shows different tumor features that cannot be visualized by the MTRasym, AREX nor quantitative T1 data, and provides more detailed features than the low resolution 31P data, as it is inferred form the high resolution 1H CEST data. The approach can be further improved as both, CEST input features can be extended, and 31P targets can be acquired at higher resolution. While detailed studies of causality and used CEST-features are required, this preliminary result is highly promising for a non-invasive 3D and high resolution MRI-based pHi mapping method, which could provide valuable information for brain tumor diagnosis and therapy, as well as for other diseases.Conclusion
A high resolution CEST–MRI–based pHi mapping in brain tumors seems possible at 3T using the deepCEST-pHi neural network informed by 31P target data. This paves the way for non-invasive 3D pHi mapping at clinical MRI systems.Acknowledgements
No acknowledgement found.References
1) Zhou J et al. J Magn Reson. (2000) ), https://doi: 10.1006/jmre.1999.1956
2) Jinyuan Zhou et al. MRM (2022), https://doi.org/10.1002/mrm.29241
3) Maria Sedykh et al. MRM (2023), https://doi.org/10.1002/nbm.4955
4) M.Zaiss et al. MRM (2016), https://doi.org/10.1002/mrm.26100
5) J.-R. Schüre et al. Metabolic information in APT-CEST, ISMRM (2022)
6) J.-R. Schüre et al. NMR in Biomed (2019), https://doi.org/10.1002/nbm.4125
7) J.-R. Schüre et al. NMR in Biomed (2021), https://doi.org/10.1002/nbm.4524
8) Felix Glang et al. MRM (2019), https://doi.org/10.1002/mrm.28117
Figures