1074
Fast Quantitative T1, T2, PD, B1 and QSM Mapping Using A Single MR Fingerprinting Acquisition And A Phase-Sensitive Deep Reconstruction Network.1Medical Physics, Memorial Sloan Kettering Cancer Center, New York,, NY, United States
Synopsis
Keywords: Quantitative Imaging, MR Fingerprinting, Quantitative Susceptibility Mapping
Motivation: Incorporating MR phase into the MRF scheme can provide further diagnostic information, such as QSM. However, the MRF dictionary exponentially grows with the number of parameters to estimate.
Goal(s): To validate QSM and B1 mapping using MRF and PS-DRONE reconstruction network against conventional reference maps.
Approach: Data were acquired at 3T with an EPI-MRF, a multi-echo GRE sequence for QSM and a Bloch Siegert sequence for B1 mapping.
Results: PS-DRONE enabled simultaneous quantification of T1, T2, PD, B1 and maps in 2 minutes. Tissue parameter maps were reconstructed in 1 second. Strong correlations were observed to reference B1 and QSM maps.
Impact: The ability of PS-DRONE to quantitatively image T1, T2, PD, B1 and QSM with similar accuracy to conventional techniques, but in a fraction of the time, would promote the use of multiparametric quantitative MRI in clinical practice.
Introduction
MR fingerprinting (MRF)1 allows for rapid and simultaneous mapping of multiple tissue parameters during a single MRI scan. This is achieved by dynamically adjusting acquisition parameters, resulting in a unique signal evolution for each voxel that depends on the tissue characteristics. The measured signal is then compared against a precomputed dictionary of simulated signal magnetizations. To address the issue of exponential dictionary growth with the number of parameters, a deep reconstruction method called DRONE2 has been introduced for quantifying T1 and T2 values from the signal magnitude. Notably, MR signals consist of both magnitude and phase components, both of which can offer valuable diagnostic information. To address this, DRONE has been adapted into a Phase-Sensitive Deep Reconstruction Method (PS-DRONE), which provides T1, T2, proton density (PD), B1, and phase maps3. These phase maps can be further utilized for Quantitative Susceptibility Mapping (QSM) to derive susceptibility maps. The aim of this study is to compare susceptibility and B1 maps generated using PS-DRONE with reference maps obtained through a multi-echo GRE sequence for QSM and a Bloch Siegert sequence for B1 mapping for both in vitro and in vivo setups.Methods
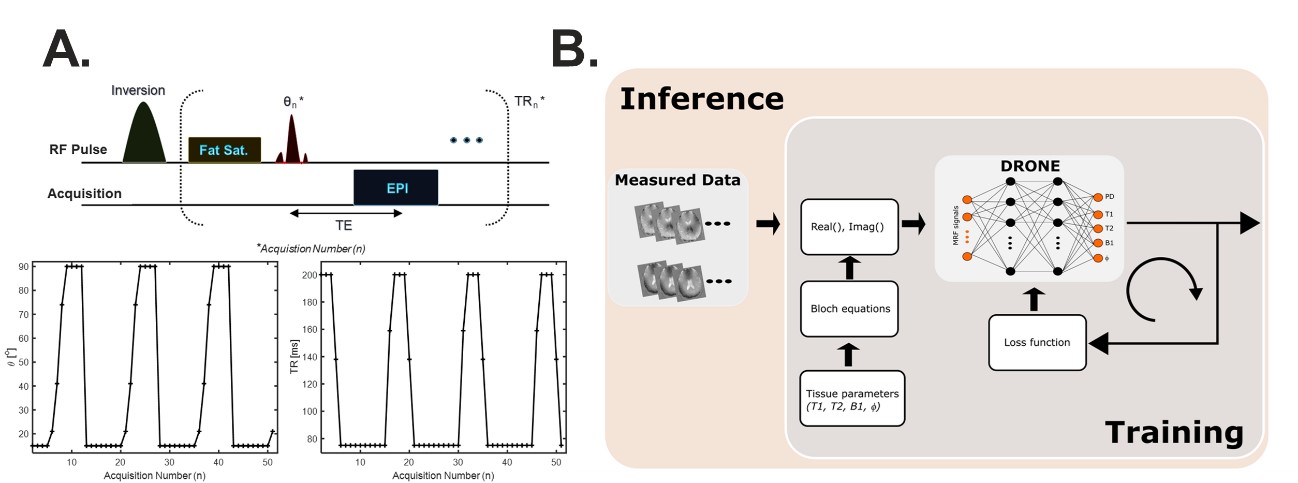
Data were acquired at 3T (Signa Premier, GE Healthcare, Waukesha, WI) with a 48-channel head receiver coil. Images were obtained from a NIST phantom for T1 and T2 validation, a QSM phantom and two healthy volunteers under an approved IRB protocol. The QSM phantom had four compartments with different concentrations of gadolinium solution (Gadavist, Bayer Pharmaceuticals, Wayne, NJ) placed in a 1L container with a 1% agarose gel solution.The MRF pulse sequence consisted of an EPI-based sequence with preparation pulses (adiabatic inversion and a frequency selective fat saturation) and a set of excitation pulses and repetition times (θn, TRn) (Figure 1-A). PD, T1, T2, B1, and phase MRF maps were generated with PS-DRONE3 (Figure 1-B). MRF scan time was of 2 min, and the tissue parameter maps were reconstructed in 1 sec. B1 maps were compared to reference maps obtained with a Bloch-Siegert B1 mapping sequence, and QSM maps were compared to maps from a multi-echo spoiled gradient echo sequence. Both the PS-MRF and the reference phase maps were processed using the using the Morphology Enabled Dipole Inversion (MEDI) toolbox4, and the Projection onto Dipole Fields (PDF) method5 was used to retrieve the local fields.
Results
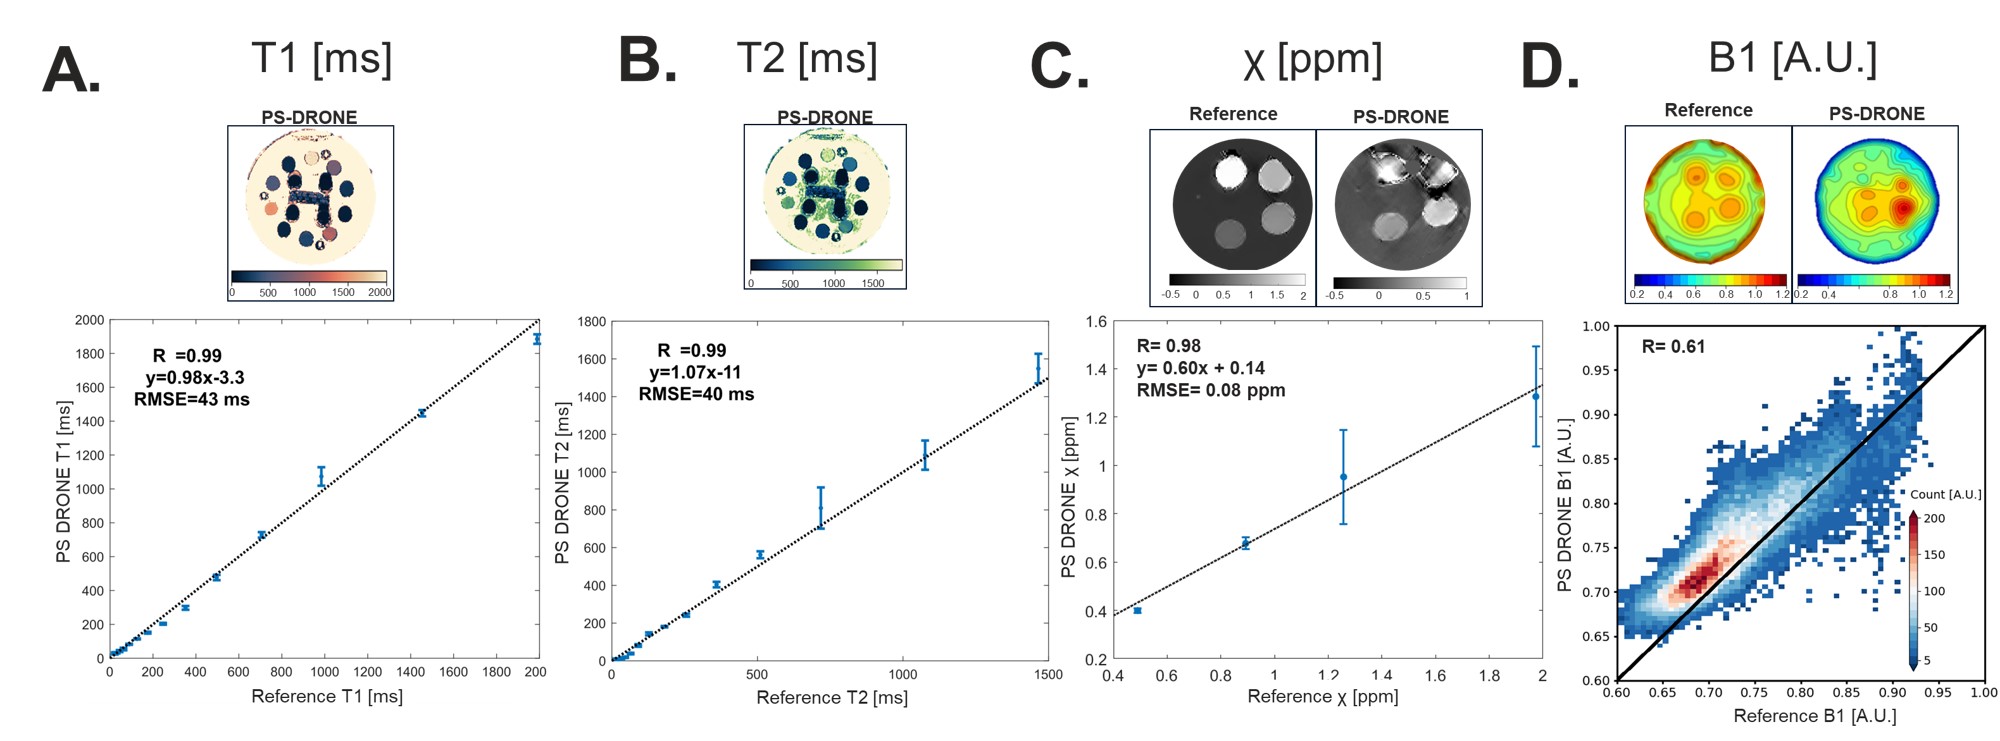
Figure 2-A and 2-B show PS-DRONE derived T1 and T2 maps from the NIST phantom. Both T1 and T2 values exhibited a strong correlation (R=0.99) with the reference values6.Figure 2-C shows phantom QSM maps obtained with the reference method and PS-DRONE along with their correlation plot. Both methods demonstrated increased susceptibility with gadolinium concentration, despite some artifacts. PS-DRONE values were consistently lower than the reference values. However, a strong correlation between the reference and PS-DRONE values was observed (R=0.98).
Figure 2-D shows the phantom B1 maps with the reference and PS-DRONE along with a 2-D histogram distribution plot. PS-DRONE recorded higher B1 values with a bias of -0.071 A.U. arbitrary units.
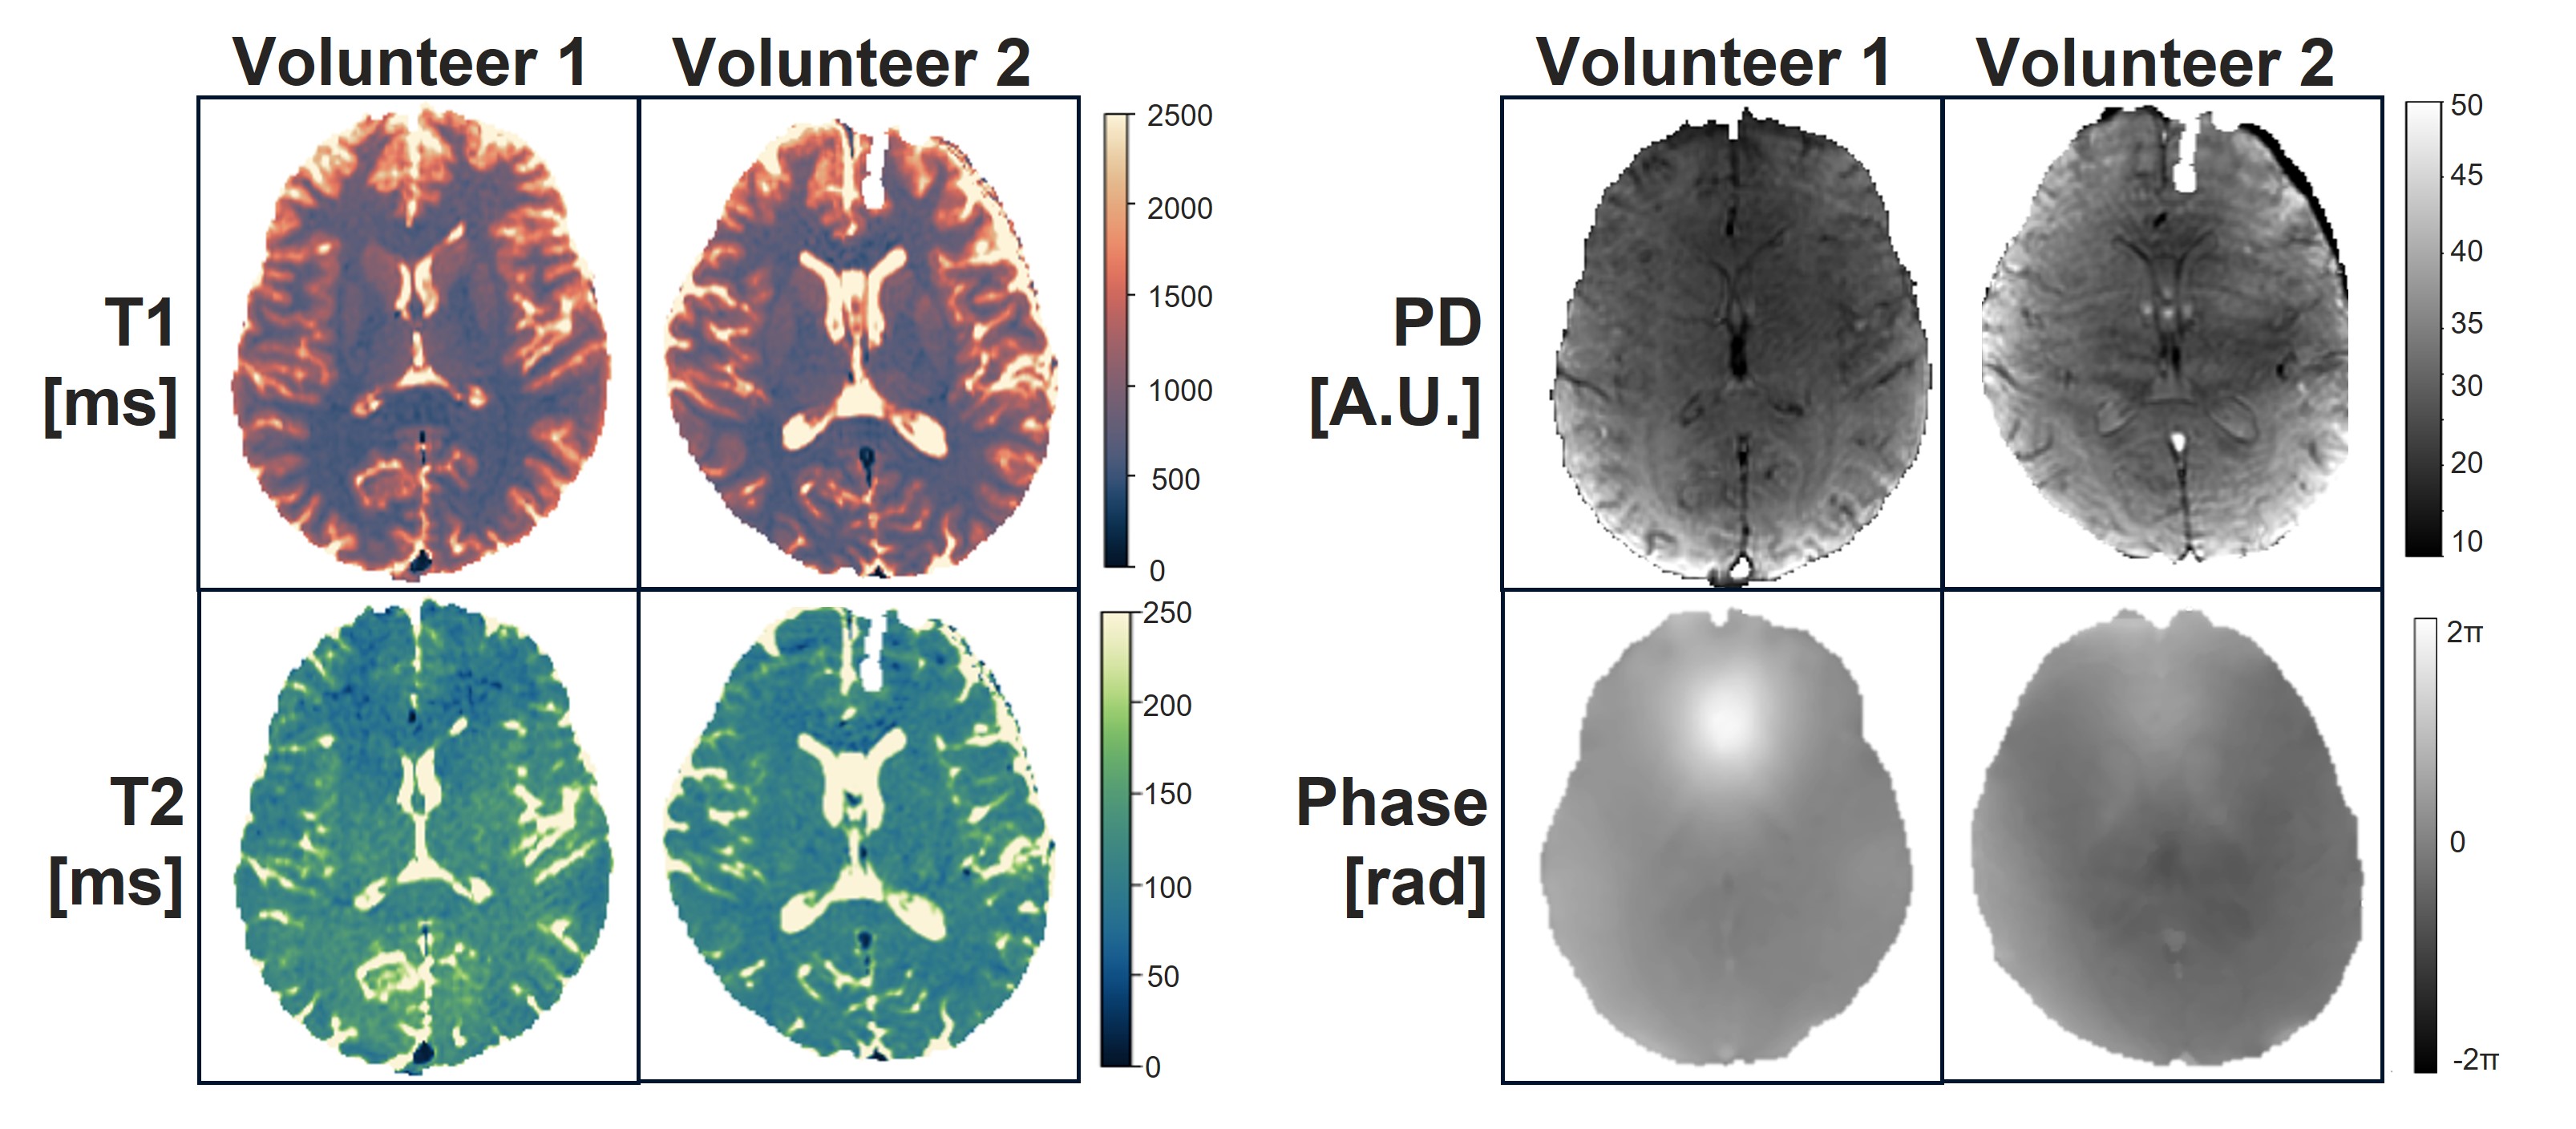
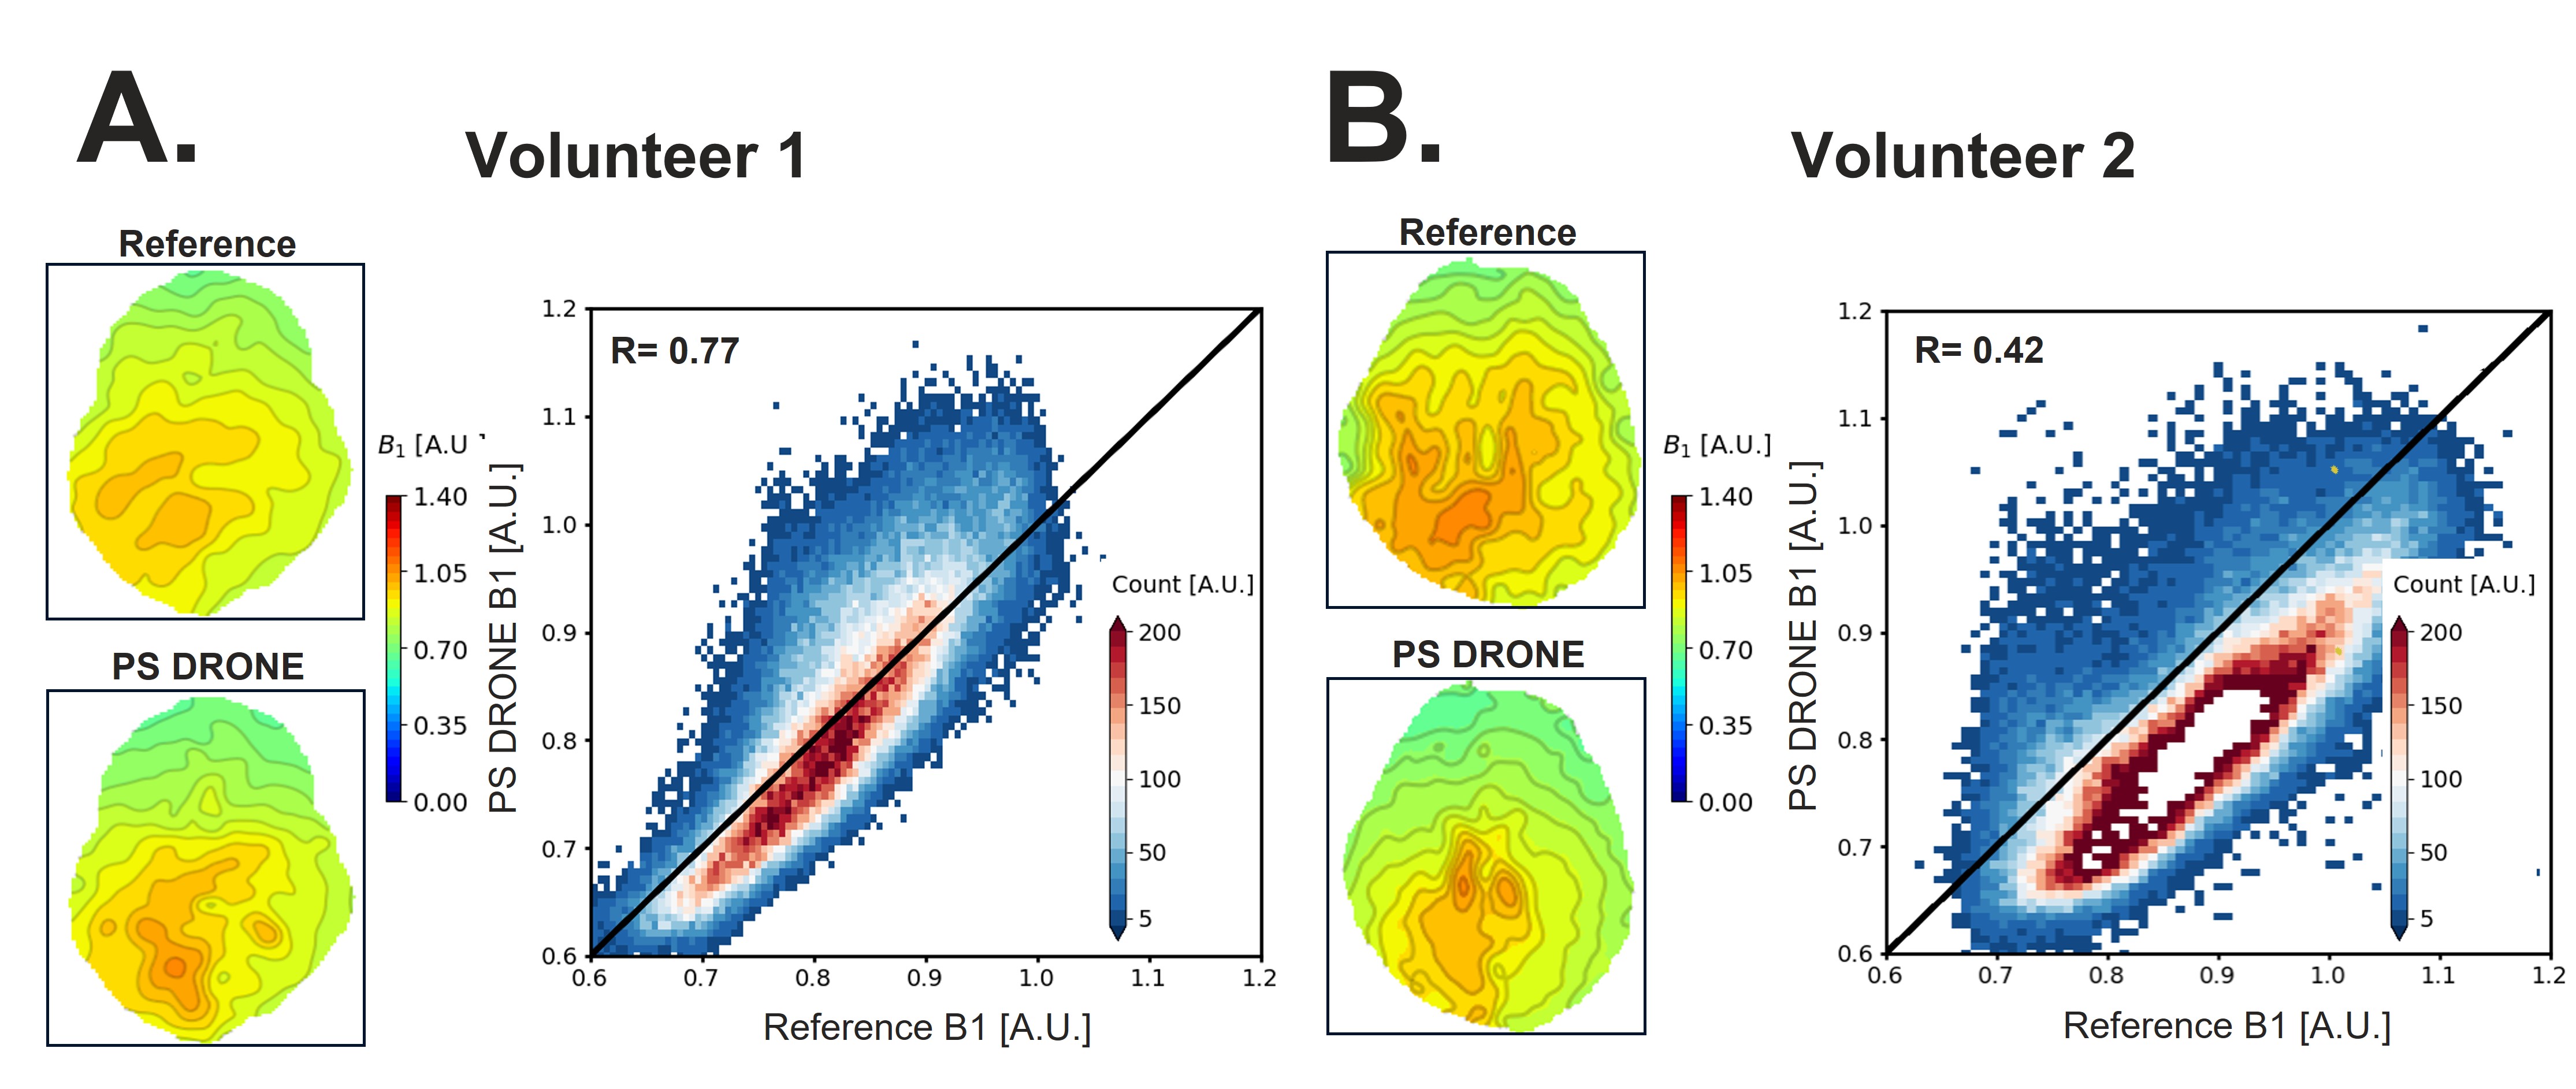
Figure 3 shows PS-DRONE T1, T2, PD and phase maps. In vivo B1 maps and 2-D histogram distribution plots obtained with PS-DRONE and the reference B1 mapping technique are shown in Figure 4. The voxel-wise 2D distributions show a strong correlation between the PS-DRONE B1 and the Reference B1 for volunteer 1 (R = 0.77, Figure 4-A); a moderate correlation was found for volunteer 2 (R=0.42, Figure 4-B).
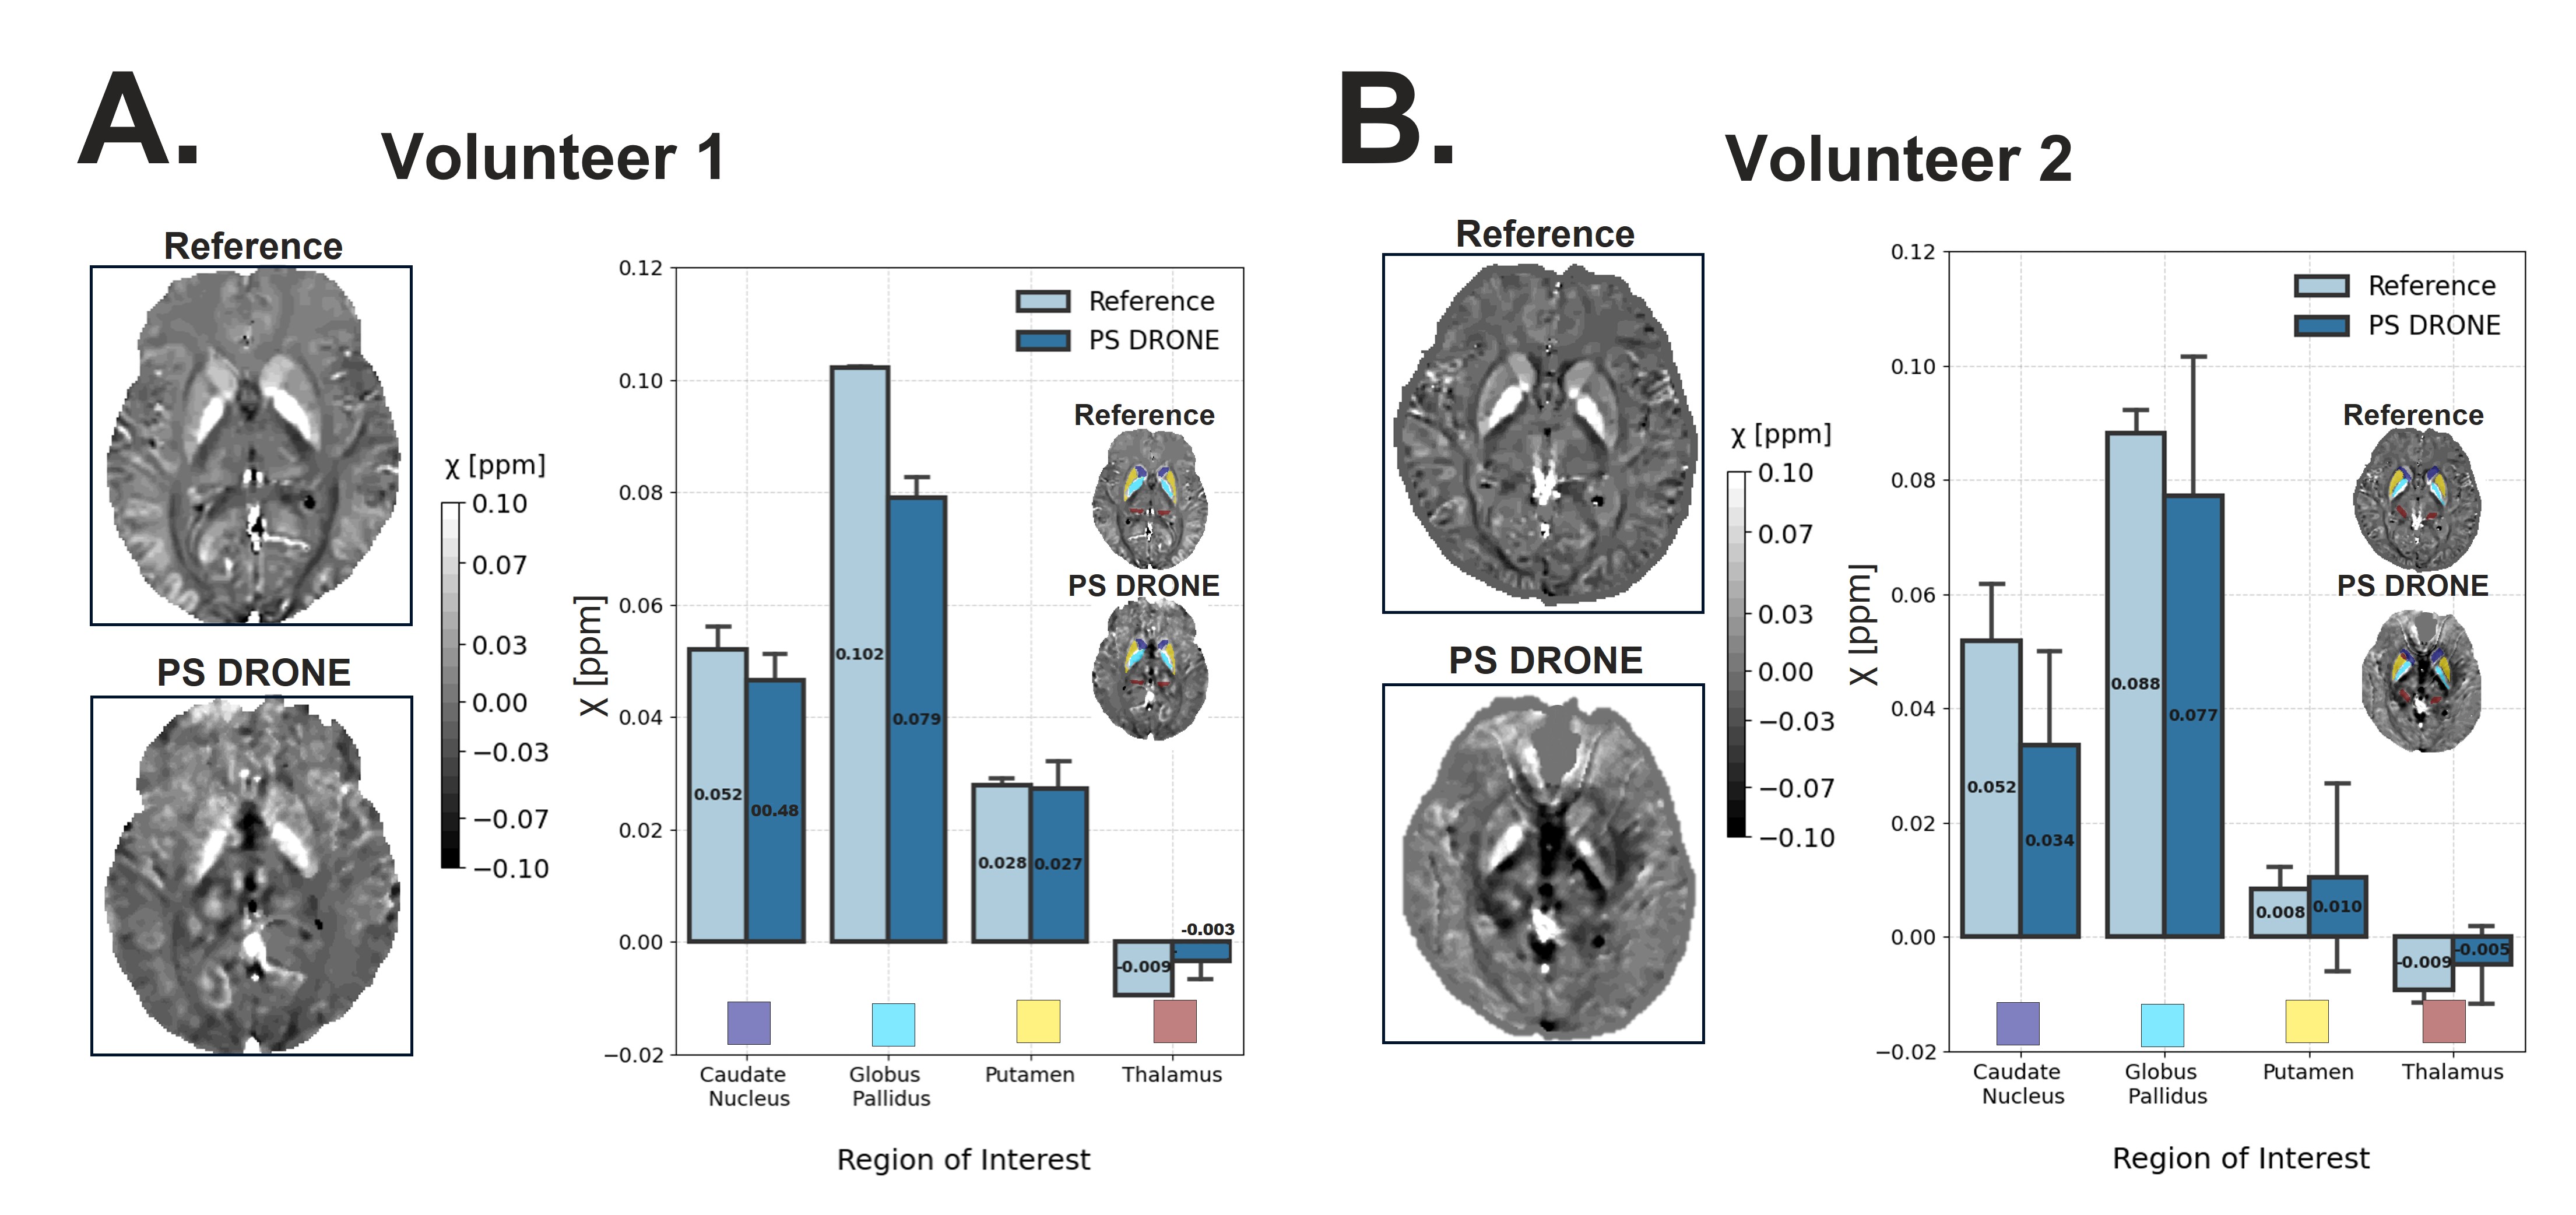
Figure 5 displays the in vivo comparison analysis of QSM maps obtained with PS-DRONE and the reference. Overall, PS-DRONE mean susceptibility values were 25.2 ± 21.4% lower than the mean reference susceptibility values, with the smallest percentage change observed in the Putamen (-5.5%) and the greatest in the Thalamus (55.5%). However, it's important to note that PS-DRONE-derived susceptibility was not found to be statistically different from the reference-derived susceptibility (p-value = 0.5).
Conclusions
Deep learning-based PS-DRONE quantification was combined with an optimized EPI-MRF sequence to enable simultaneous quantification of T1, T2, PD, B1 and phase (to compute QSM) tissue parameters. The approach reduced whole-brain coverage scan time to 2 minutes, and the tissue parameter maps were reconstructed in 1 second. Strong correlations were observed to reference B1 and QSM maps. Although susceptibility artifacts remain a challenge, future work will focus on their mitigation through advanced acquisition techniques and optimization of the QSM pipeline.Acknowledgements
This work was supported by NIH/NCI grants P30-CA008748 and R37-CA262662References
- Ma, Dan, et al. "Magnetic resonance fingerprinting." Nature 495.7440 (2013): 187-192.
- Cohen, Ouri, et al. "MR fingerprinting deep reconstruction network (DRONE)." Magnetic resonance in medicine 80.3 (2018): 885-894.
- Yu, Victoria, et al. “Rapid 3D Quantitative Mapping of Brain Metastases with Deep Learning-Based Phase-Sensitive MR fingerprinting”. Proc. Intl. Soc. Mag. Reson. 2022.
- Liu, Zhe, et al. "MEDI+ 0: Morphology enabled dipole inversion with automatic uniform cerebrospinal fluid zero reference for quantitative susceptibility mapping." Magnetic resonance in medicine 79.5 (2018): 2795-2803.
- Liu, Tian, et al. "A novel background field removal method for MRI using projection onto dipole fields." NMR in Biomedicine 24.9 (2011): 1129-1136. Stupic, Karl F., et al. "A standard system phantom for magnetic resonance imaging." Magnetic resonance in medicine 86.3 (2021): 1194-1211.
- Stupic, Karl F., et al. "A standard system phantom for magnetic resonance imaging." Magnetic resonance in medicine 86.3 (2021): 1194-1211.
Figures