1070
Phase jolt: Second spatial derivative of phase images is a new contrast that offers many benefits for SWI type processing1Department of Cognitive Neuroscience, Maastricht Univesity, Faculty of Psychology and Neuroscience, Maastricht, Netherlands, 2Brain Innovation, Maastricht, Netherlands, 3Polyclinic for Radiology, University Hospital Halle, Halle, Germany, 4Scannexus, Maastricht, Netherlands, 5School of Electrical Engineering and Computer Science, The University of Queensland, Brisbane, Australia, 6National Institutes of Health, Washington DC, MD, United States, 7Center for Magnetic Resonance Research, Department of Radiology, University of Minnesota, Minneapolis, MN, United States
Synopsis
Keywords: Image Reconstruction, Contrast Mechanisms, Phase
Motivation: Unlike magnitude images, even simple averaging is difficult with phase images, because of the circular nature of phase, spanning 2pi radians range.
Goal(s): In our research that uses mesoscopic imaging (< 0.5 mm isotropic) at 7 T, we need to average multiple acquisitions to increase SNR. Being unable to average straightforwardly together with the lack of natural zero point is a critical constraint.
Approach: To address this problem, we propose to operate on the magnitude of the second spatial derivative of phase images - called “phase jolt”.
Results: Our results show phase jolt offers benefits for processing associated with SWI imaging.
Impact: Phase jolt is an easy to implement new contrast where vessels and non brain tissue are highlighted and background bias field is mitigated. Therefore, phase jolt images have potential to be impactful in any setting where phase images are used.
Introduction
Unlike magnitude images, even simple image processing operations (such as averaging) are harder to perform on the phase images. This is because of the circular nature of the phase measurements, spanning a range of 2pi radians. There is a well-developed literature on how to process phase images [1, 2, 3, 4, 5]. However, there are also well-known challenges that arise, such as still remaining phase wraps in regions with low signal-to-noise ratio (SNR) after phase unwrapping or removal of background fields. While employing these methods help make phase images more accessible for end users, using phase data is less practical and less commonplace compared to magnitude images. In our own research that uses mesoscopic imaging (< 0.5 mm isotropic) at ultra-high magnetic fields, we need to average multiple acquisitions to increase image signal-to-noise ratio (SNR). To address this problem, we propose to operate on the spatial derivatives of the phase images to make use of the available information within them. We coin the term “phase jolt” to describe the magnitude of the second spatial derivative of phase images.Methods
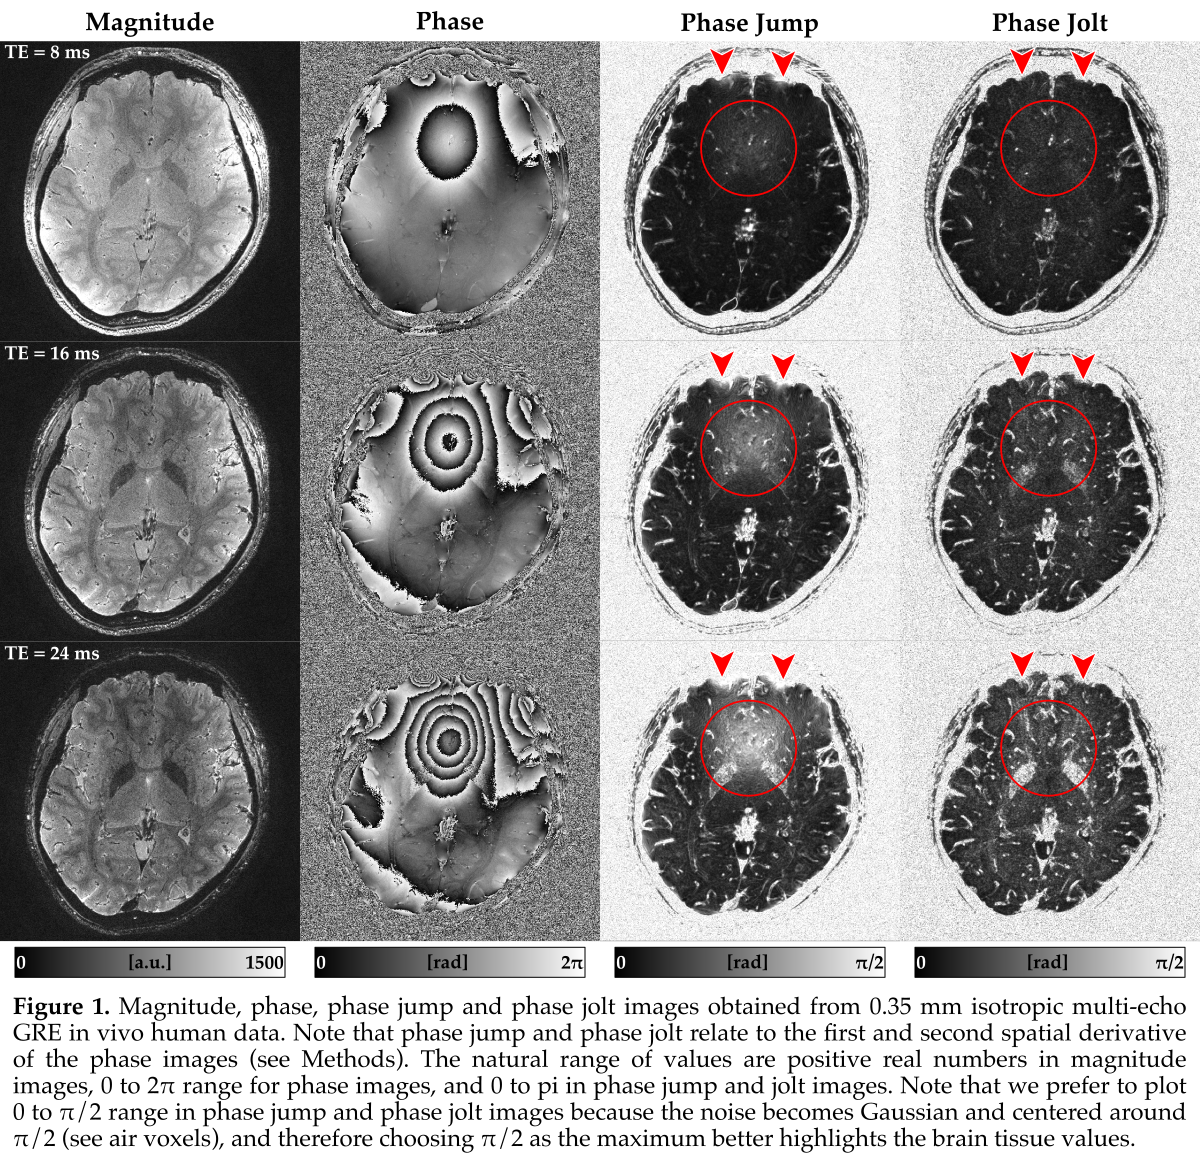
We compute spatial partial derivatives of the phase images through the “circular difference” operation. This operation accounts for the “phase wraps” at the level of pairwise computations. For each voxel in a 3D MR phase image, we compute the circular differences along x, y, and z axes to obtain the first spatial phase derivative image. The first spatial derivative is a “vector field”, where each voxel has three values associated with it (as opposed to the initial scalar phase field, where each voxel has a single value associated with it). Note that the circular differences are always in -pi to pi radians range, where the sign indicates clockwise or counterclockwise direction. Once the first spatial derivative is computed, we quantify the magnitude of the vectors using the L1 norm divided by 3. We call this spatial operation “phase jump”.The phase jump images nicely highlight tissue edges; however, they still reveal the large-scale phase variations originating from the background field (Figure 1). To account for this, we suggest using the second spatial derivative of the phase images. We compute this by taking the spatial derivative of the first spatial derivative vector field, effectively resulting in a “tensor field” (where each voxel has 9 values associated). Then, we compute the magnitude of the second spatial derivative using the L1 norm divided by 9. This magnitude calculation again results in a natural 0 to pi radians range. We call this spatial operation “phase jolt”. The benefits of computing the phase jolt are the same as for the phase jump while further mitigating the bias field (Figure1). The downside is that it requires integrating even more information than the phase jump, therefore lowering the effective resolution.
We compute the phase jump and jolt on the data acquired as described by [6] using a multi echo gradient echo protocol [7] at 7 T with pTx [8]. Briefly, we have 6 echoes at 0.35 mm isotropic resolution, using low acceleration (GRAPPA=2 for one and 3 for other participants, no partial Fourier).
Results
- Figure 1 shows the phase jump and jolt contrasts compared to the corresponding T2*-weighted magnitude and phase images.
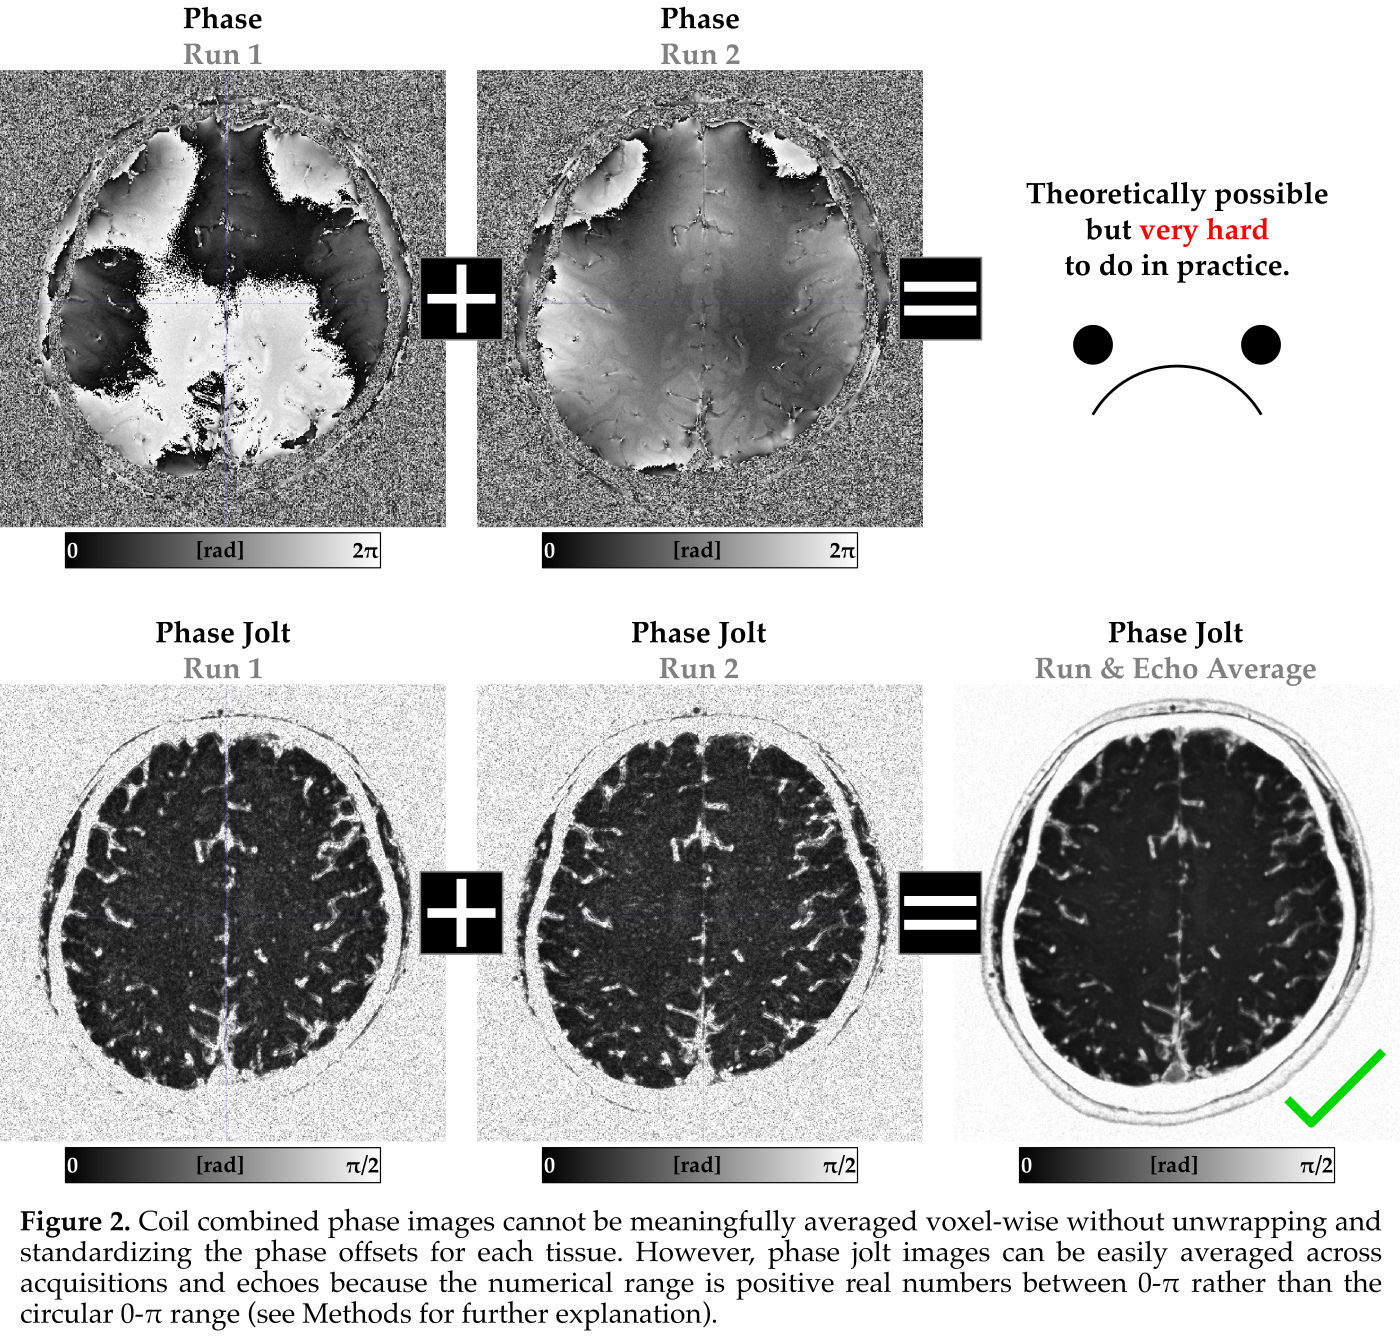
- Figure 2 highlights that phase images are hard to average due to their circular nature. However, phase jolt images are easy to average due to their numerical range with natural zero and maximum (pi radians).
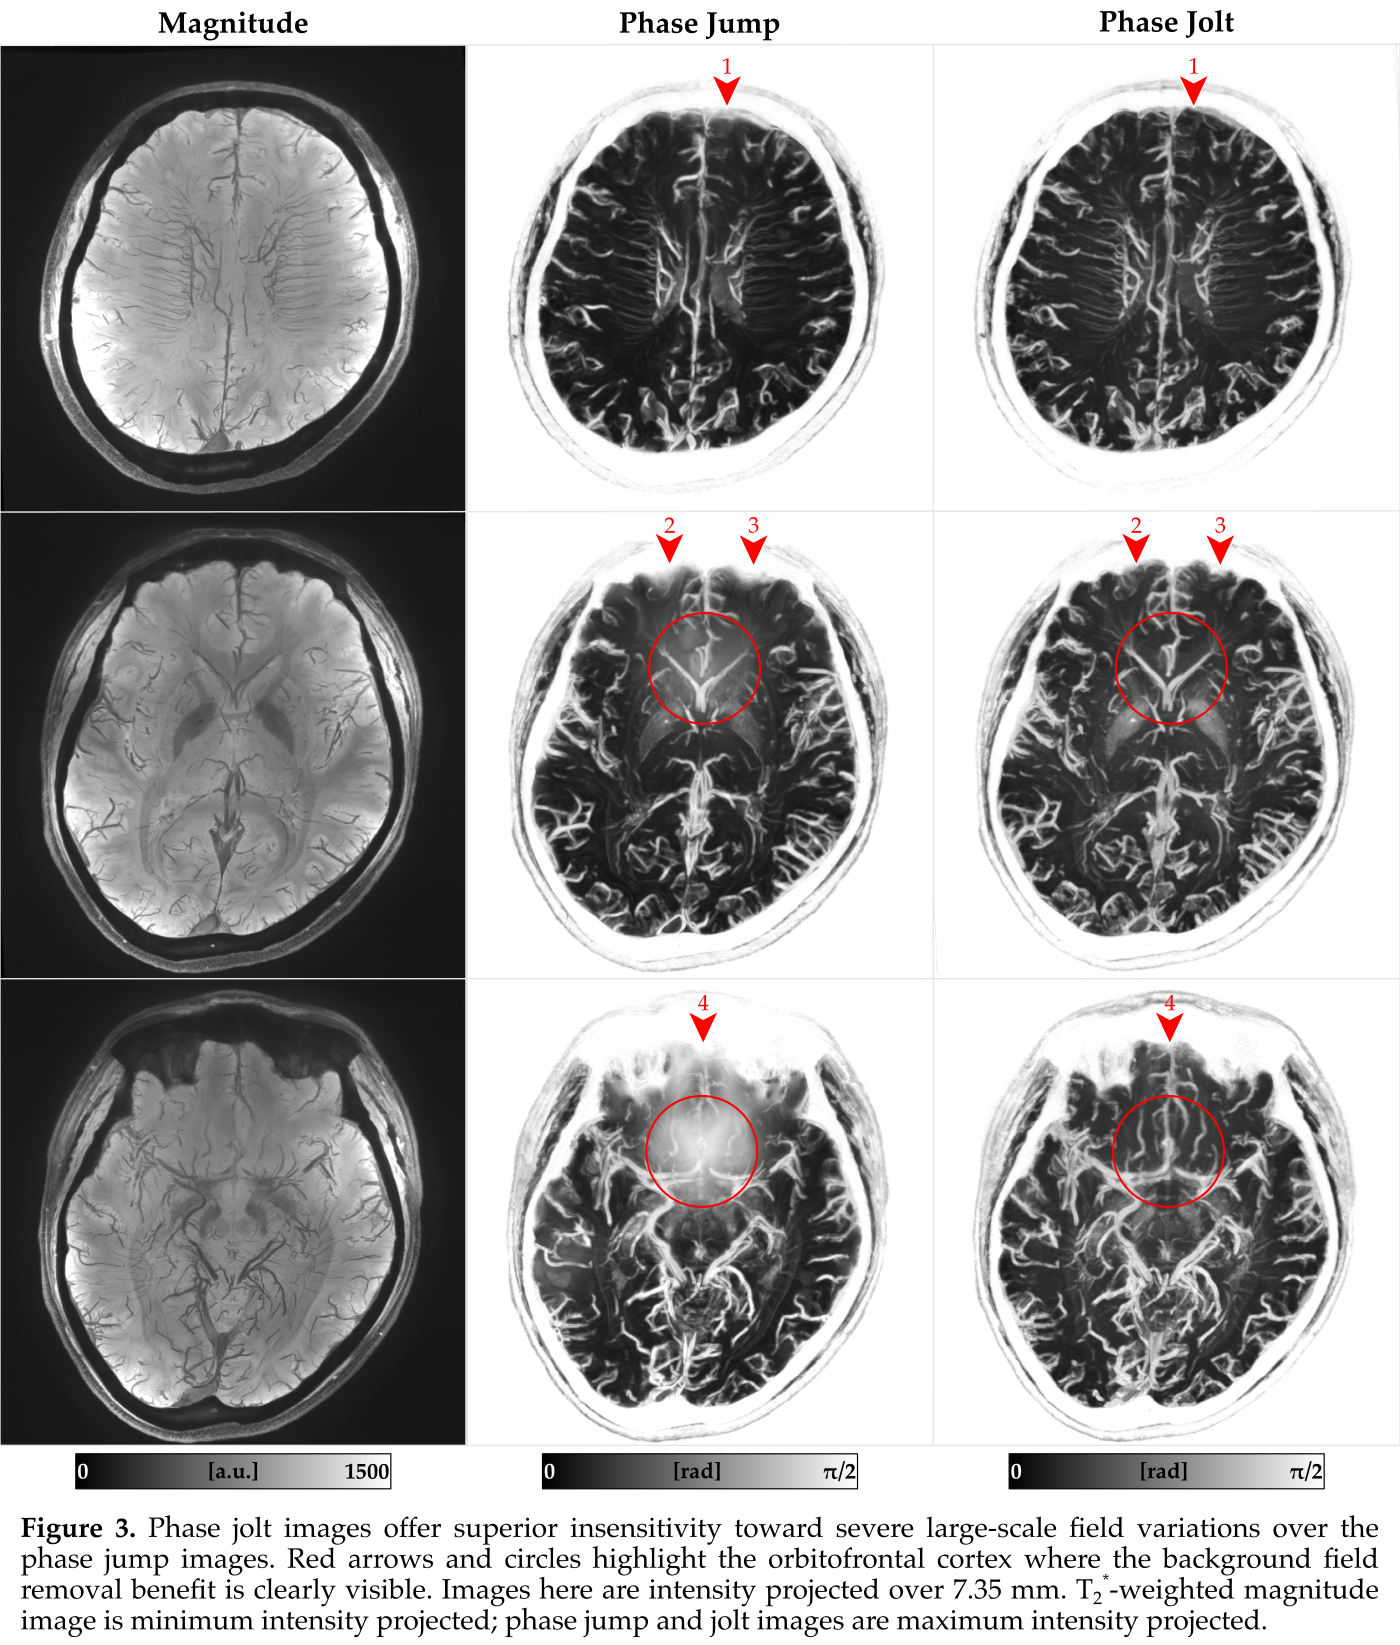
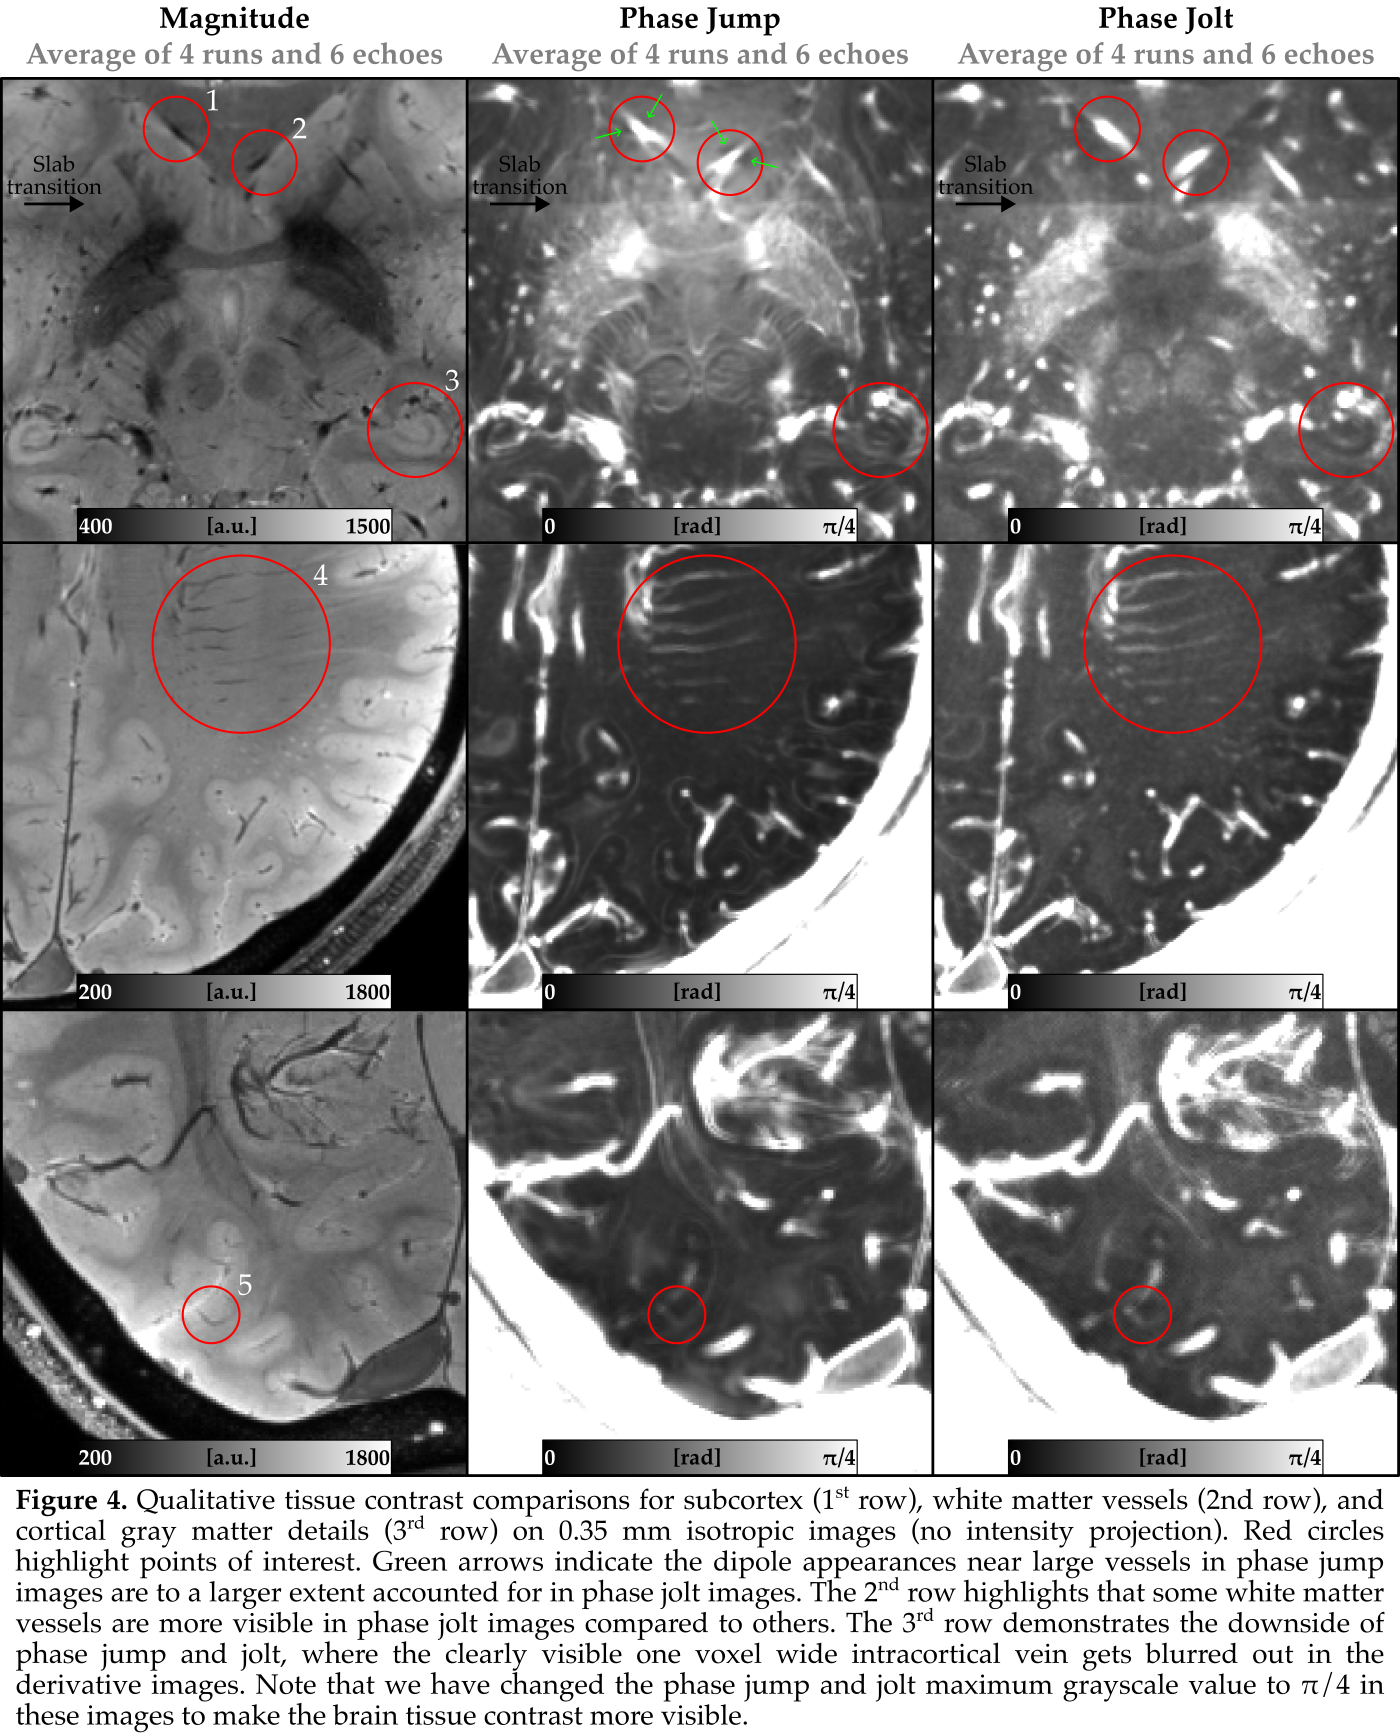
- Figures 3 and 4 demonstrate the benefit of phase jolt over phase jump, especially for mitigating the background field.
Discussion & Conclusion
Phase jolt contrast is easy to compute and implement (several voxel-wise circular subtractions, and L1 norm). It provides an informative image where vessels are enhanced while the background field is mitigated. Therefore, phase jolt images may provide an additional contrast in any setting where phase images are recorded. The exquisite contrast of venous vessels in the phase jolt image might be used in a similar setting as susceptibility weighted imaging (SWI) where it may serve to create a phase mask to enhance the sensitivity towards vessels in T2*-weighted images. Phase jolt images as an additional source of information for fMRI analyses might be another application. The phase jolt images are effectively unwrapped and transformed in a sampling space that has natural 0 and a maximum (pi). The downside is, multiple voxels are integrated, decreasing the effective resolution. Currently, our implementation is available within the LayNii software package [10] via LN2_PHASE_JOLT program.Acknowledgements
OFG and RG have financial interests tied to Brain Innovation company. DHYT is employed by Scannexus.References
- [1] Deistung, A., Rauscher, A., Sedlacik, J., Stadler, J., Witoszynskyj, S., Reichenbach, J.R., 2008. Susceptibility weighted imaging at ultra high magnetic field strengths: Theoretical considerations and experimental results. Magnetic Resonance in Medicine 60, 1155–1168. https://doi.org/10.1002/mrm.21754
- [2] Haacke, E.M., Mittal, S., Wu, Z., Neelavalli, J., Cheng, Y.-C.N., 2009. Susceptibility-Weighted Imaging: Technical Aspects and Clinical Applications, Part 1. AJNR Am J Neuroradiol 30, 19–30. https://doi.org/10.3174/ajnr.A1400
- [3] Deistung, A., Schweser, F., Reichenbach, J.R., 2017. Overview of quantitative susceptibility mapping. NMR in Biomedicine 30, e3569. https://doi.org/10.1002/nbm.3569
- [4] Robinson, S.D., Bredies, K., Khabipova, D., Dymerska, B., Marques, J.P., Schweser, F., 2017. An illustrated comparison of processing methods for MR phase imaging and QSM: combining array coil signals and phase unwrapping. NMR in biomedicine 30. https://doi.org/10.1002/nbm.3601
- [5] Dymerska, B., Eckstein, K., Bachrata, B., Siow, B., Trattnig, S., Shmueli, K., Robinson, S.D., 2021. Phase unwrapping with a rapid opensource minimum spanning tree algorithm (ROMEO). Magnetic Resonance in Med 85, 2294–2308. https://doi.org/10.1002/mrm.28563
- [6] Gulban, O.F., Bollmann, S., Huber, L. (Renzo), Wagstyl, K., Goebel, R., Poser, B.A., Kay, K., Ivanov, D., 2022. Mesoscopic in vivo human T2* dataset acquired using quantitative MRI at 7 Tesla. NeuroImage 264, 119733. https://doi.org/10.1016/j.neuroimage.2022.119733
- [7] Eckstein, K., Dymerska, B., Bachrata, B., Bogner, W., Poljanc, K., Trattnig, S., Robinson, S.D., 2018. Computationally Efficient Combination of Multi-channel Phase Data From Multi-echo Acquisitions (ASPIRE). Magnetic resonance in medicine 79, 2996–3006. https://doi.org/10.1002/mrm.26963
- [8] Tse, D.H.Y., Wiggins, C.J., Ivanov, D., Brenner, D., Hoffmann, J., Mirkes, C., Shajan, G., Scheffler, K., Uludağ, K., Poser, B.A., 2016. Volumetric imaging with homogenised excitation and static field at 9.4 T. Magnetic Resonance Materials in Physics, Biology and Medicine 29, 333–345. https://doi.org/10.1007/s10334-016-0543-6
- [9] Huber, L., Poser, B.A., Bandettini, P.A., Arora, K., Wagstyl, K., Cho, S., Goense, J., Nothnagel, N., Morgan, A.T., van den Hurk, J., Müller, A.K., Reynolds, R.C., Glen, D.R., Goebel, R., Gulban, O.F., 2021. LayNii: A software suite for layer-fMRI. NeuroImage 237, 118091. https://doi.org/10.1016/j.neuroimage.2021.118091
Figures