1061
Parkinson’s disease in the spinal cord: an exploratory study to establish T2*w, MTR and diffusion-weighted imaging metric values1NeuroPoly Lab, Institute of Biomedical Engineering, Polytechnique Montréal, Montréal, QC, Canada, 2McConnell Brain Imaging Centre, Department of Neurology and Neurosurgery, Montreal Neurological Institute, McGill University, Montréal, QC, Canada, 3CHU Sainte-Justine Research Center, Montréal, QC, Canada, 4Computer Engineering and Software Engineering, Polytechnique Montréal, Montréal, QC, Canada
Synopsis
Keywords: Spinal Cord, Diffusion Tensor Imaging, MTR, NODDI, T2*w, Biomarkers
Motivation: Much remains unknown about the impact of Parkinson's disease on the central nervous system, particularly how it affects the spinal cord microstructure.
Goal(s): This exploratory study aims to establish DWI, MTR and T2*w metric values to explore potential morphometric alterations in the spinal cord related to Parkinson’s disease.
Approach: DWI, MTR and T2*w metrics were extracted from both Parkinson’s disease patients and healthy controls.
Results: Significant correlations were found in several regions of the spinal cord, particularly for ODI, FICVF and FA, suggesting the relevance of further studying these metrics in the spinal cord of Parkinson's disease patients.
Impact: This study is the first to establish values for MTR, T2* and DWI metrics in the spinal cord of a population with Parkinson’s disease, which could contribute to a better understanding of this disease in the central nervous system.
Introduction
Parkinson's disease (PD) is characterized by both a degeneration of dopaminergic neurons in the substantia nigra1 and the accumulation of 𝛼-synuclein2. Although PD has long been associated with brain pathology, signs of the disease such as the accumulation of 𝛼-synuclein has been reported in the spinal cord3, suggesting that it could contain information that might lead to a better understanding of the disease. However, studies that have explored the impact of PD in the spinal cord in vivo in humans are limited and much remains unknown about the microstructure of the spinal cord in PD patients.Methods
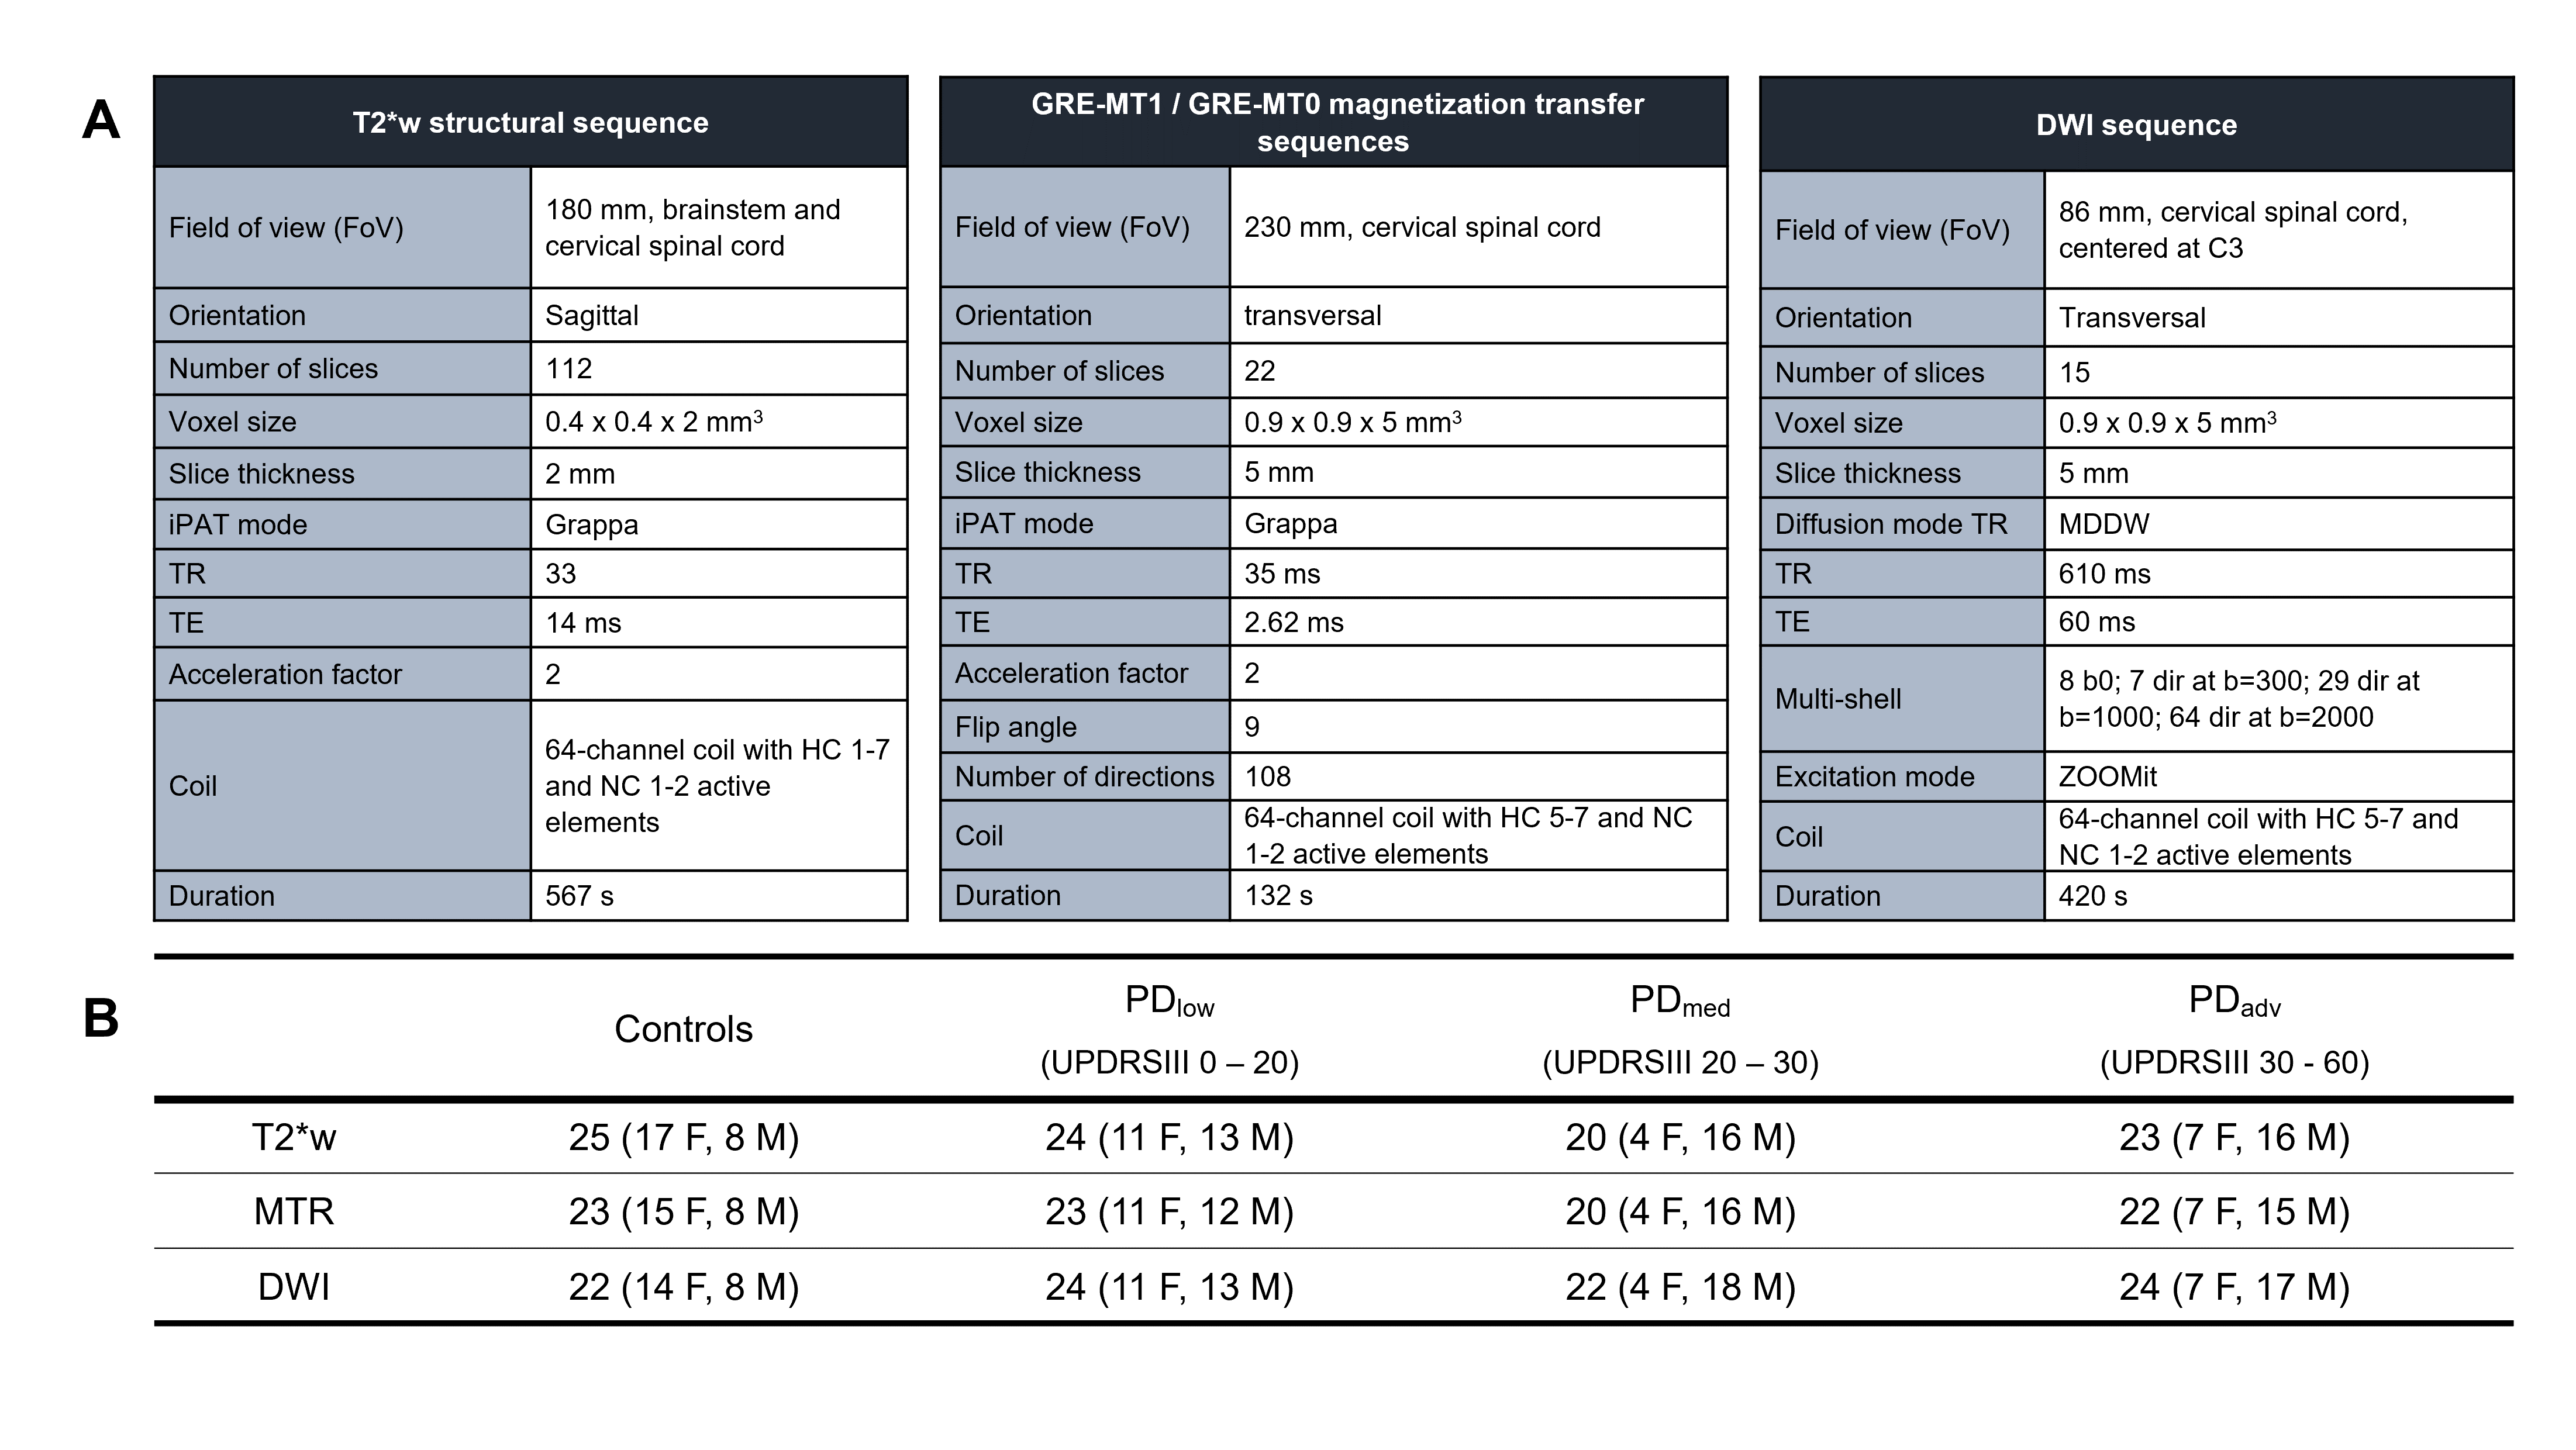
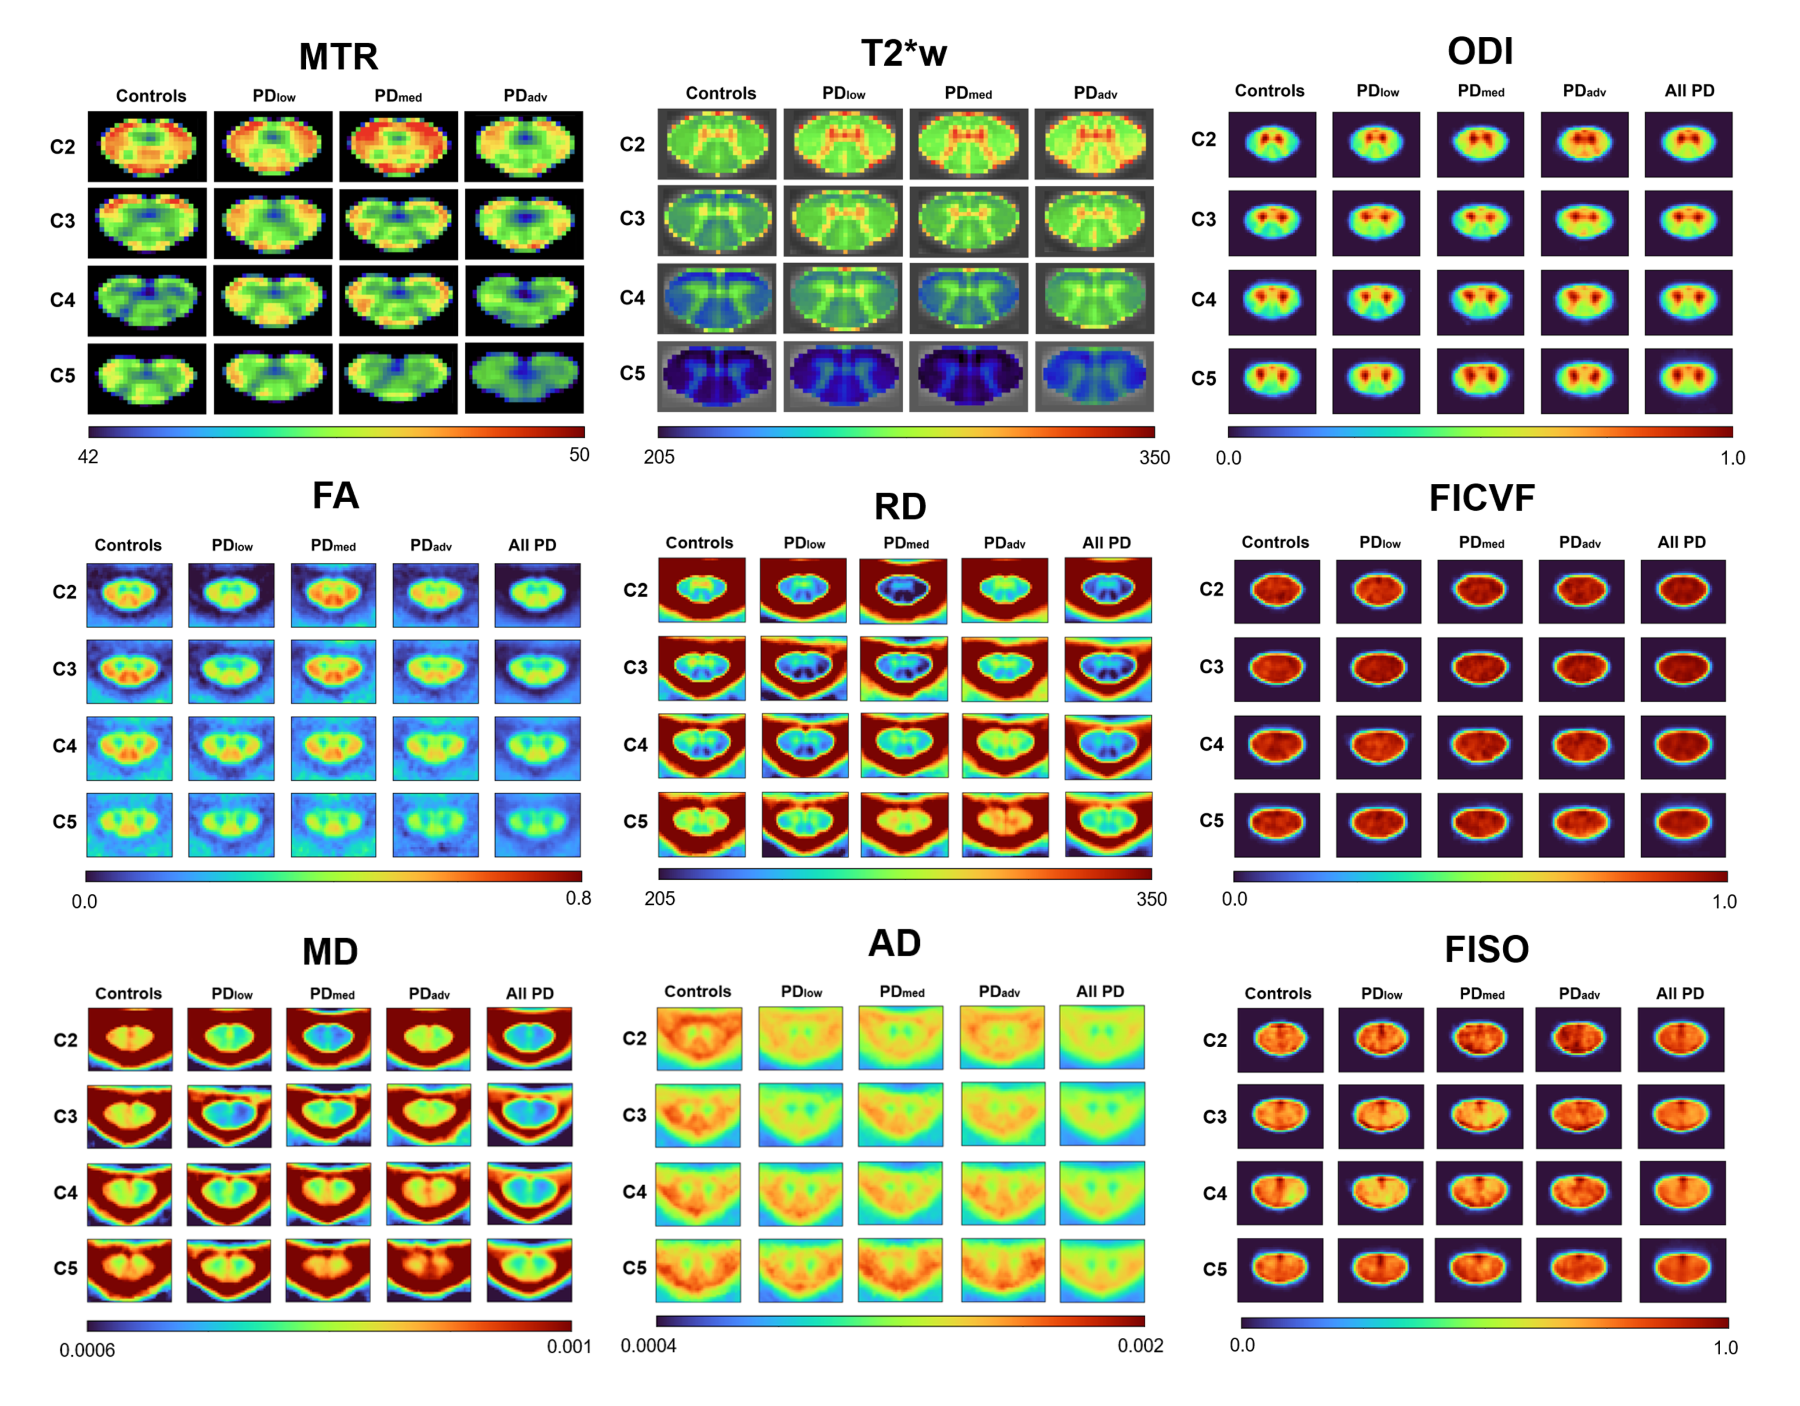
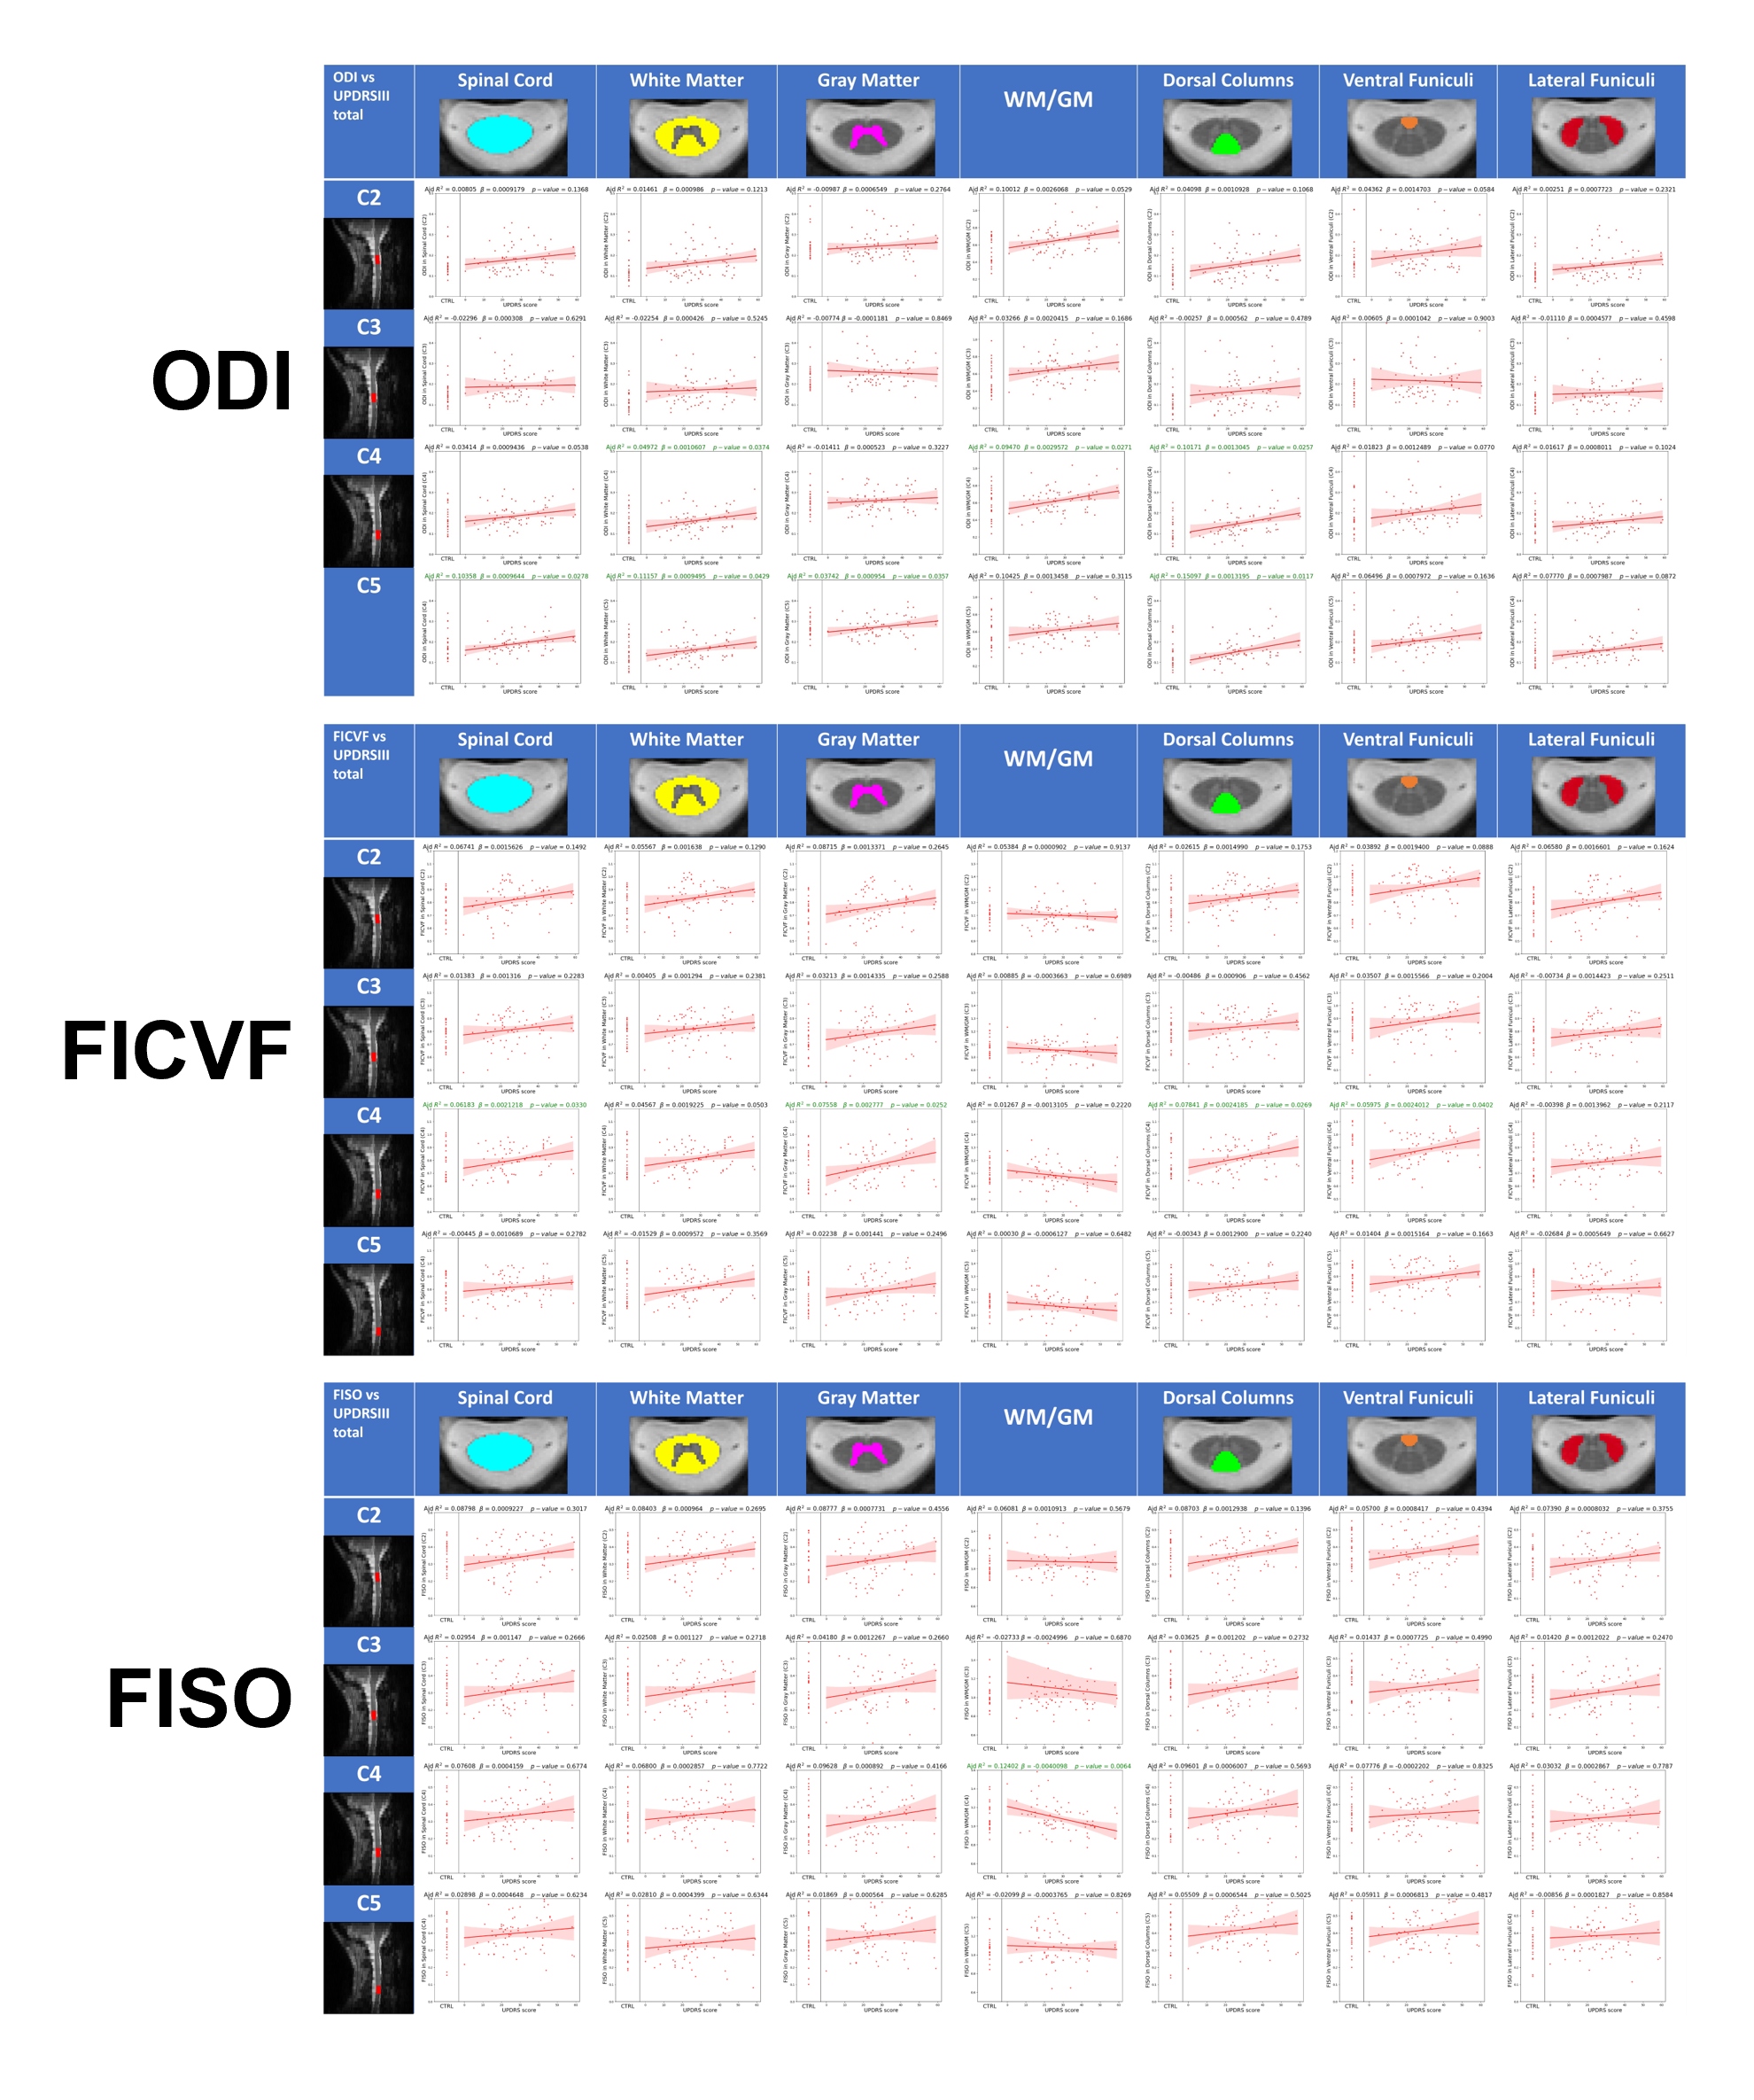
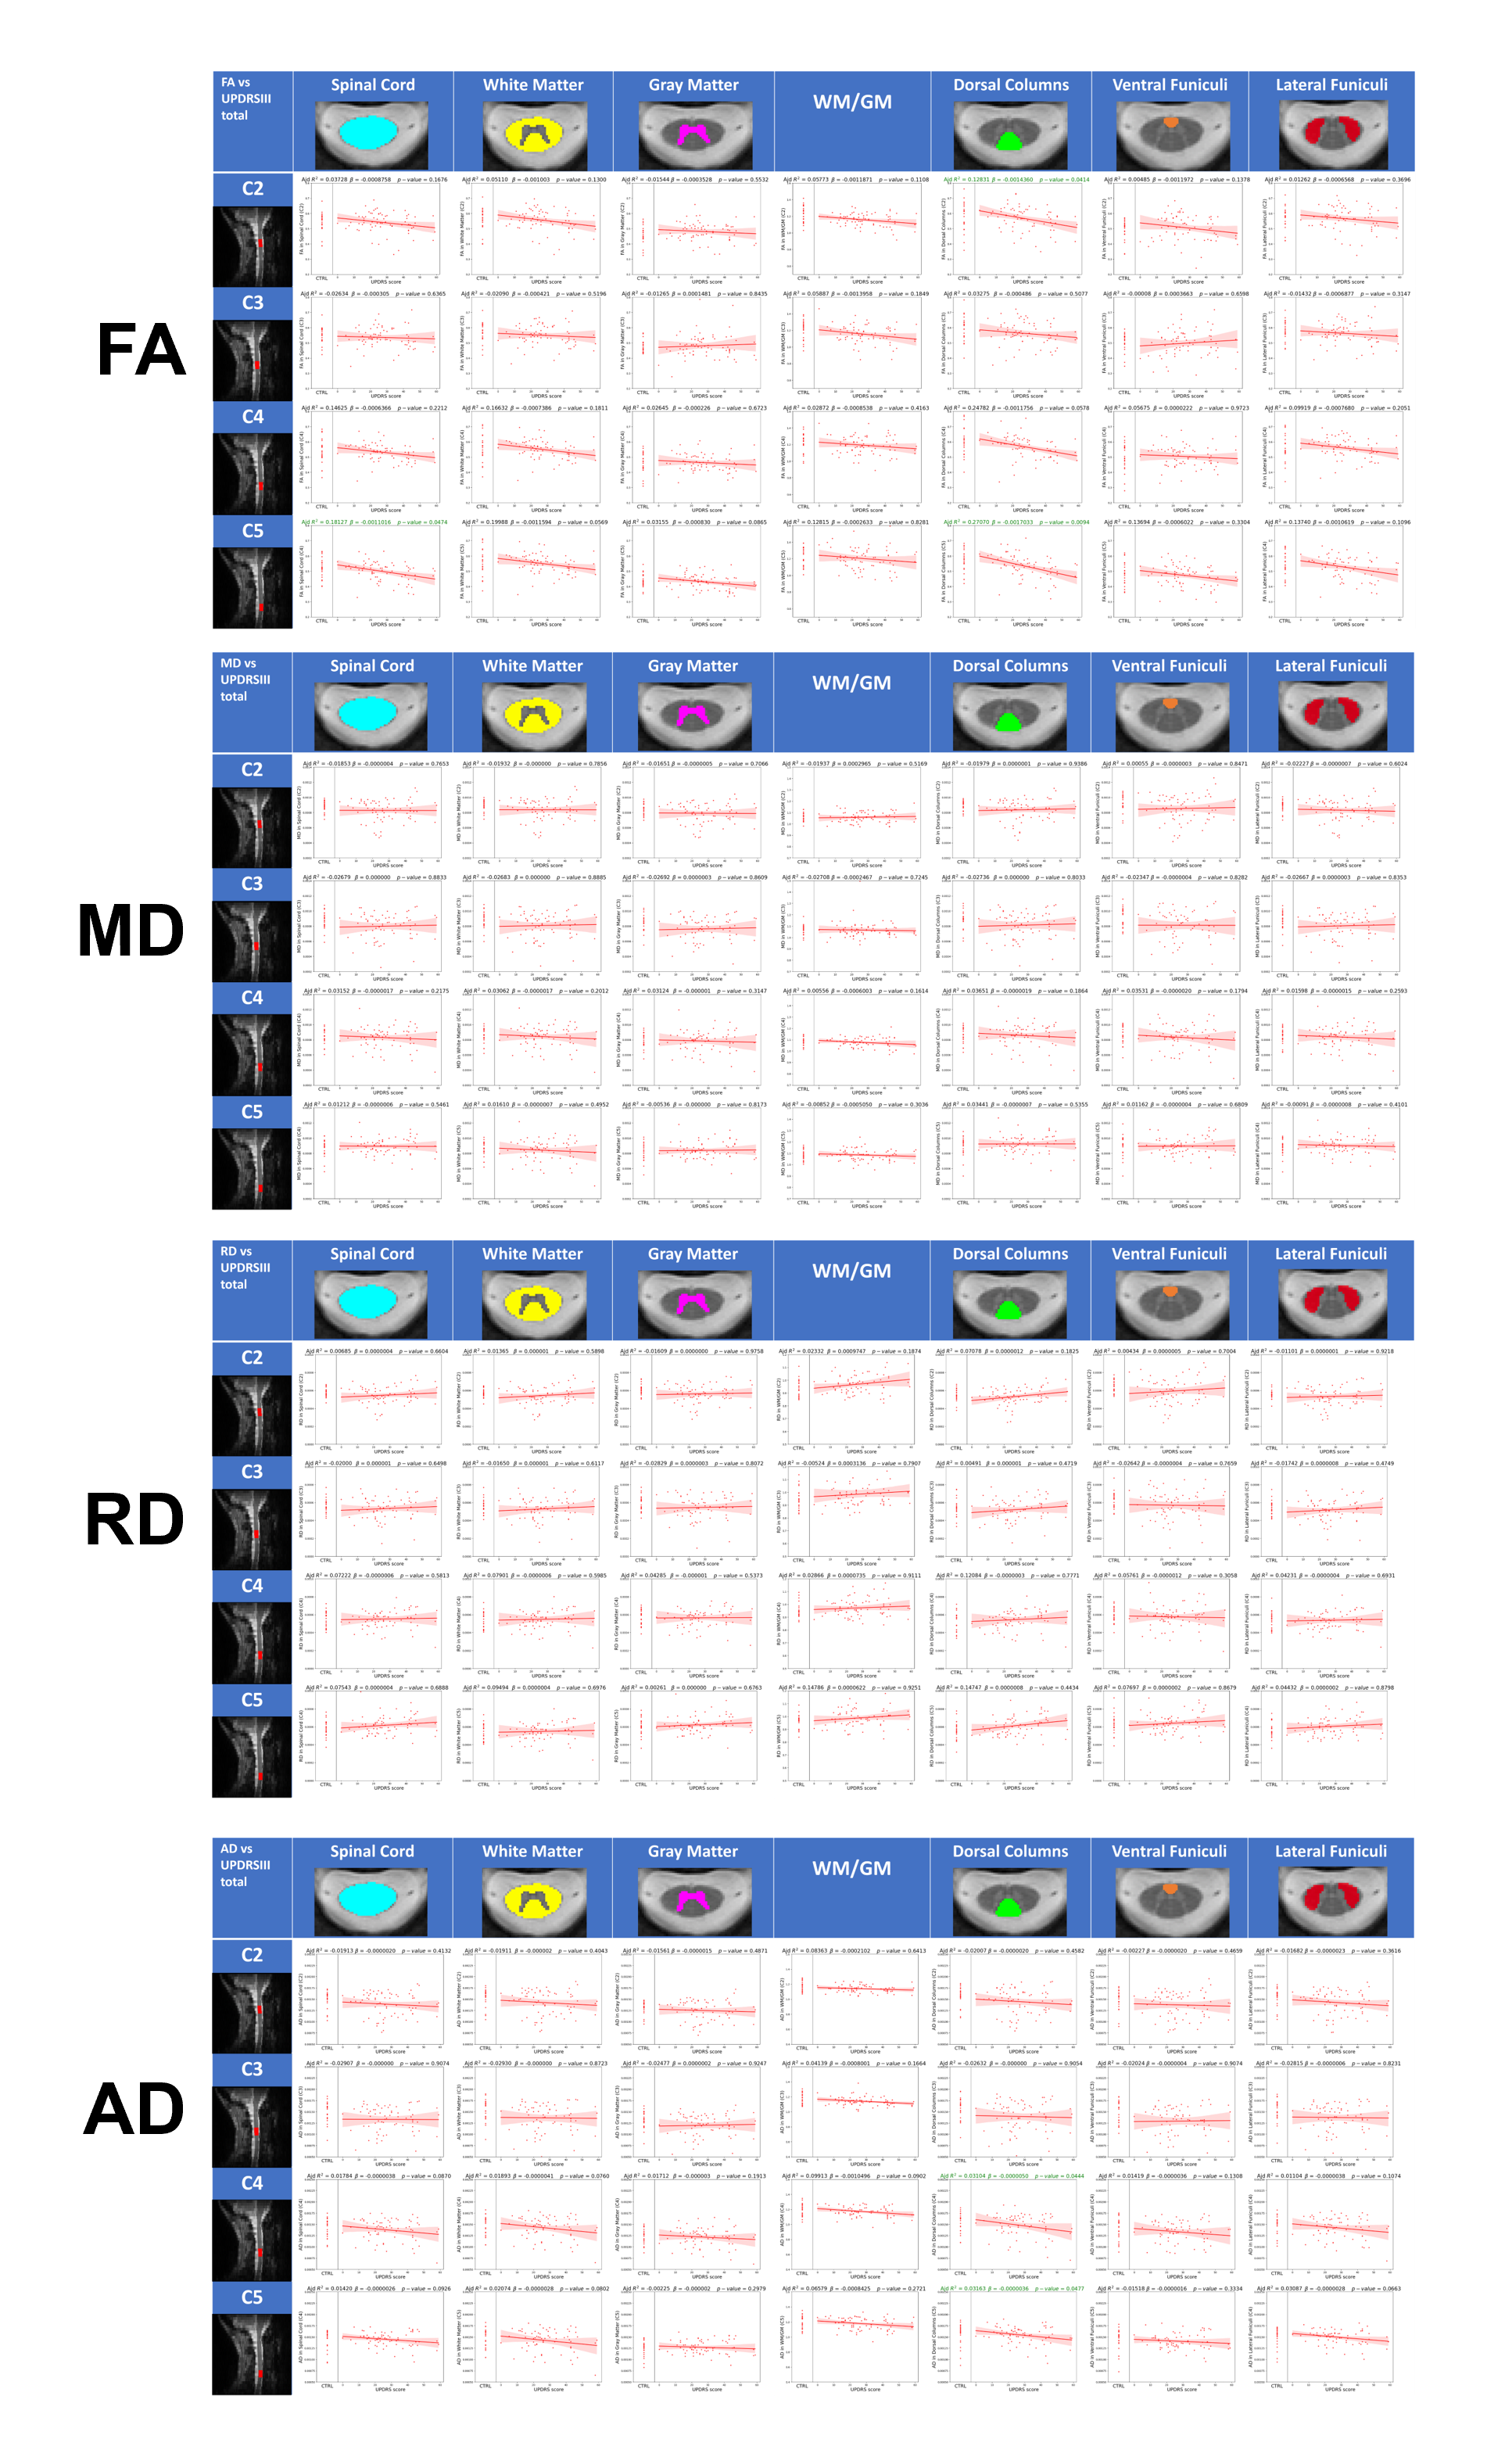
In this exploratory study, we aim to establish magnetization transfer ratio (MTR), T2*-weighted (T2*w) and diffusion-weighted imaging (DWI) metrics for exploring microstructural alterations in the spinal cord in the context of PD. In this study, we compare these metrics in a PD population and in healthy controls, using the same participants as Landelle et al.4. Participants were scanned at the Montreal Neurological Institute-Hospital under the C-BIG repository (parameters shown in Figure 1A). Those with PD were divided into PDlow, PDmed and PDadv categories according to their motor symptoms component assessed using the Unified Parkinson’s Disease Rating Scale (UPDRS)5(Figure 1B). For the DWI images, both DTI6 and NODDI7 models were used, from which we explored the orientation dispersion index (ODI), intracellular volume fraction (FICVF), isotropic volume fraction (FISO), fractional anisotropy (FA), mean diffusivity (MD), axial diffusivity (AD) and radial diffusivity (RD).Individual images were pre-processed using the Spinal Cord Toolbox8, then registered to the PAM50 template9 to generate average group-level metric maps. The PAM50 atlas9 was then registered to the participant space to extract metrics inside the spinal cord and subregions. Metric values were compared with UPDRS scores using an ordinary least squares regression model with age correction to ensure the observed effects were due to disease progression and not to aging.
Results
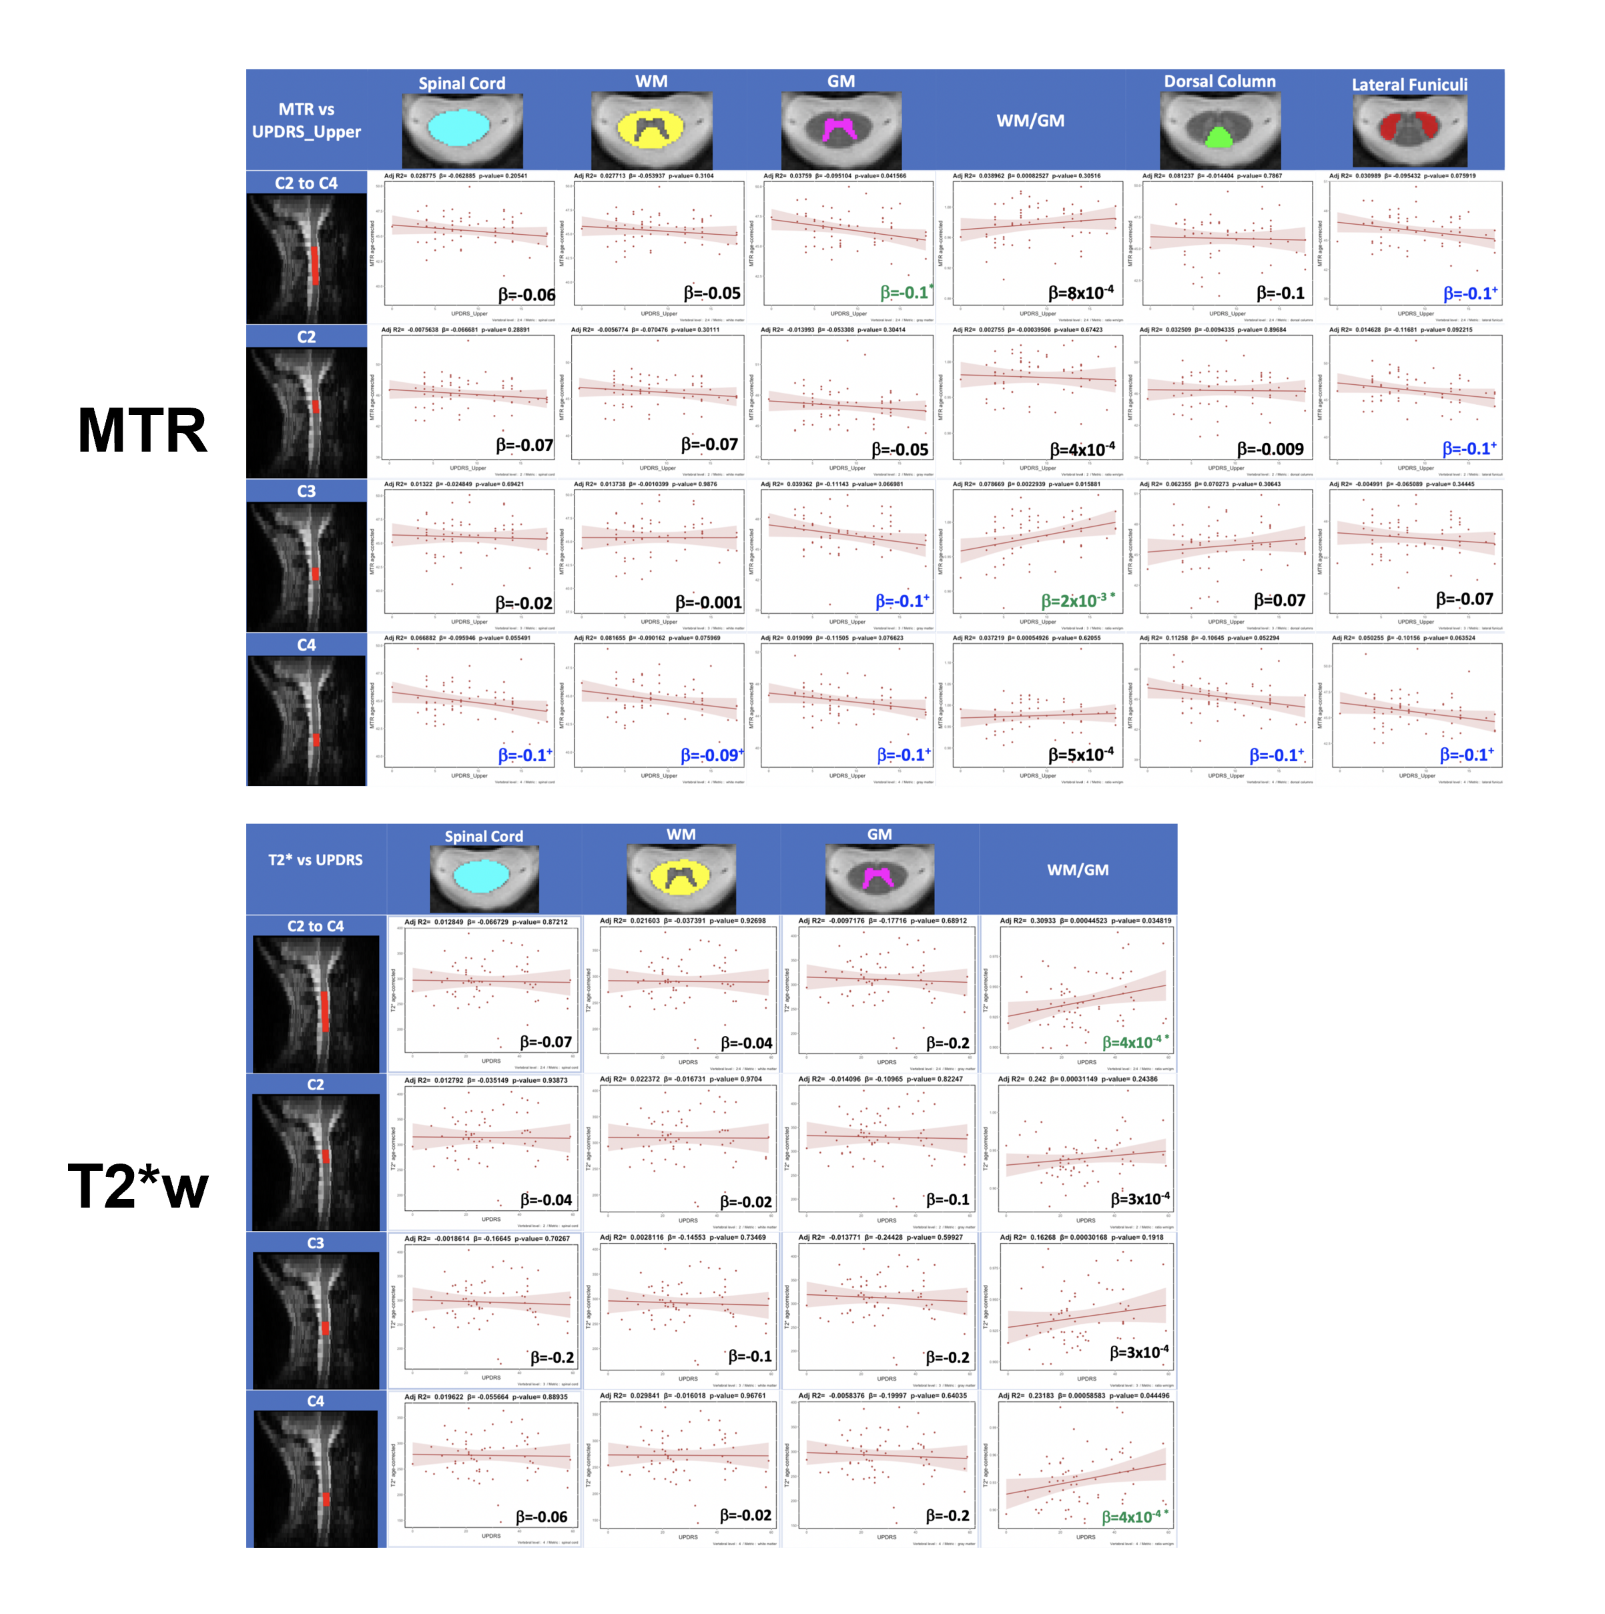
Average metric maps (Figure 2) suggest an increase in ODI and a decrease in FA in the white matter in PD participants compared to healthy individuals. We also notice a decrease in the global intensity as we progress through the more caudal vertebral levels, which is very apparent in T2*w, MTR and FA maps. Results in Figure 3 show a significant increase in ODI in the white matter at C4 and C5 levels, and a significant increase in FICVF in the spinal cord, white matter and gray matter at C4. For FA (Figure 4), a global decrease is observed, although only significant for the spinal cord and dorsal columns at C5. Results for MTR show a significant decrease in the gray matter for C2 to C4 combined (Figure 5). As for T2*w, a significant increase was observed in the white matter to gray matter ratio for C4 and for combined C2 to C4 levels.Discussion
In the brain, studies have reported lower values for FICVF and ODI in the substantia nigra pars compacta in subjects with PD10,11, which is suspected to be linked to the loss of dopaminergic neurons that is associated with PD in the brain11. However, to our knowledge, no existing work has shown neuronal loss related to PD in the spinal cord. Post-mortem studies have demonstrated an increase in 𝛼-synuclein in the PD spinal cord12. Furthermore, Del Tredici & Braak12 found globules filled with 𝛼-synuclein in subjects with advanced PD, instead of small varicosities in earlier stages. These findings are consistent with those of Sekigawa et al.13, who observed axonal swelling related to 𝛼-synuclein in the spinal cord of transgenic mice. These results suggest that the spinal cord is indeed affected by PD, hence the relevance of studying its microstructure in PD patients. Further studies will be needed to better understand the relationship between the microstructural changes suggested by the MR metrics in the spinal cord and identify potential biomarkers for the early diagnosis of PD in the spinal cord.Conclusion
In conclusion, this exploratory study is the first to establish values for MTR, T2*w and DWI metrics in the spinal cord of a population with PD. Significant correlations between these metrics and the UPDRS score were found in several regions of the spinal cord, particularly for ODI, FICVF and FA at the C4 and C5 vertebral levels, suggesting the relevance of further studying these metrics in the PD spinal cord. Further analyses of these metrics could lead to identifying potential biomarkers of PD in the spinal cord and gain a better understanding of this disease in the central nervous system.Acknowledgements
This work is supported by the TransMedTech Institute, thanks to the financial support of the Canada First Research Excellence Fund and the Fonds de recherche du Québec, the Fondation Courtois, the Natural Sciences and Engineering Research Council of Canada (NSERC), and Polytechnique Montreal. We thank the Clinical, Biospecimen, Imaging & Genetic (C-BIG) repository for help in participant recruitment and the brain imaging centre of The Neuro for help in data acquisition. We thank all participants involved in this study.References
1. Nyatega CO, Qiang L, Adamu MJ, Kawuwa HB. Gray matter, white matter and cerebrospinal fluid abnormalities in Parkinson’s disease: A voxel-based morphometry study. Front Psychiatry. 2022 ;13.2. Bianco CL, Ridet JL, Schneider BL, Déglon N, Aebischer P. α-Synucleinopathy and selective dopaminergic neuron loss in a rat lentiviral-based model of Parkinson’s disease. 2002.
3. Nardone R, Höller Y, Brigo F, Versace V, Sebastianelli L, Florea C, et al. Spinal cord involvement in Lewy body-related α-synucleinopathies. J Spinal Cord Med. 2020;43(6):832–45.
4. Landelle C, Dahlberg LS, Lungu O, Misic B, De Leener B, Doyon J. Altered Spinal Cord Functional Connectivity Associated with Parkinson’s Disease Progression. Mov Disord. 2023;38(4):636–45.
5. Movement Disorder Society Task Force on Rating Scales for Parkinson’s Disease. The Unified Parkinson’s Disease Rating Scale (UPDRS): status and recommendations. Mov Disord Off J Mov Disord Soc. 2003 Jul;18(7):738–50.
6. O’Donnell LJ, Westin CF. An Introduction to Diffusion Tensor Image Analysis. Neurosurg Clin N Am. 2011 Apr 1;22(2):185–96.
7. Zhang H, Schneider T, Wheeler-Kingshott CA, Alexander DC. NODDI: Practical in vivo neurite orientation dispersion and density imaging of the human brain. NeuroImage. 2012 Jul 16;61(4):1000–16.
8. De Leener B, Lévy S, Dupont SM, Fonov VS, Stikov N, Louis Collins D, et al. SCT: Spinal Cord Toolbox, an open-source software for processing spinal cord MRI data. NeuroImage. 2017 Jan 15;145(Pt A):24–43.
9. De Leener B, Fonov VS, Collins DL, Callot V, Stikov N, Cohen-Adad J. PAM50: Unbiased multimodal template of the brainstem and spinal cord aligned with the ICBM152 space. NeuroImage. 2018 Jan 15;165:170–9.
10. Kamagata K, Hatano T, Okuzumi A, Motoi Y, Abe O, Shimoji K, et al. Neurite orientation dispersion and density imaging in the substantia nigra in idiopathic Parkinson disease. Eur Radiol. 2016 Aug 1;26(8):2567–77.
11. Kamagata K, Hatano T, Aoki S. What is NODDI and what is its role in Parkinson’s assessment? Expert Rev Neurother. 2016 Mar 3;16(3):241–3.
12. Del Tredici K, Braak H. Spinal cord lesions in sporadic Parkinson’s disease. Acta Neuropathol (Berl). 2012 Nov 1;124(5):643–64.
13. Sekigawa A, Takamatsu Y, Sekiyama K, Hashimoto M. Role of α- and β-Synucleins in the Axonal Pathology of Parkinson’s Disease and Related Synucleinopathies. Biomolecules. 2015 May 19;5(2):1000–11.
Figures