1060
High Resolution R1rho Dispersion Imaging in Swine Spinal Cord: A Specimen Study1Gilbert Classical Academy, Gilbert, AZ, United States, 2Desert Vista High School, Phoenix, AZ, United States, 3Neuroimaging Innovation Center, Barrow Neurological Institute, Phoenix, AZ, United States, 4Creighton University School of Medicine, Phoenix, AZ, United States, 5Arizona State University, Phoenix, AZ, United States, 6Translational Neuroscience, Barrow Neurological Institute, Phoenix, AZ, United States
Synopsis
Keywords: Spinal Cord, Relaxometry, T1rho dispersion
Motivation: R1rho imaging can provide novel information on dynamic processes within tissues, allowing for a more comprehensive analysis of the parameters of chemical exchange and/or intrinsic microstructure.
Goal(s): To examine the feasibility of R1rho imaging in spinal cord.
Approach: We performed high resolution R1rho imaging in the swine spinal cord of swine spine specimens.
Results: The results showed that the dispersion is measurable in both spinal white matter and gray matter, suggesting that R1rho dispersion may have potential to characterize the de/remyelination and nerve injuries/repairs in neurological disorders.
Impact: The study suggested that R1rho dispersion is measurable in spinal cord, which may have potential to characterize the de/remyelination and nerve injuries/repairs in spinal cord disorders.
INTRODUCTION
The spinal cord is an extension of the central nervous system, which consists of the brain and spinal cord. The spinal cord begins at the bottom of the brain stem (and ends in the lower back, as it tapers to form a cone called the conus medullaris. Like brain, the spinal cord is also composed of white matter (WM) and gray matter (GM). The gray matter of the spinal cord is a butterfly-shaped structure made up of neuronal cell bodies, glial cells and neuropile, while white matter consists of axons and myelin, and plays a key role in nerve cells' ability to connect to one another1. Dispersion of R1rho provides novel information on dynamic processes within tissues, providing a more comprehensive analysis of the parameters of chemical exchange and/or intrinsic microstructure. Previous studies suggested that at higher static fields (3T and beyond) R1rho is strongly influenced by chemical exchange processes and diffusion within field inhomogeneities2-4. Our recent studies suggest that at high fields (≥ 3T) R1rho dispersion specifically reflects the contribution of chemical exchange to transverse relaxation, and likely reflects the concentration of exchangeable species in tissue that exchange at an appropriate rate5-7. R1rho dispersion has been used previously in tissues to assess glycosaminoglycan (GAG, a side chain of proteoglycan) content, but it has not been used in spinal white matter and gray matter. In this study, we examined high resolution R1rho dispersion imaging in swine spine specimens to evaluate the feasibility of using R1rho dispersion in the future applications of neurological disorders.METHODS
Experiments were performed on a Philips 3T Ingenia scanner (Philips Healthcare, Best, The Netherlands). Fresh swine spine specimens were obtained from the neurosurgery research lab at the Barrow Neurological Institute. After removing debris, blood, muscle, and connective tissue, the specimen was soaked in PBS (phosphate buffered saline) solution for two days before MRI. During imaging the specimen was placed into a container containing a PBS solution to prevent dehydration and data was acquired with a 32-channel head coil (Philips Healthcare). A B0/B1 inhomogeneity self-compensated R1rho pre-pulse sequence8 was used to create R1rho contrast followed by Turbo Spin Echo (TSE) data acquisition. A single axial slice covering the spinal cord area was chosen for imaging, with FOV: 245×245mm2, pixel size: 0.35x0.35 mm2, slice thickness: 4mm, TR/TE=3000ms/74ms, TSE factor=16, linear profile, averages = 2. Four spin-lock times (TSLs) [1ms, 11ms, 21ms, 31ms] were combined into a single scan for R1rho calculations, resulting in a scan time of 10m27s. The R1rho experiment was repeated at different spin-lock frequencies (FSLs) [0Hz, 100Hz, 200Hz, 300Hz, 400Hz, 500Hz] to evaluate the R1rho dispersion in the disc pre- and post-treatment. After acquisition, a R1rho map at each spin-lock frequency was calculated by fitting the signal intensity vs TSL to a three-parameter mono-exponential model S = S0·exp(-TSL· R1rho) on a pixel-wise basis. Median values of the R1rho in the spinal white matter and gray matter were extracted for displaying the dispersion curves.RESULTS
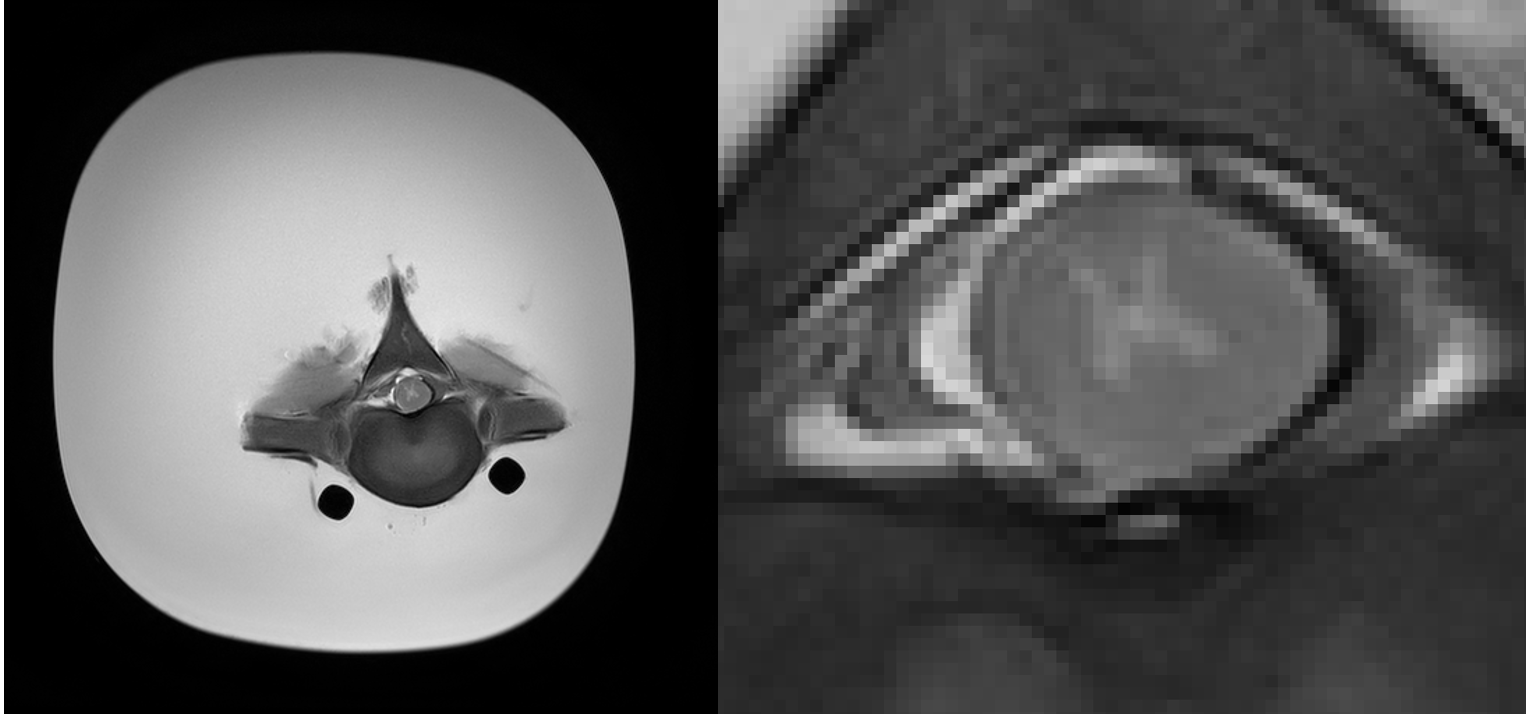
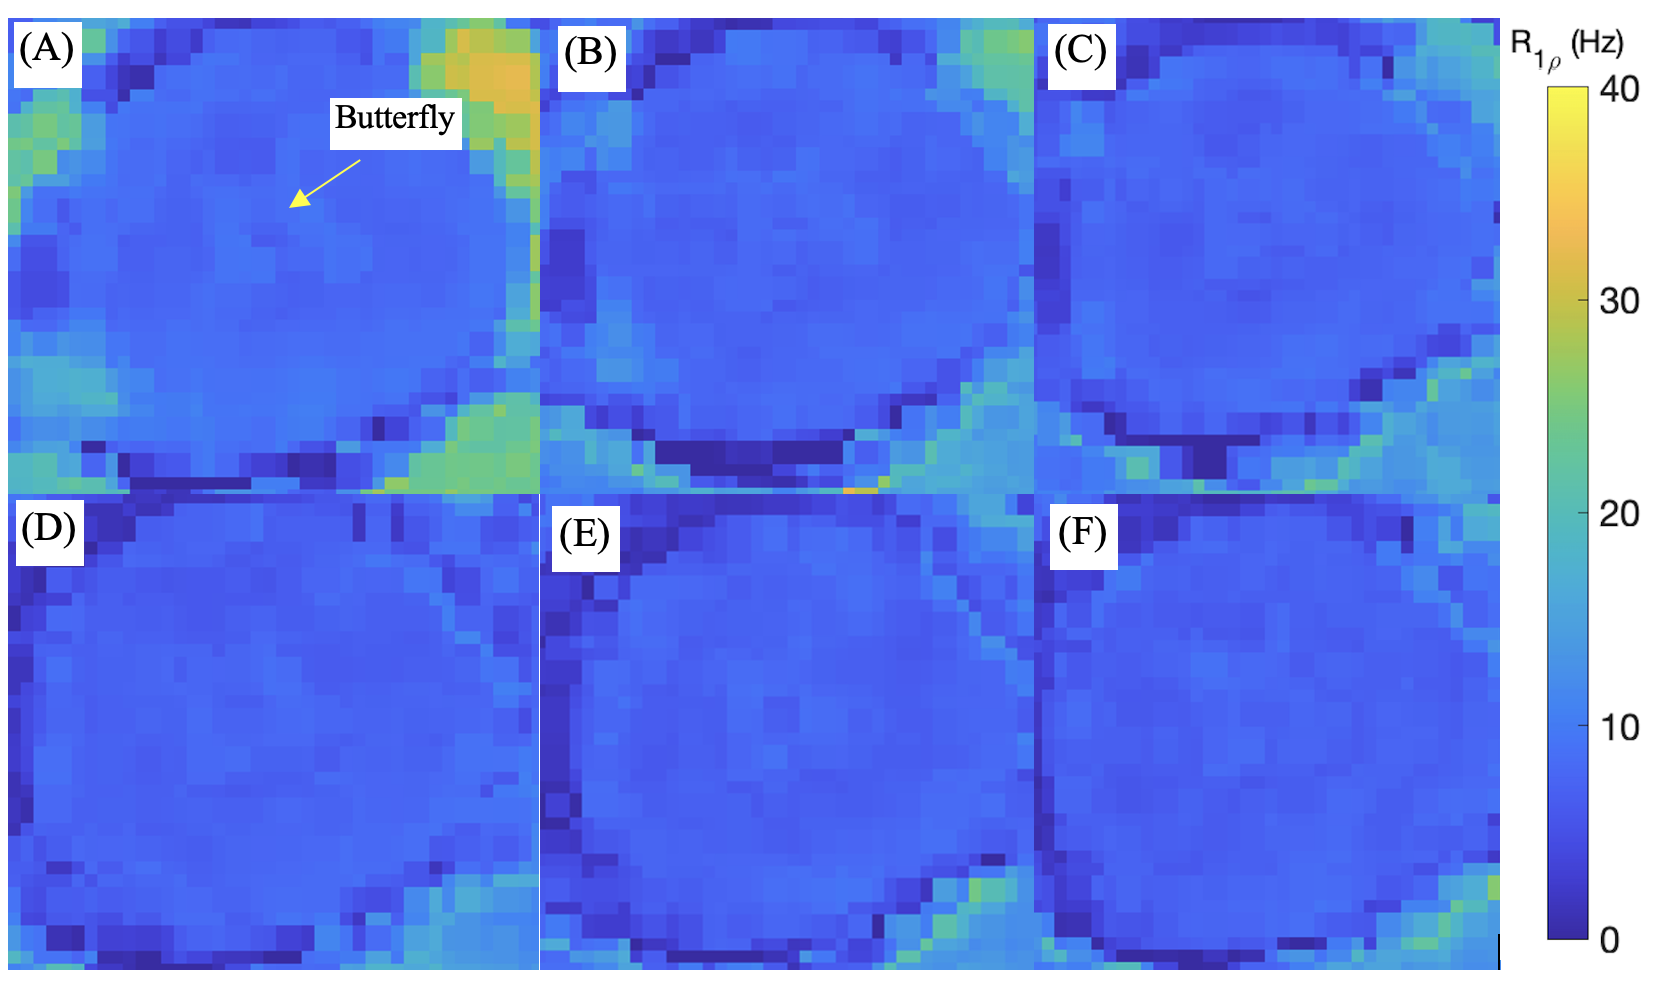
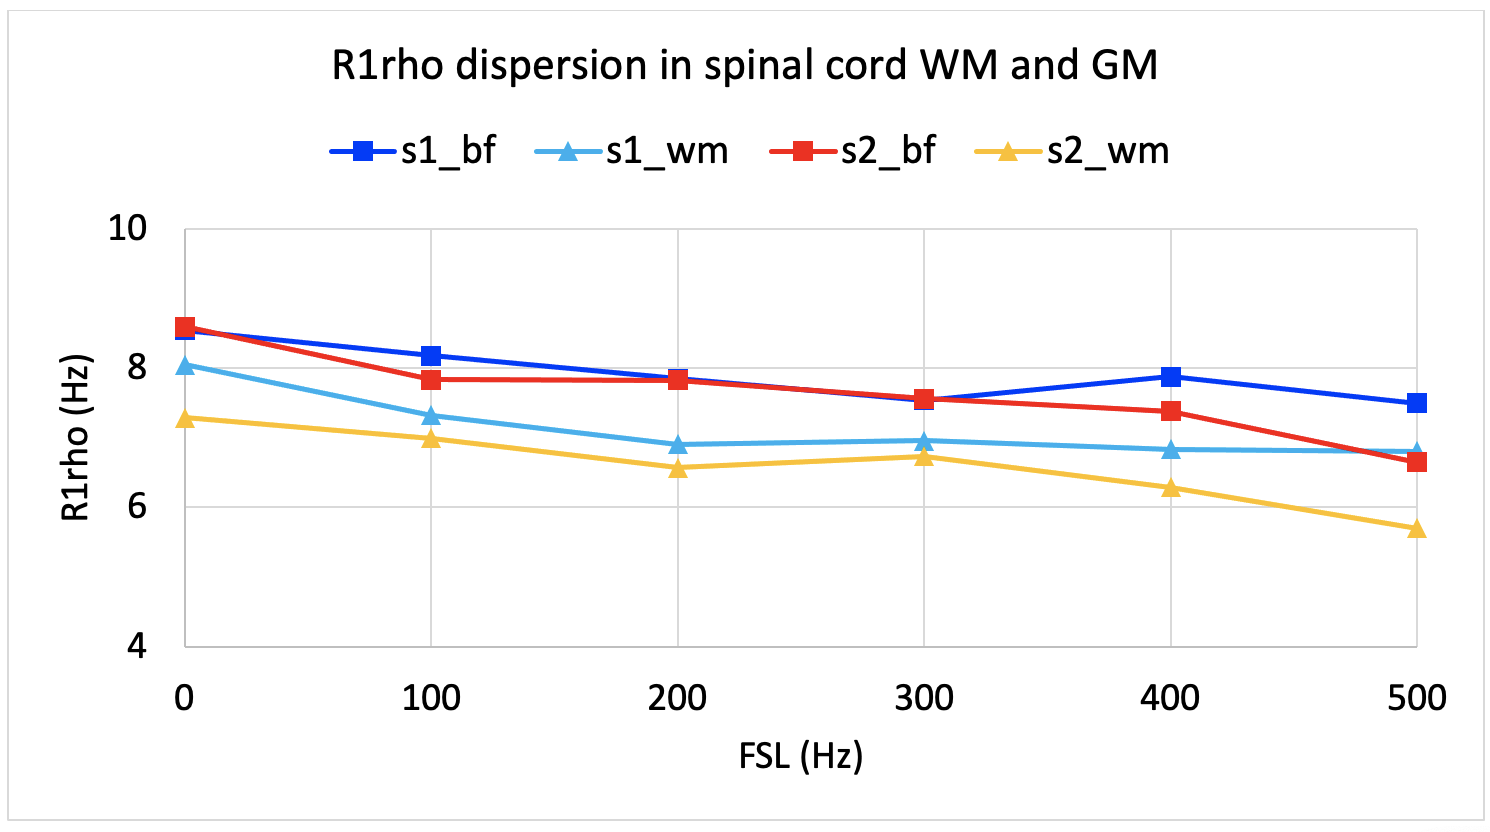
Fig. 1 shows an example of the T2W image of a specimen, as well as the zoom-in image to show the spinal cord. Fig. 2 shows the R1rho maps of one sample under a range of spin-lock frequencies (0 – 500Hz). In addition, the R1rho dispersion curves in both spinal white matter and gray matter butterfly of the two specimens were plotted in Fig.3. It is seen an overall decrease of R1rho with the FSL.DISCUSSION
This preliminary study tested high resolution (in-plane resolution 0.35x0.35mm2) R1rho imaging in spinal white matter and gray matter in swine spine specimens. The results showed differences in R1rho between WM and GM; and overall, GM (butterfly) appeared to have greater R1rho values than that of WM. The study demonstrated that R1rho dispersion was measured at 3T in both the spinal WM and GM. Since the spinal cord consists of richer exchangeable hydroxyl protons associated with cholesterol in myelin, the results from the study suggest that R1rho dispersion may have potential to characterize the de/remyelination and nerve injuries/repairs in spinal cord disorders. To the best of our know knowledge, this was the first study to perform high resolution R1rho dispersion in the spinal white matter and gray matter.CONCLUSION
The study investigated high resolution R1rho dispersion imaging in spinal WM and GM in swine spine specimens. The results showed that the dispersion was measurable in both WM and GM and overall, GM (butterfly) has greater R1rho values than that of WM.Acknowledgements
The work was supported by the Barrow Neurological Foundation (455003033568).References
1. Anatomy of the Spine and Peripheral Nervous System. https://www.aans.org/en/Patients/Neurosurgical-Conditions-and-Treatments/Anatomy-of-the-Spine-and-Peripheral-Nervous-System. Accessed November 9, 2021.
2. Duvvuri U, Goldberg AD, Kranz JK, et al. Water magnetic relaxation dispersion in biological systems: the contribution of proton exchange and implications for the noninvasive detection of cartilage degradation. Proc Natl Acad. 2001; 98(22): 12479-12484.5. Cobb J, Li K, Xie J, et al. Exchange-mediated contrast in CEST and spin-lock imaging. MRI. 2014; 32(1):28-40. 2015;7(12):1269-1281.
3. Cobb JG, Xie J, Gore JC. Contributions of chemical exchange to T1rho dispersion in a tissue model. Magn Reson Med. 2011; 66(6):1563-1571.
4. Hills BP, Babonneau F. A quantitative study of water proton relaxation in packed beds of porous particles with varying water content. Magn Reson Imaging. 1994; 12(6): 909-922.
5. Cobb JG, Xie J, Gore JC. Contributions of chemical and diffusive exchange to T1rho dispersion. Magn Reson Med. 2013; 69(5):1357-1366.
6. Wang P, Block J, Gore JC. Chemical exchange in knee cartilage assessed by R1rho (1/T1rho) dispersion at 3T. Magn Reson Imaging. 2015; 33(1): 38-42.
7. Wang P, Zhu H, Kang H, Gore JC. R1rho dispersion and sodium imaging in human calf muscle. Magn Reson Imaging. 2017; 42:139-143.
8. Witschey WR, Borthakur A, Elliott MA, et al. Artifacts in T1rho-weighted imaging: compensation for B1 and B0 field imperfections. J Magn Reson. 2007;186(1): 75-85.
Figures