1056
Increased brain iron deposition in the basial ganglia is associated with cognitive and motor dysfunction in type 2 diabetes1Department of Radiology, Shandong Provincial Hospital Affiliated to Shandong First Medical University, Jinan, China, 2Department of Psychiatry and Psychotherapy, Jena University Hospital; Center for Intervention and Research on adaptive and maladaptive brain Circuits underlying mental health (C-I-R-C)., Jena, Germany, 3Department of Radiology, Weill Cornell Medical College, New York, NY, United States, 4Department of Radiology, Beijing Tsinghua Changgung Hospital, Beijing, China
Synopsis
Keywords: Peripheral Nerves, Neurodegeneration, quantitative susceptibility mapping, type 2 diabetes, diabetic peripheral neuropathy, motor dysfunction
Motivation: Diabetes is thought to be related to an imbalance in iron homeostasis and abnormal iron accumulation.
Goal(s): To explore the changing mode of brain iron metabolism in basal ganglia in type 2 diabetes (T2DM) patients with diabetic peripheral neuropathy (DPN) and diabetes without DPN (NDPN) using quantitative susceptibility mapping (QSM).
Approach: Brain iron of T2DM was assessed using QSM.
Results: Susceptibilities in the putamen and the caudate nucleus were higher in T2DM than in healthy controls, while there was no significant difference between the DPN and NDPN groups. Susceptibility of the putamen negatively correlated with moto- and cognitive function in T2DM.
Impact: Iron-based susceptibility in the putamen, measured by QSM, can reflect the motor function in patients with type 2 diabetes, and might hint micro pathological changes in brain tissue in patients with type 2 diabetes.
Introduction
Diabetes is thought to be related to an imbalance in iron homeostasis and abnormal iron accumulation [1]. Iron affects glucose metabolism through harmful effects on islet cells, and abnormalities in glucose metabolism destroy iron metabolic pathways [2]. However, as a common complication [3], the exact mechanism of brain iron metabolism in diabetic peripheral neuropathy (DPN) is unclear. High iron levels are associated with insulin resistance and oxidative and inflammatory stress [4, 5]. Oxidative and inflammatory stress may contribute irreparable harm to neurons, neuroglia, and vascular endothelial cells, which results in the development of DPN [6]. Therefore, it is vital to explore brain iron metabolic mechanisms in type 2 diabetes (T2DM), especially in DPN patients, and early to identify brain iron metabolic abnormalities and cognitive and motor functional changes. In this study, we sought to 1) use QSM to quantify the iron concentration and compare the differences among the DPN, diabetic without DPN (NDPN), and healthy control (HC) groups and 2) investigate the clinical factors relating to brain iron deposition and whether increased brain iron deposition contributes to motor dysfunction in T2DM.Methods
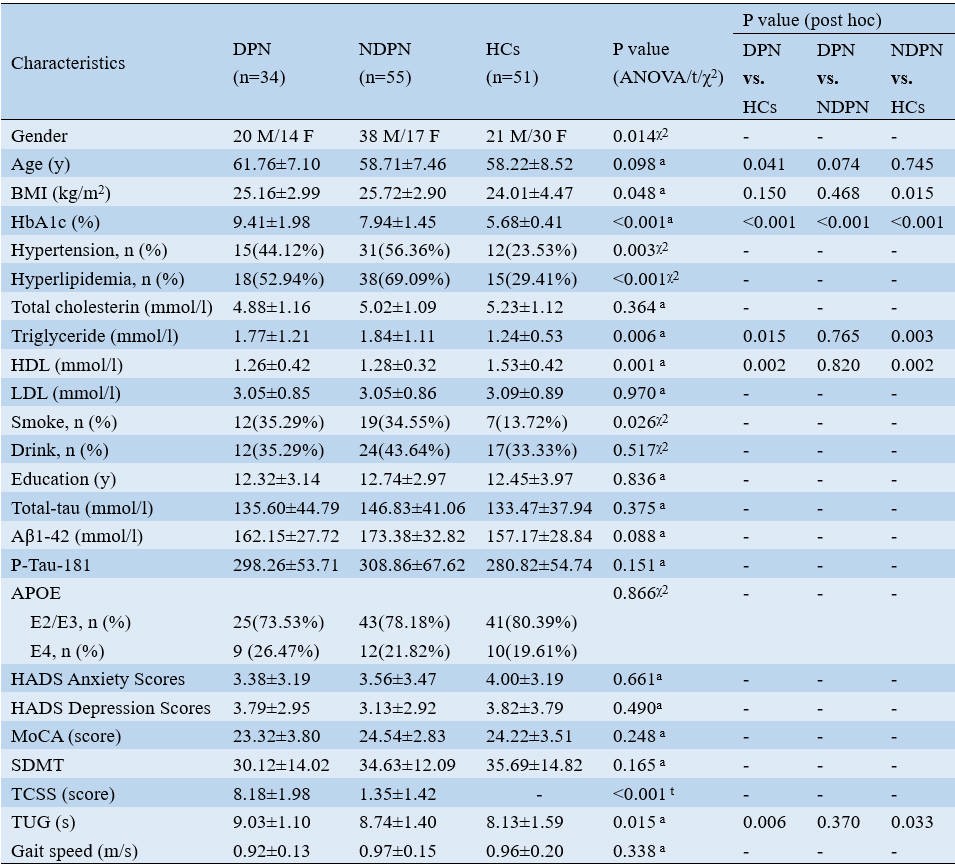
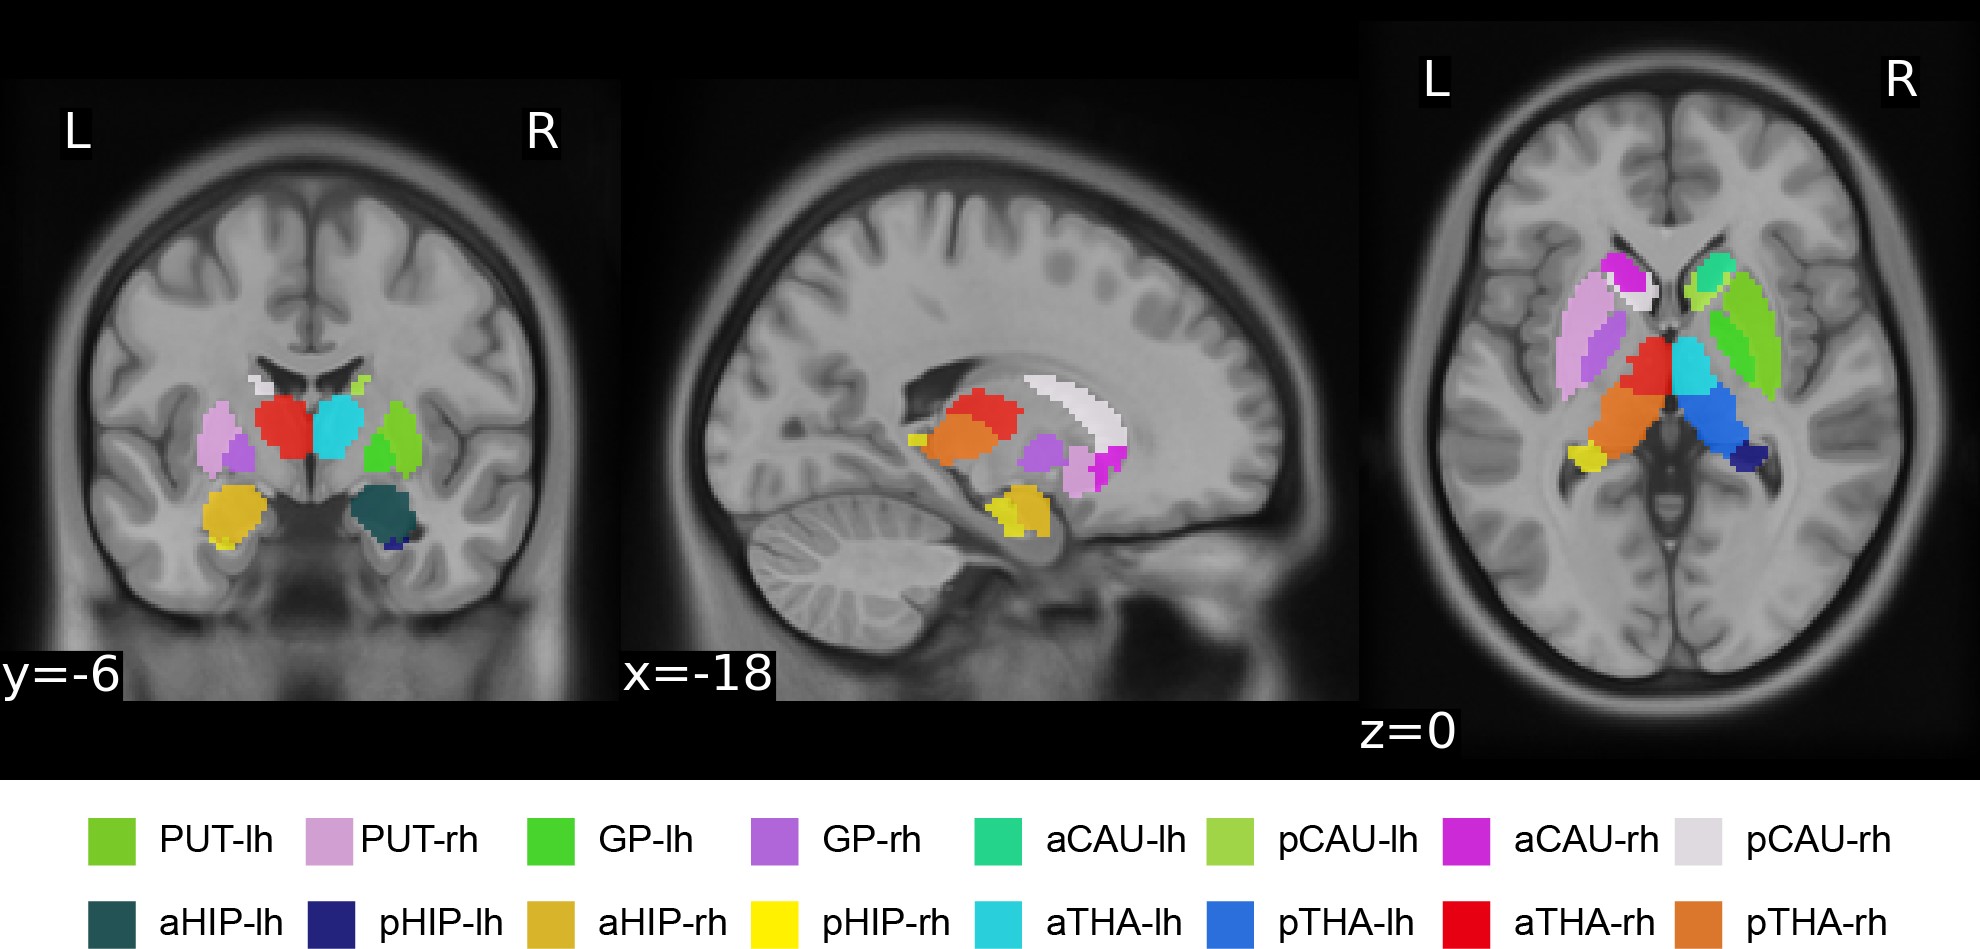
Thirty-four DPN patients, fifty-five NDPN patients, and fifty-one healthy controls (HCs) were recruited and underwent cognitive and motor assessments, blood biochemical tests, and brain QSM imaging. The clinical characteristics of the DPN, NDPN and HC groups are shown in Figure 1. QSM was utilized in the cerebral scanning protocol by the three-dimensional (3D) multi-echo gradient echo (ME-GRE) sequence. Brain QSM maps were generated from ME-GRE complex image data using morphology-enabled dipole inversion with an automatic uniform cerebrospinal fluid (CSF) zero reference algorithm (MEDI+0) [7]. Here, the basal ganglia parcellation was defined by the Melbourne Subcortex Atlas [8] (Figure 2). One-way ANOVA was applied to evaluate the cognitive and motor function scores, blood biochemical indicators and susceptibility values among the three groups. Then, multiple linear regression analysis was performed to identify the possible factors which influence brain iron deposition in T2DM.Results
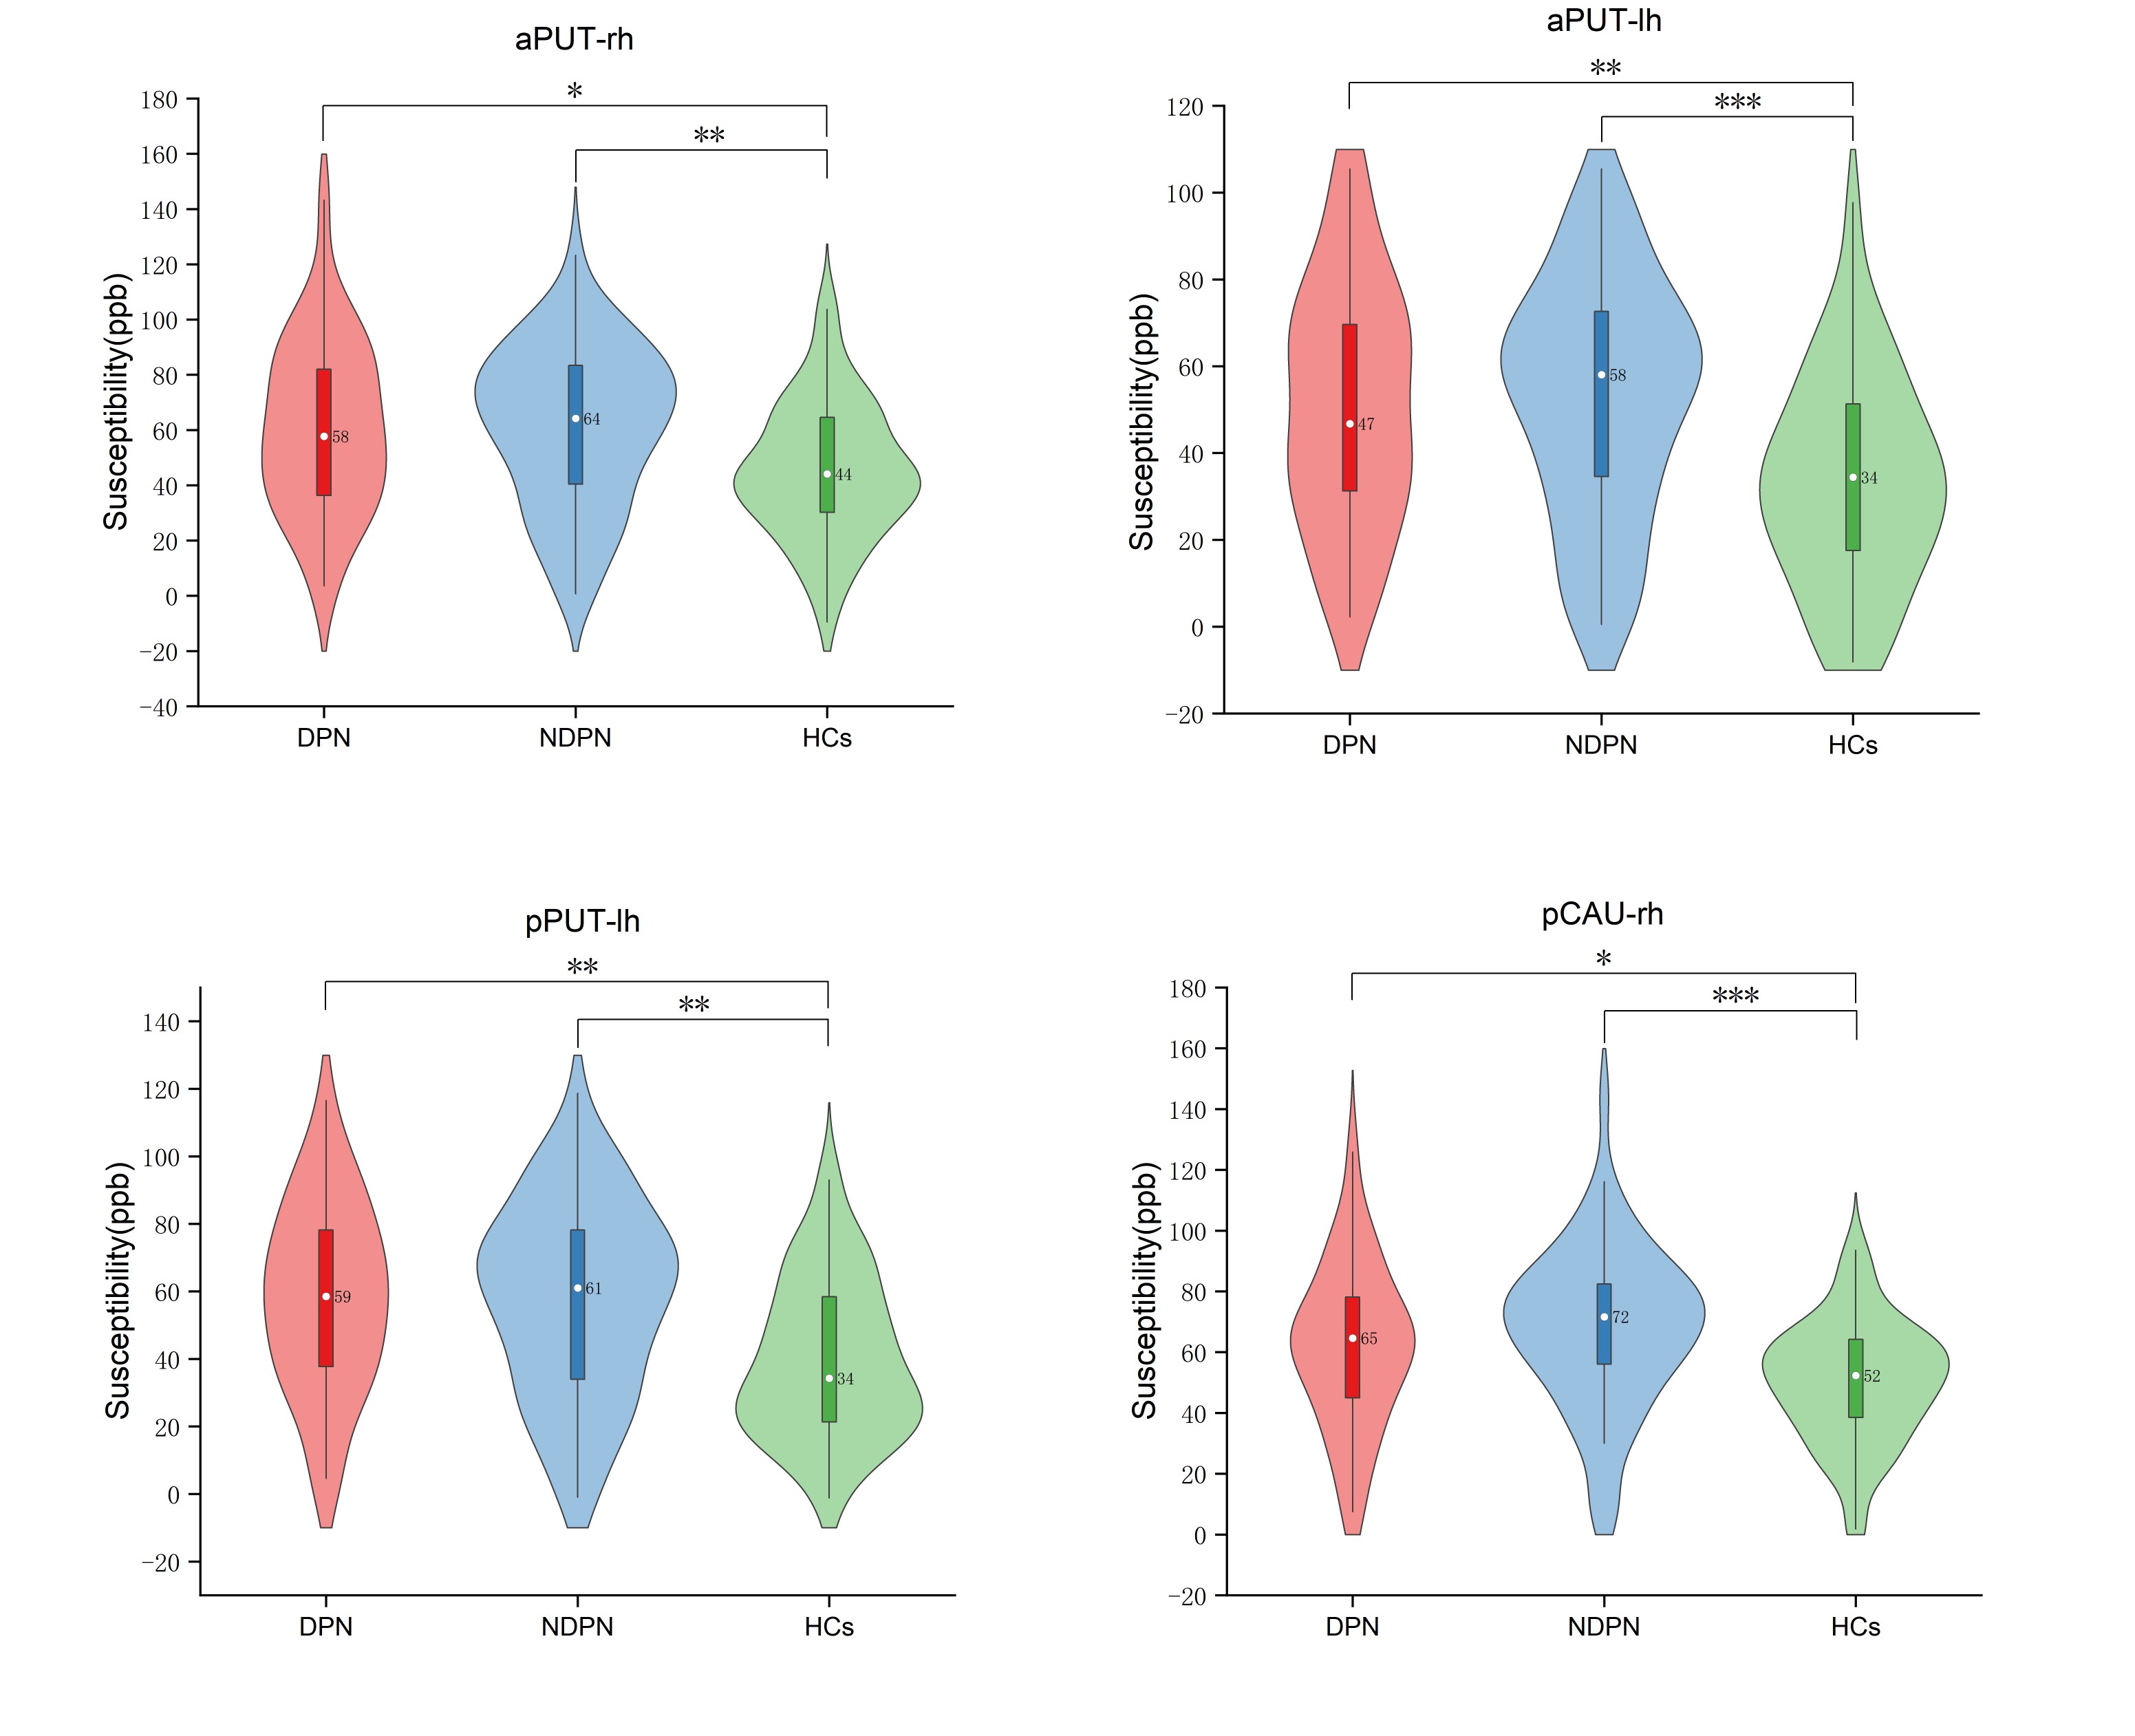
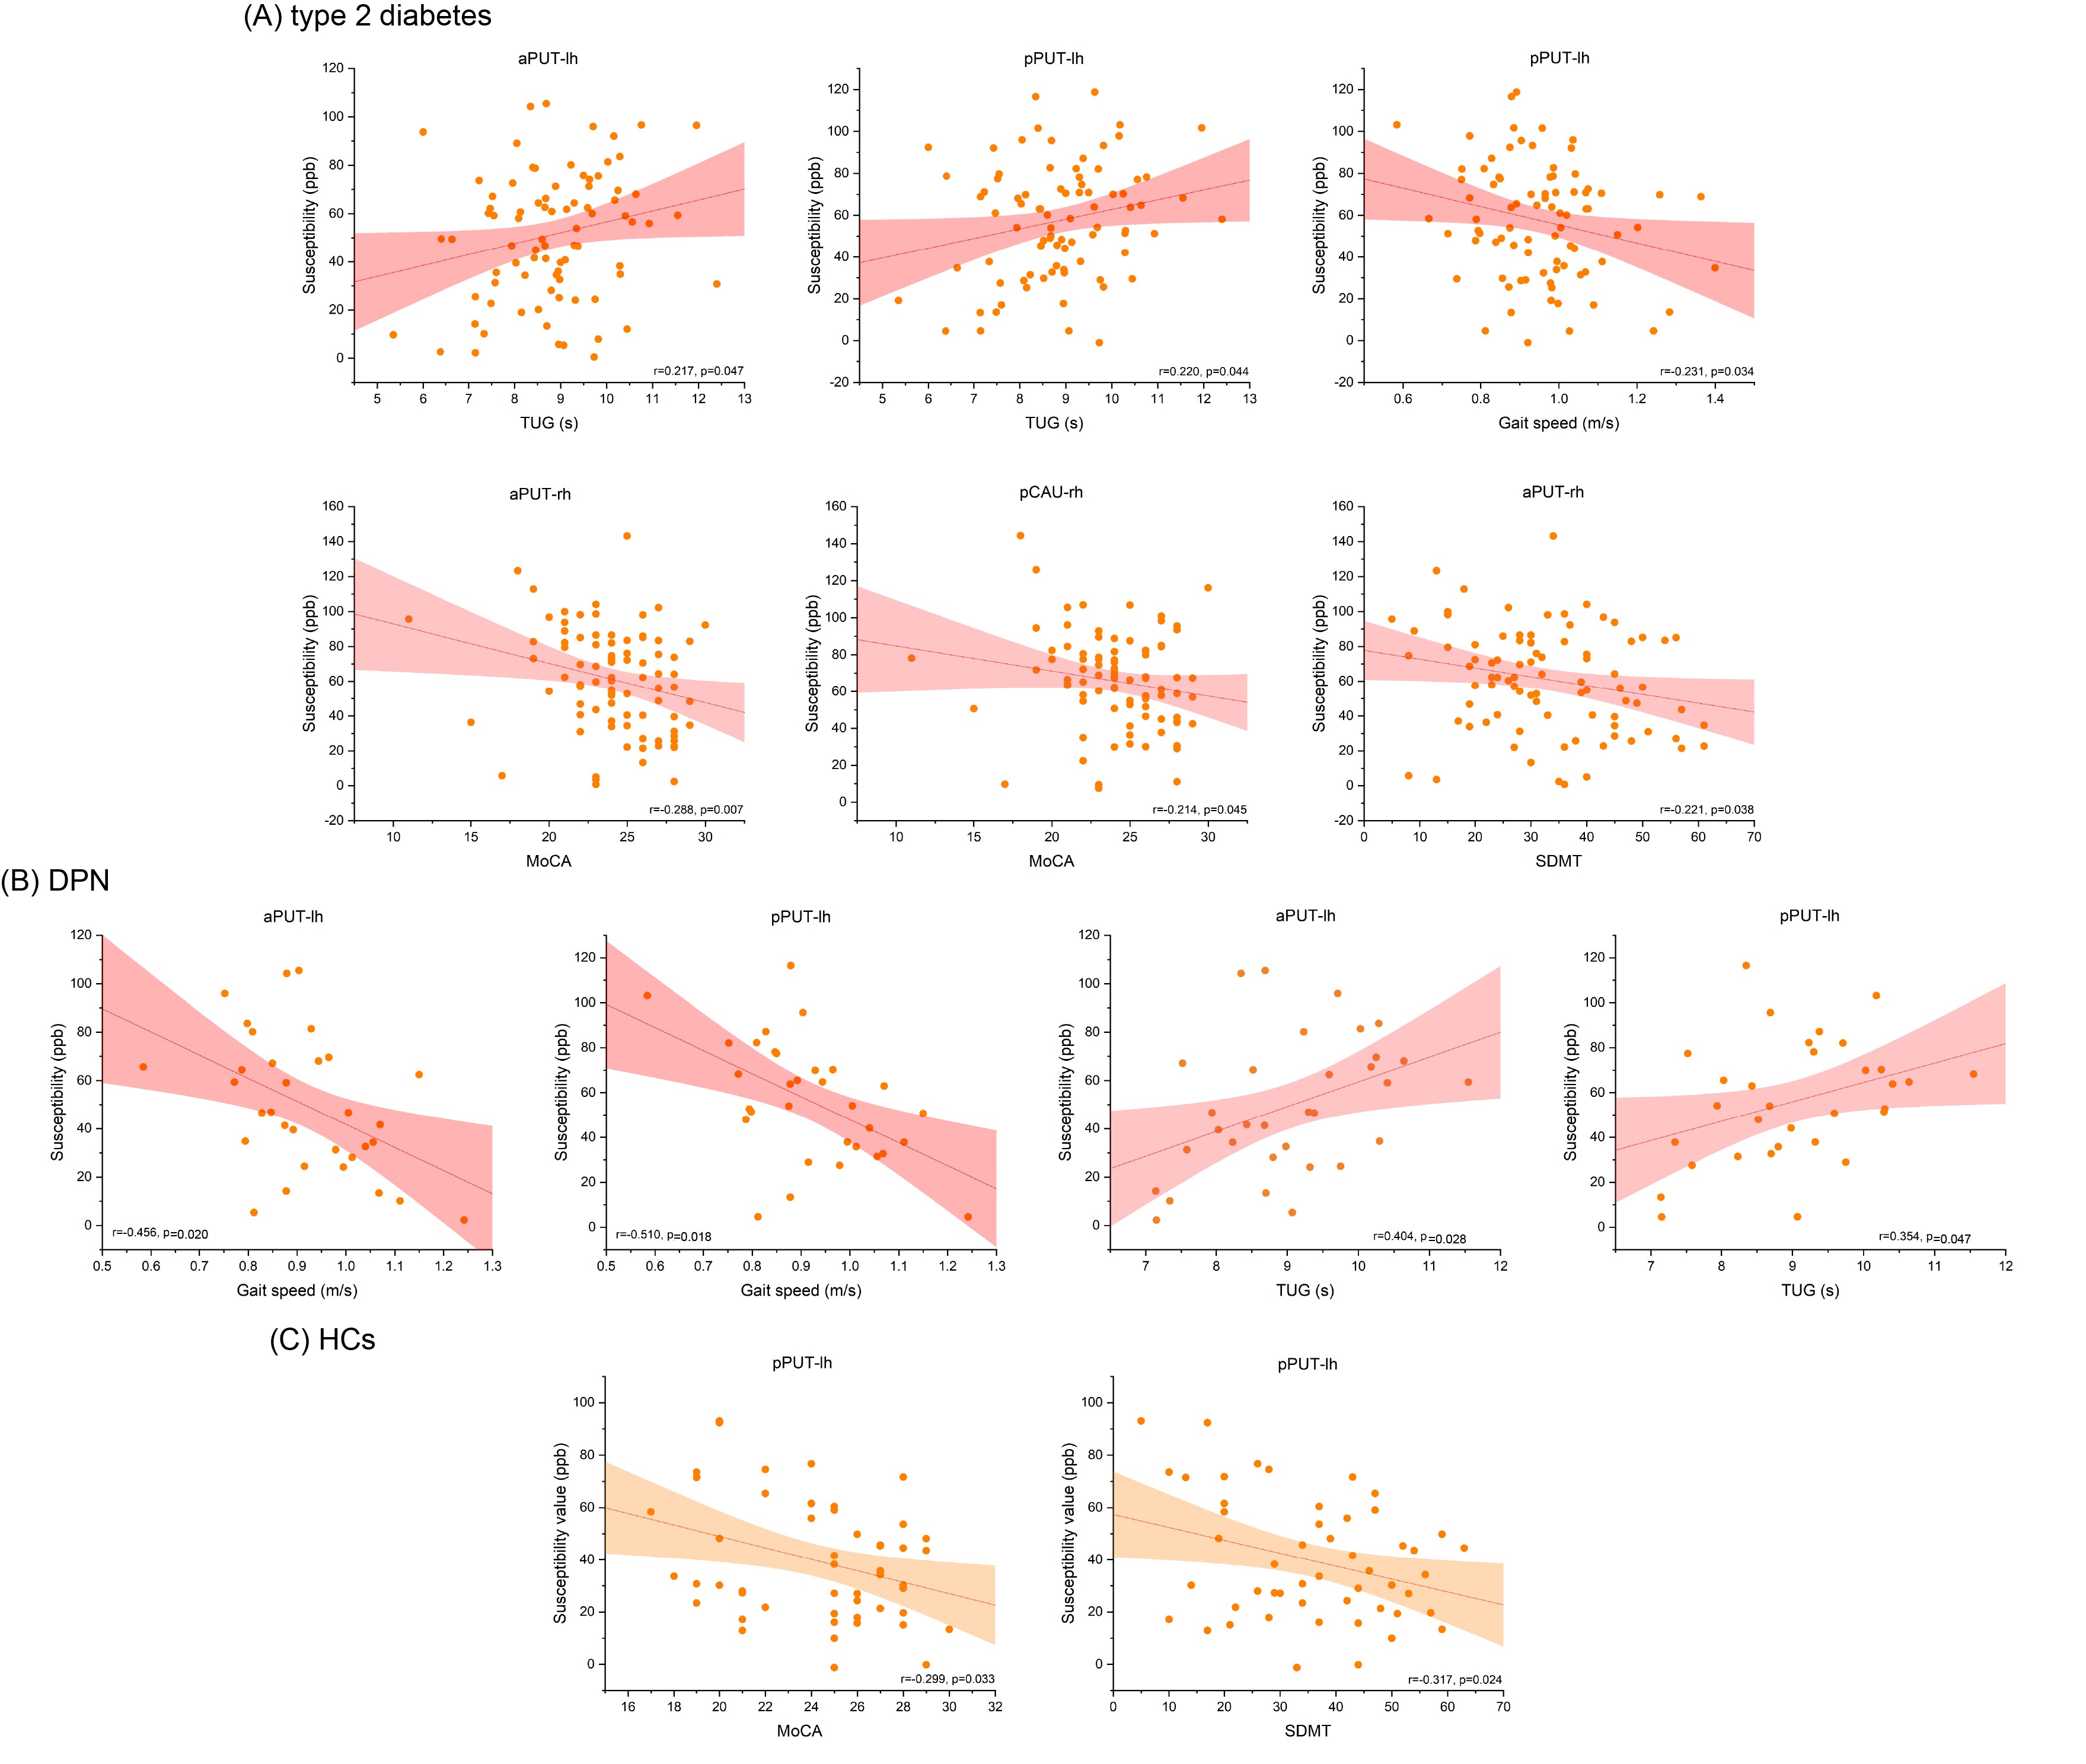
Susceptibilities in the putamen and the caudate nucleus were higher in T2DM than in HCs, while there was no significant difference between the DPN and NDPN groups (Figure 3). Stepwise regression analysis revealed that age and the history of diabetes played crucial roles for brain iron deposition in the putamen and the caudate (Figure 4). Susceptibility of the putamen positively correlated with scores of the Timed Up and Go test and negatively correlated with gait speed, Montreal Cognitive Assessment, and Symbol Digit Modalities Test scores in T2DM (Figure 5).Discussion
In this study, we used QSM to assess the changes in brain iron concentrations within the basal ganglia and further investigated the relationship of observed changes with motor and cognitive functions in T2DM. Compared to the HC group, we found significantly higher susceptibility in the anterior of the bilateral putamen, the posterior of the left putamen, and the right caudate in the DPN group. The mean susceptibilities within these regions negatively correlated with cognitive and motor function. More importantly, we found that increased iron deposition is mainly affected by age and the diagnosis of diabetes. Our results suggested that increased brain iron deposition might be a risk factor for impaired brain function in T2DM.By analyzing the relationship between the susceptibility of the putamen and the caudate and cognitive scores in all subjects, our findings supported that cognitive function decreased with increased iron deposition in both diabetic and healthy controls. Compared to healthy controls, susceptibility of the putamen in the T2DM group has a negative correlation with motor dysfunction (longer TUG time and slower gait speed). Notably, this correlation with movement was concentrated in the left putamen, which may be related to the right-handedness of the involved participants in this study. Given the differences in oxygen consumption and local tissue metabolism between participants with right-handedness and left-handedness, the oxygen metabolic uptake rate might be different in the basal ganglia [9], resulting in the lateralization of iron deposition. In this context, it is reasonable that iron deposition in the left putamen of T2DM patients exhibited a stronger correlation with motor dysfunction. Validation of T2DM and DPN for QSM imaging in the left-handedness cohort is warranted in the future.
Conclusion
In the present study, our results suggested that iron deposition in basal ganglia, mainly in the putamen, may indicate the deteriorating of T2DM and further correlate with the motor dysfunction in T2DM. Susceptibility changes in putamen measured by QSM provides more insights on the pathology of motor dysfunctional and cognitive decline in T2DM.Acknowledgements
We thank all of the volunteers and patients for their participation in our study. This work was supported by grants from the National Natural Science Foundation of China (82272072), the National Natural Science Foundation of China (32100902), the Fundamental Research Funds for the Central Universities (SWU118065), the Natural Science Foundation of Shandong Province (ZR2020MH288), the Technology Development Plan of Jinan (201301049, 201602206, 201907052), Medical and Health Science and Technology Development Project of Shandong Province (2016WS0529) and Funding for Study Abroad Program by Shandong Province (201803059).References
1. Park M, Moon WJ, Moon Y, Choi JW, Han SH, Wang Y. Region-specific susceptibility change in cognitively impaired patients with diabetes mellitus. PLoS One 2018, 13(10): e0205797.
2. Li J, Zhang Q, Zhang N, Guo L. Increased Brain Iron Deposition in the Putamen in Patients with Type 2 Diabetes Mellitus Detected by Quantitative Susceptibility Mapping. J Diabetes Res 2020, 2020: 7242530.
3. Selvarajah D, Kar D, Khunti K, Davies MJ, Scott AR, Walker J, et al. Diabetic peripheral neuropathy: advances in diagnosis and strategies for screening and early intervention. Lancet Diabetes Endocrinol 2019, 7(12): 938-948.
4. Liu J, Li Q, Yang Y, Ma L. Iron metabolism and type 2 diabetes mellitus: A meta-analysis and systematic review. J Diabetes Investig 2020, 11(4): 946-955.
5. Regenhardt RW, Das AS, Lo EH, Caplan LR. Advances in Understanding the Pathophysiology of Lacunar Stroke: A Review. JAMA Neurol 2018, 75(10): 1273-1281.
6. Pop-Busui R, Boulton AJ, Feldman EL, Bril V, Freeman R, Malik RA, et al. Diabetic Neuropathy: A Position Statement by the American Diabetes Association. Diabetes Care 2017, 40(1): 136-154.
7. Liu Z, Spincemaille P, Yao Y, Zhang Y, Wang Y. MEDI+0: Morphology enabled dipole inversion with automatic uniform cerebrospinal fluid zero reference for quantitative susceptibility mapping. Magn Reson Med 2018, 79(5): 2795-2803.
8. Tian Y, Margulies DS, Breakspear M, Zalesky A. Topographic organization of the human subcortex unveiled with functional connectivity gradients. Nat Neurosci 2020, 23(11): 1421-1432.
9. Wang D, Li YH, Wang H. Do Left- and Right-Handed People Have Similar Iron Deposition in the Basal Ganglia? J Comput Assist Tomogr 2016, 40(1): 26-33.
Figures