1052
Postherpetic Neuralgia and Morphological Alterations in the Human Dorsal Root Ganglia: A Study Using 3T MR Neurography1The First Affiliated Hospital of Fujian Medical University, Fuzhou, China, 2Philips Healthcare, Shanghai, China, Shanghai, China
Synopsis
Keywords: Neuroinflammation, Neuroinflammation
Motivation: Despite the crucial role of imaging in localizing lesions, excluding causes, and guiding surgery, there remains a paucity of reports pertaining to the radiological manifestations in patients with herpetic neuralgia.
Goal(s): To investigate the correlation between the volume and T2 signal intensity (SI) of the ganglia in 3T MRN with clinical and serological parameters in herpetic neuralgia patients.
Approach: With 18 patients examined by MRN. Volume, T2 signal measurements of the T1-T12 ganglia were performed manually for each patient.
Results: The changes in ganglion volume observed on MRN may reflect disease progression. Among all serological indicators, ESR was correlated with the volume ratio.
Impact: This study is the first to quantify ganglia in herpetic neuralgia patients, and the first to investigate the correlation between ganglia volume and serological data. In herpetic neuralgia patients, these MRN findings will contribute to the diagnosis and management.
Introduction
Postherpetic neuralgia (PHN) is the most serious complication of herpes zoster, with an incidence of approximately 15%.1 It is the result of concomitant neuronal damage during VZV replication in the ganglion during a herpes zoster episode.2 HZ and its complication, PHN, represent highly prevalent conditions characterized by pain and constitute significant public health challenges.3, 4Although various cellular mechanisms and clinical risk factors associated with PHN have been described, numerous aspects of PHN remain enigmatic. These include the precise pain localization and underlying mechanisms, in addition to the pathophysiological and imaging findings of this pain.5 Despite the crucial role of imaging in localizing lesions, excluding causes, and guiding surgery,6-8 there remains a paucity of dedicated reports pertaining to the radiological manifestations in patients with PHN.Magnetic Resonance Imaging (MRI) with its superior soft tissue resolution, multi-parametric imaging, and myriad post-processing techniques has emerged as the preferred method for diagnosing spinal nerve abnormalities. Several studies have documented the utility of MRI in diagnosing and treating patients afflicted with herpes zoster,9-11 as well as the MRI manifestations of herpes zoster at different locations.12, 13
Despite this, there remains a limited amount of research combining imaging analyses of proximal structures such as the DRG with serological parameters in PHN patients.
Methods
Eighteen consecutive patients diagnosed with herpetic neuralgia were prospectively scanned. Volume and T2 signal measurements of the T1-T12 dorsal root ganglia were performed manually for each patient. All the thoracic ganglia of each patient were classified by the clinician according to physical examination and inquiry into the rash segment, the mainly affected segment, and the normal segment. Besides, all patients completed a questionnaire at the visit as instructed by their physician to indicate the pain sensation on the VAS, ranging from 0 (no pain) to 10 (worst pain ever). The C-reactive protein (CRP), erythrocyte sedimentation rate (ESR), serum uric acid (UA), total bilirubin (TBIL) and albumin (ALB) of each patient were recorded. When analyzed these data, patients are divided into acute herpes neuralgia group, subacute herpes neuralgia group, and postherpetic neuralgia group. The volume and T2 signal were compared by one-way repeated measures ANOVA and the paired samples t-test. The Pearson’s correlation coefficient r was used to assess the correlations of volume and T2 signal with serological data.Results
Statistically significant differences were observed between the volume of the DRG on the affected side and the opposite, within both the rash segment and the mainly segments. No significant differentials, however, were noted within the normal segments. Consequently, volume alterations can be more conveniently denoted as the ratio of the affected ganglion volume to the contralateral volume. The mean alteration in the ganglia within the patient's rash and mainly segment was 1.29 and 1.44, respectively. (all P<0.001 when compared with the normal segment). As for T2 signal intensity, no differences were found in T2 signal of bilateral DRG in each segment in all patients. Of all acquired serological parameters, ESR index was the only parameters associated with the DRG volume change ratio in both rash and mainly segment.Discussion
This study demonstrates that high-resolution MRN can provide noninvasive DRG imaging assessment for objective in vivo measurements of sensory neuronal damage in herpes neuralgia patients. Statistically significant differences were noted in the DRG volumes between the affected and opposite in both the rash segment and mainly segment. This offers the first in vivo evidence of alterations in human neurons following a herpes zoster infection. We did not observe any difference in T2 signal between the left and right groups, which may be due to the imaging technique we used. ESR was the only data that correlated with the DRG volume, both in mainly segment and the rash segment. Given prior evidence implicating elevated ESR levels in HZ patients with the progression of long-term PHN, we propose that combining ESR levels with observed DRG volume changes on MRN may serve as a viable predictor for PHN development.Conclusion
In conclusion, the present study is the first to image and quantify DRG in patients with herpetic neuralgia and the first to find a relationship between DRG volume changes and serological data in such patients. The results showed that there were significant changes in the DRG volume on the affected side compared with the contralateral side in patients with herpetic neuralgia. The volume change was related to the ESR level. Further longitudinal studies are needed to investigate the effect of drg volume on neuropathic symptoms in patients with herpetic neuralgia and to further elucidate the underlying pathophysiological processes.Acknowledgements
The authors of this manuscript declare no relationships with any companies, whose products or services may be related to the subject matter of the article. The authors state that this work was supported the Fujian Provincial Health Technology Project (No. 2021GGA025), and the National Natural Science Foundation of China (No. 82071869). No complex statistical methods were necessary for this paper. Institutional Review Board approval was obtained. Written informed consent form was obtained from subjects in this study. This article has not been published elsewhere in whole or in part. Methodology: prospective, performed at one institution.
References
1. Gershon AA, Breuer J, Cohen JI, et al. Varicella zoster virus infection. Nature reviews Disease primers 2015;1:15016. doi: https://doi.org/10.1038/nrdp.2015.16
2. Finnerup NB, Kuner R, Jensen TS. Neuropathic Pain: From Mechanisms to Treatment. Physiological reviews 2021;101:259-301. doi: https://doi.org/10.1152/physrev.00045.2019
3. Vatner SF, Zhang J, Oydanich M, et al. Healthful aging mediated by inhibition of oxidative stress. Ageing research reviews 2020;64:101194. doi: https://doi.org/10.1016/j.arr.2020.101194
4. Maarbjerg S, Di Stefano G, Bendtsen L, et al. Trigeminal neuralgia - diagnosis and treatment. Cephalalgia : an international journal of headache 2017;37:648-657. doi: https://doi.org/10.1177/0333102416687280
5. Oskay T, Keskin C, Özen M. Antioxidant and inflammatory biomarkers in herpes zoster. Journal of medical virology 2022;94:3924-3929. doi: https://doi.org/10.1002/jmv.27781
6. Muesse JL, Blackmon SH, Harris RL, et al. Acute shingles after resection of thoracic schwannoma. Texas Heart Institute journal 2012;39:265-267. doi:
7. Murthy NK, Sharma M, Spinner RJ. Primary peripheral nerve tumors associated with nerve-territory herpes zoster. Acta neurochirurgica 2020;162:1147-1151. doi: https://doi.org/10.1007/s00701-020-04292-y
8. Li B, Huang Y, Zhang Y, et al. Utilizing pre-operative MR imaging and adapting optimal needle puncture approach to improve radiofrequency ablation fraction of thoracic dorsal root ganglia. Sci Rep 2021;11:18589. doi: https://doi.org/10.1038/s41598-021-98050-4
9. Kim JG, Chung SG. Herpetic Brachial Plexopathy: Application of Brachial Plexus Magnetic Resonance Imaging and Ultrasound-Guided Corticosteroid Injection. American journal of physical medicine & rehabilitation 2016;95:e67-71. doi: https://doi.org/10.1097/phm.0000000000000445
10. Heo DH, Jun AY, Cho YJ. Magnetic resonance neurography findings in herpetic brachial plexopathy. J Neurol 2011;258:137-139. doi: https://doi.org/10.1007/s00415-010-5673-6
11. Wada S, Hirano H, Uehara N, et al. Cervical Root Enlargement in Segmental Zoster Paresis: A Study with Magnetic Resonance Imaging and Nerve Ultrasound. Internal medicine (Tokyo, Japan) 2022;61:2361-2365. doi: https://doi.org/10.2169/internalmedicine.8538-21
12. Choi JW, Nahm H, Shin JE, et al. Atypical clinical manifestations of herpes zoster oticus: diagnostic usefulness of magnetic resonance imaging. Journal of neurovirology 2019;25:874-882. doi: https://doi.org/10.1007/s13365-019-00781-8
13. Zubair AS, Hunt C, Watson J, et al. Imaging Findings in Patients with Zoster-Associated Plexopathy. AJNR Am J Neuroradiol 2017;38:1248-1251. doi: https://doi.org/10.3174/ajnr.A5149
Figures
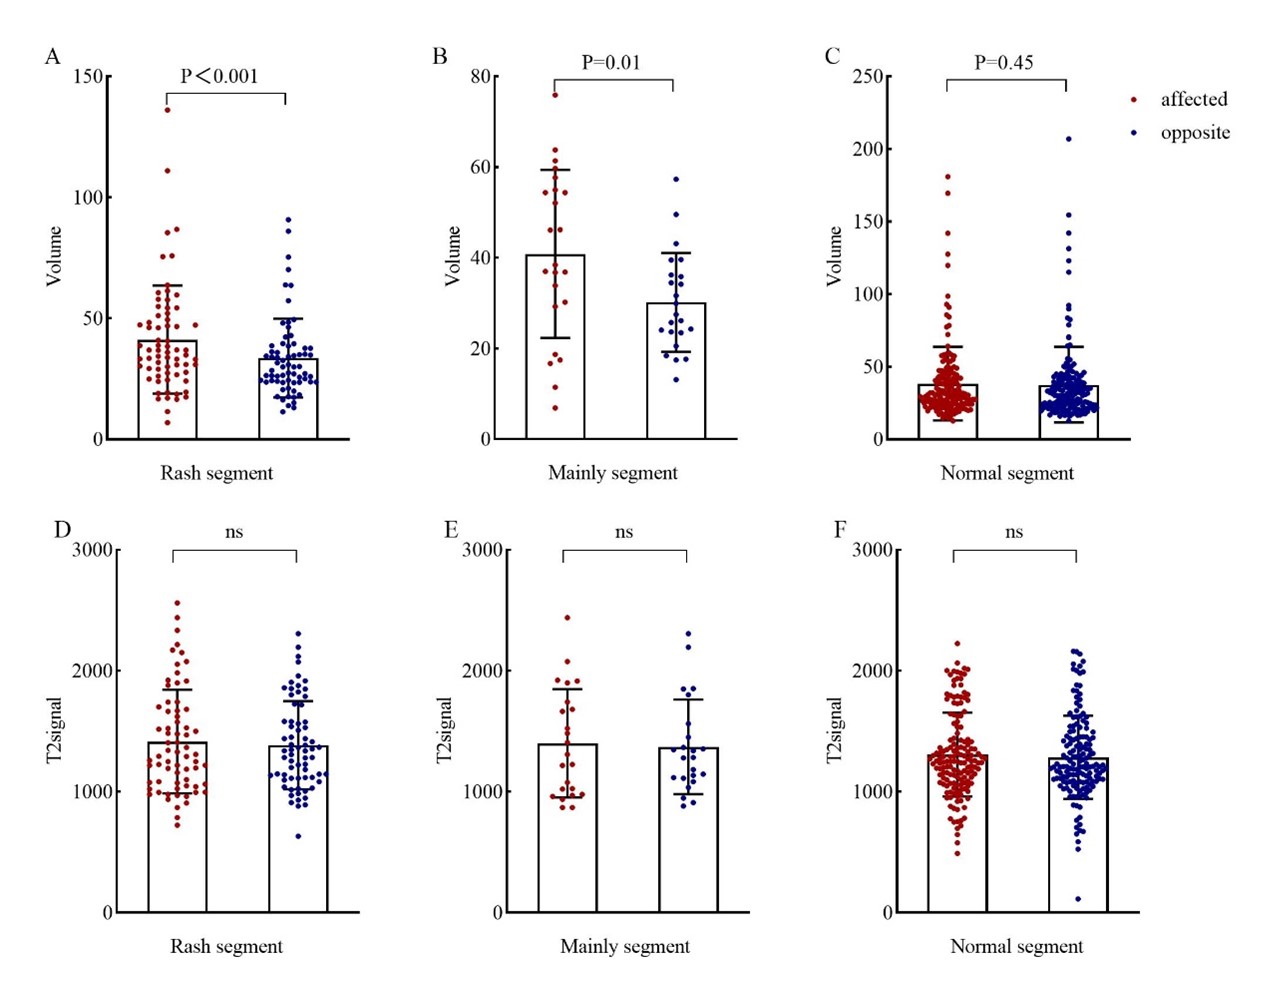
Figure 1 The volume and the T2 signal of the dorsal root ganglion ( ± standard deviation), comparing the affected/opposite of the rash segment, the mainly segment, and the normal segment. Differences were found in ganglia between the rash group and the mainly involved group.
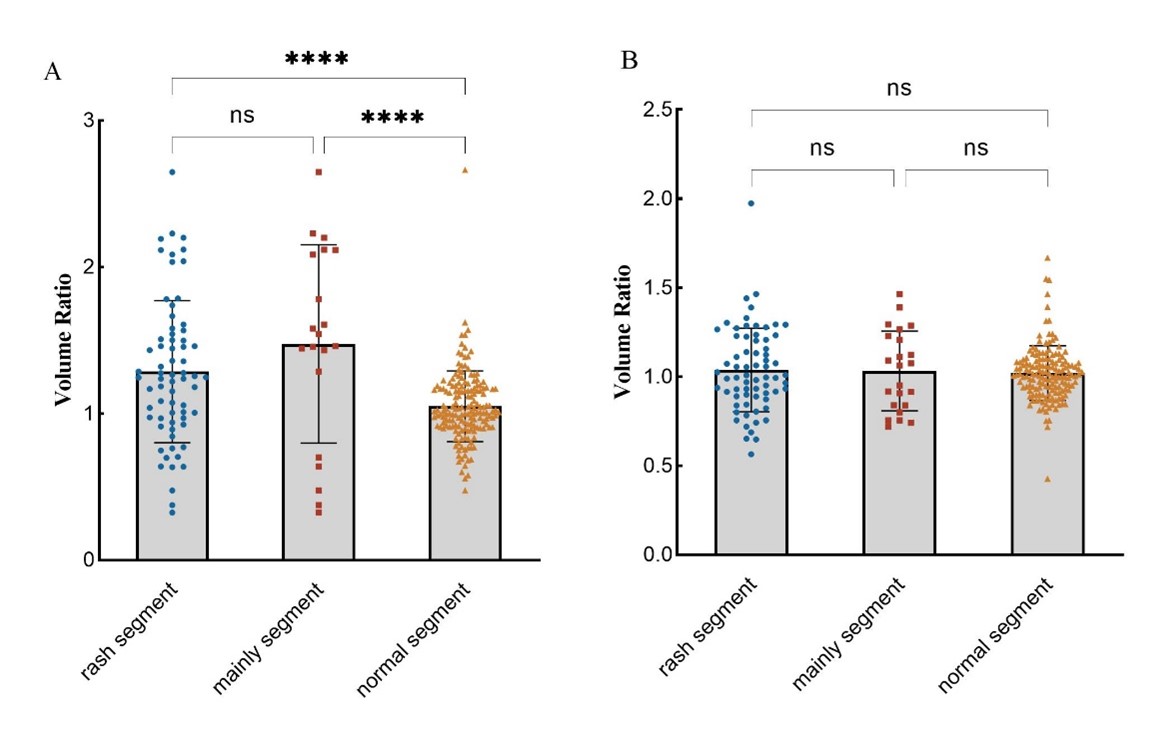
Figure 2 The ratio of affected and opposite for volume and T2 signal. The rash segment, the mainly segment, and the normal segment were compared.
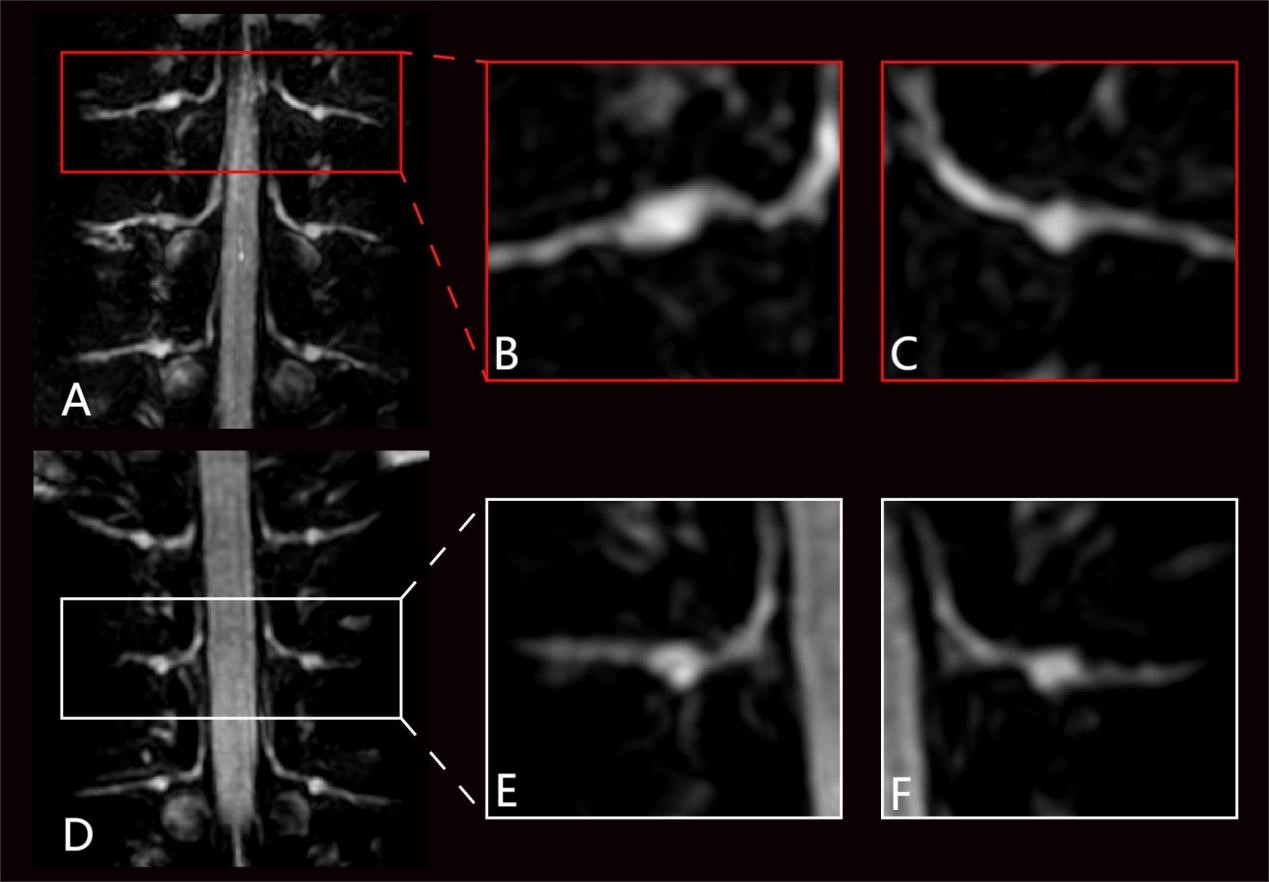
Figure 4 Segment of rash segment as defined by clinician (A), mainly segment as seen on imaging (B), and remaining normal segments in the same patient (D-F).
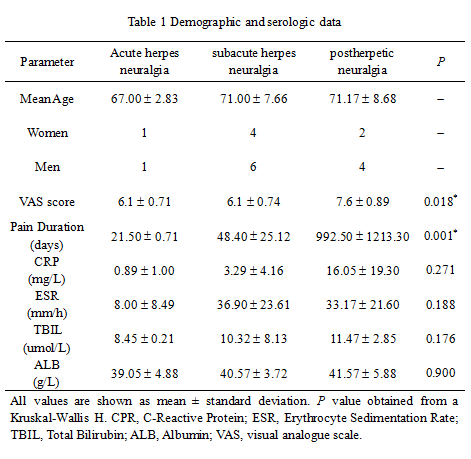
Table 1