1051
The changes of oxygen extraction fraction in different types of lesions in multiple sclerosis: A cross-sectional and follow-up study1Tongji Hospital, Tongji Medical College, Huazhong University of Science and Technology, Wuhan, China
Synopsis
Keywords: Multiple Sclerosis, Multiple Sclerosis
Motivation: Multiple sclerosis (MS) lesions with different pathologic conditions could be distinguished by MRI. There may be differences in oxygen metabolism in different types of lesions.
Goal(s): To explore the oxygen metabolism of different types of lesions in MS patients by oxygen extraction fraction (OEF) both cross-sectionally and longitudinally.
Approach: The OEF map was reconstructed from a 3D multi-echo gradient echo scan. White matter lesions were classified into four types based on contrast-enhanced T1WI and quantitative susceptibility mapping.
Results: There were differences in OEF among different types of MS lesions. The OEF in the lesion and the lesion type may change as time progresses.
Impact: This study revealed tissue damage and oxygen metabolism level in different types of MS lesions. The OEF may contribute to further understanding of the pathological mechanisms in MS lesion evolution.
Introduction
Based on the different pathological conditions, multiple sclerosis (MS) lesions could be classified into active lesions, chronic active lesions, chronic inactive lesions and completely remyelinated lesions, and could be identified separately by MRI[1; 2]. Active lesions which are known as enhancement lesions (ELs) show enhancement on contrast-enhanced T1-weighted images (T1WI)[3]. Chronic active lesions were surrounded by activated macrophages and iron-rich microglia, appearing as paramagnetic rim lesions (PRLs) on magnetic susceptibility sequences[4-6]. A new pathology/MRI study has demonstrated that fully remyelinated lesions showed hypo-/iso-intense on quantitative susceptibility mapping (QSM) whereas the hyperintense lesions on QSM represent chronic inactive lesions[7]. Although the basic characteristics of MS lesions have been characterized and relatively consistent classification criteria have been obtained, the clinical relevance and potential pathogenic mechanisms of different types of lesions still need to be explored. Therefore, we applied two quantitative MRI techniques, QSM and oxygen extraction fraction (OEF), to reflect pathologic injury in different types of MS lesions in white matter.Methods
Forty-six RRMS patients had undergone MR examination that included T1WI before and after gadolinium contrast agent injection, T2WI and 3D multi-echo gradient echo (mGRE). Forty-one age- and gender-matched healthy controls (HC) were included in the study. Eleven of the RRMS patients underwent a follow-up MRI with a mean interval of 1.50±1.17 years. The QSM was reconstructed from the mGRE sequence[8].The OEF map was reconstructed using a integrated model of QSM and quantitative blood oxygenation level dependent magnitude (QSM+qBOLD)[9]. Two neuroradiologists jointly divided MS lesions into four subgroups based on contrast-enhanced T1WI and QSM, including ELs, PRLs, hyperintense lesions and non-hyperintense lesions on QSM maps. The volume on T2WI (T2VL), susceptibility and OEF of each lesion were recorded. The Kruskal-Wallis test and the Wilcoxon signed-rank test was used to compare the differences in MRI metrics cross-sectionally and longitudinally. The Bonferroni method was used for multiple comparisons correction.Results
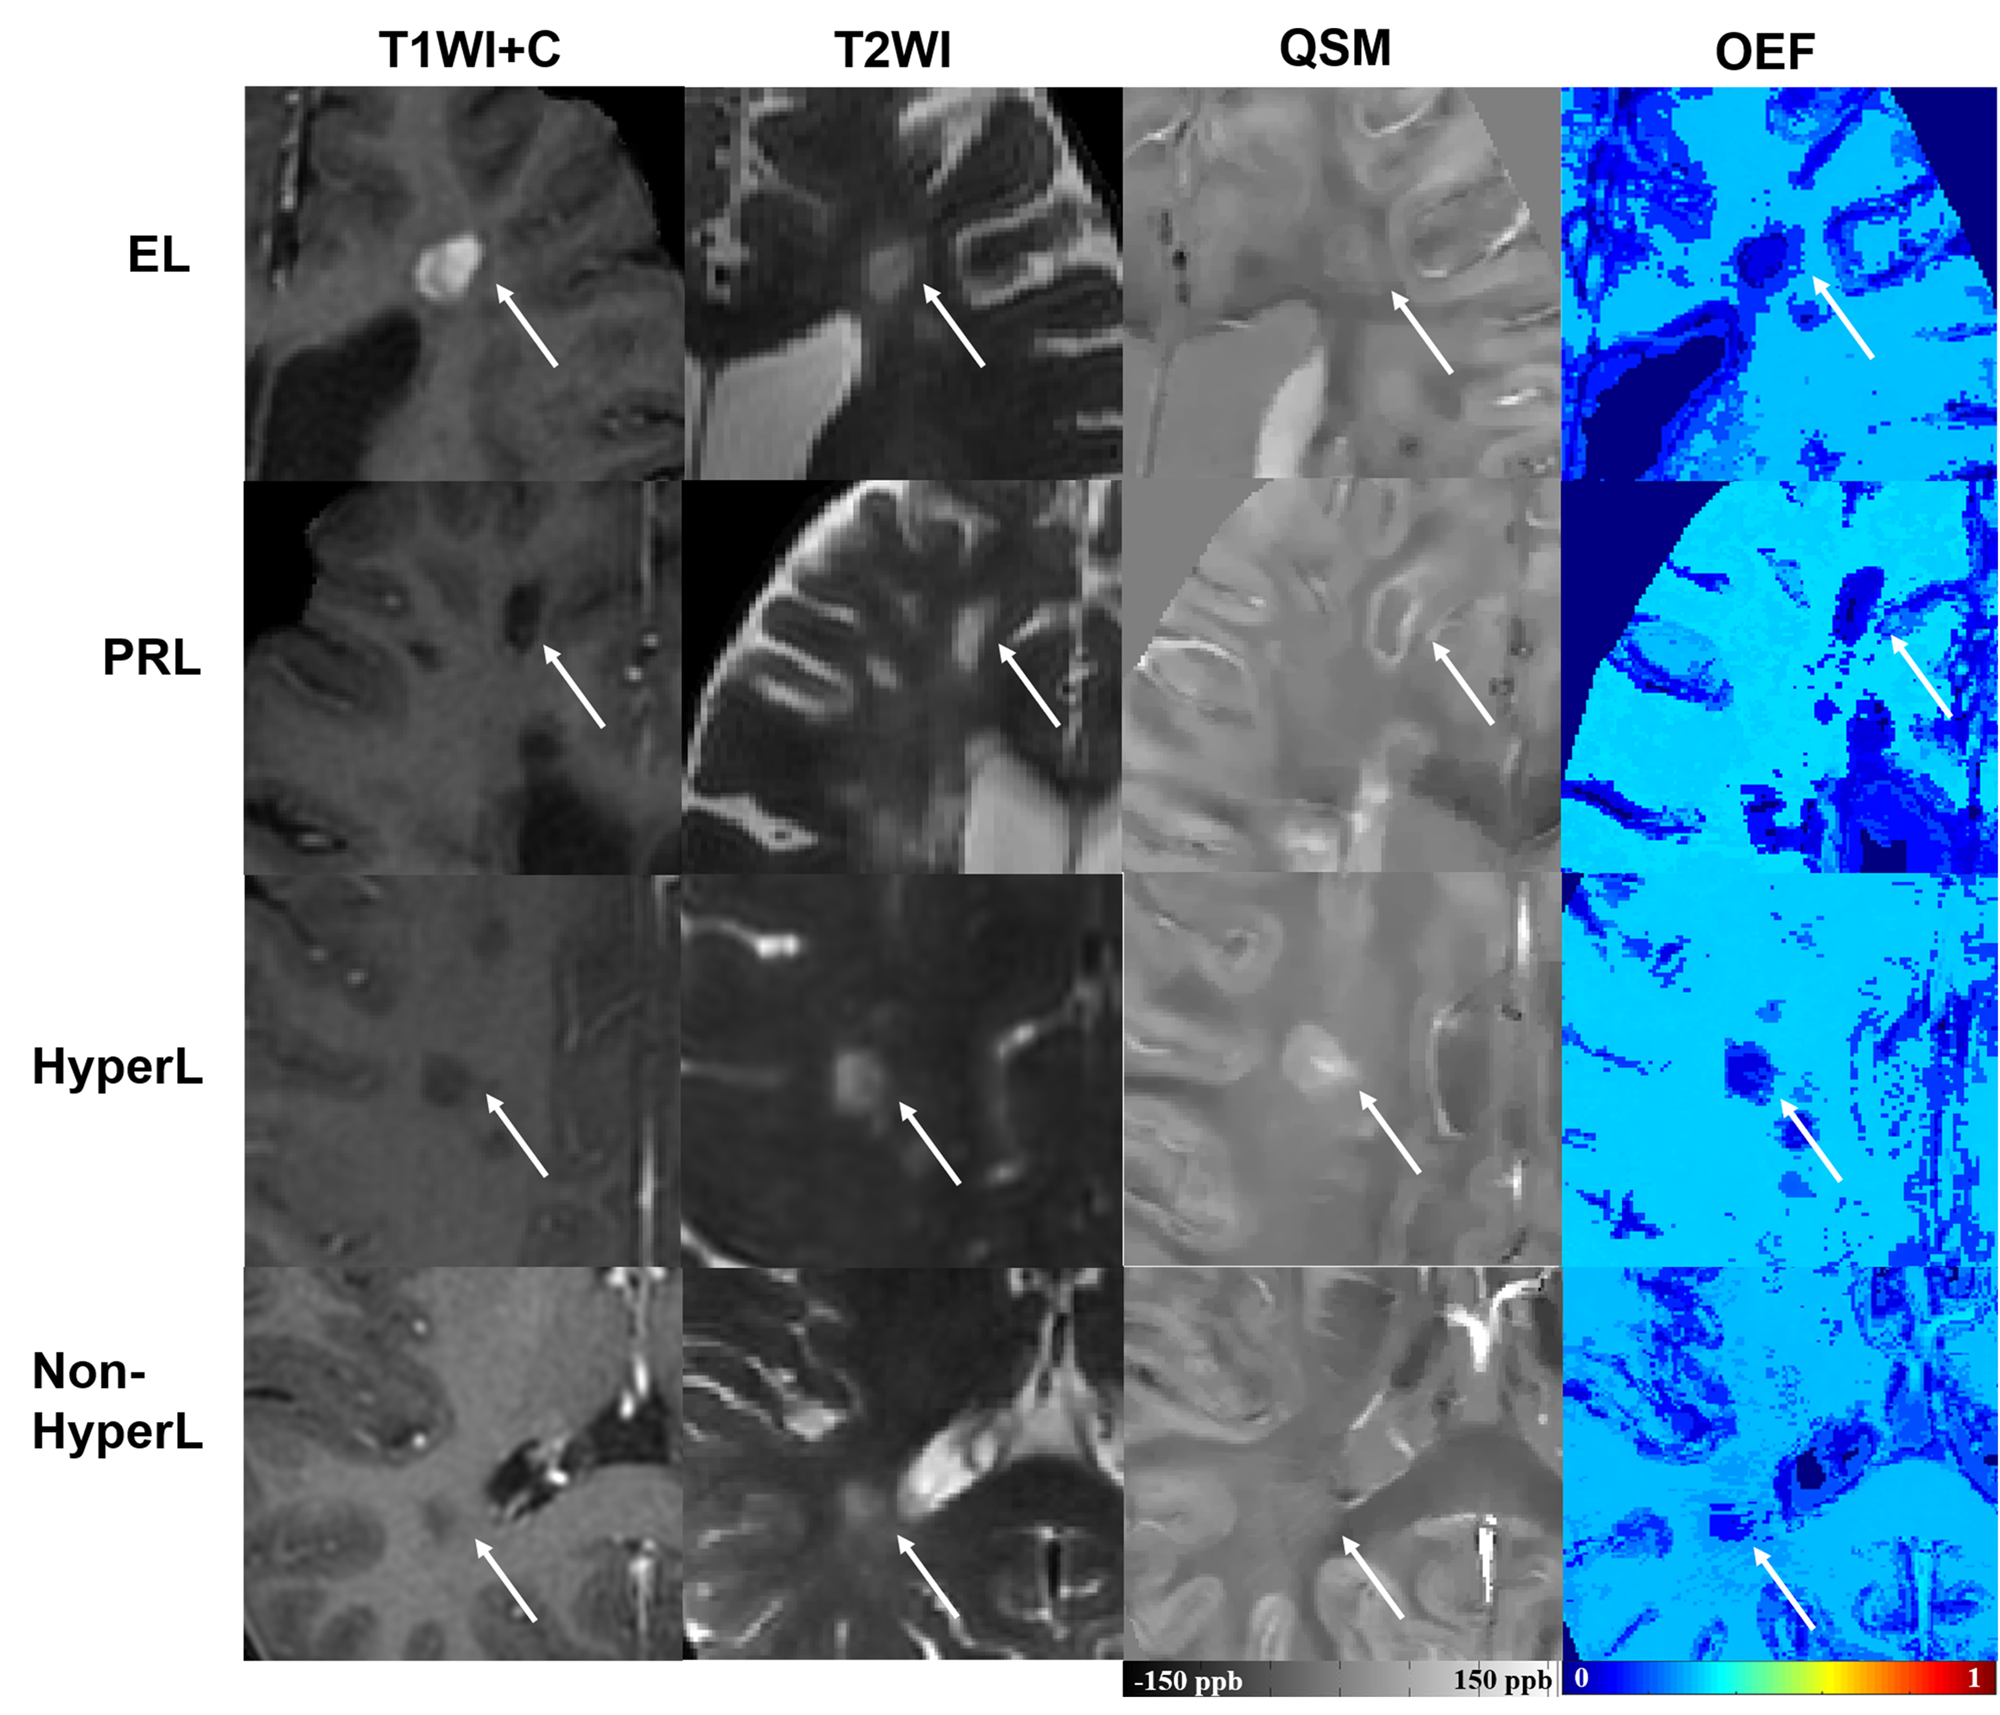
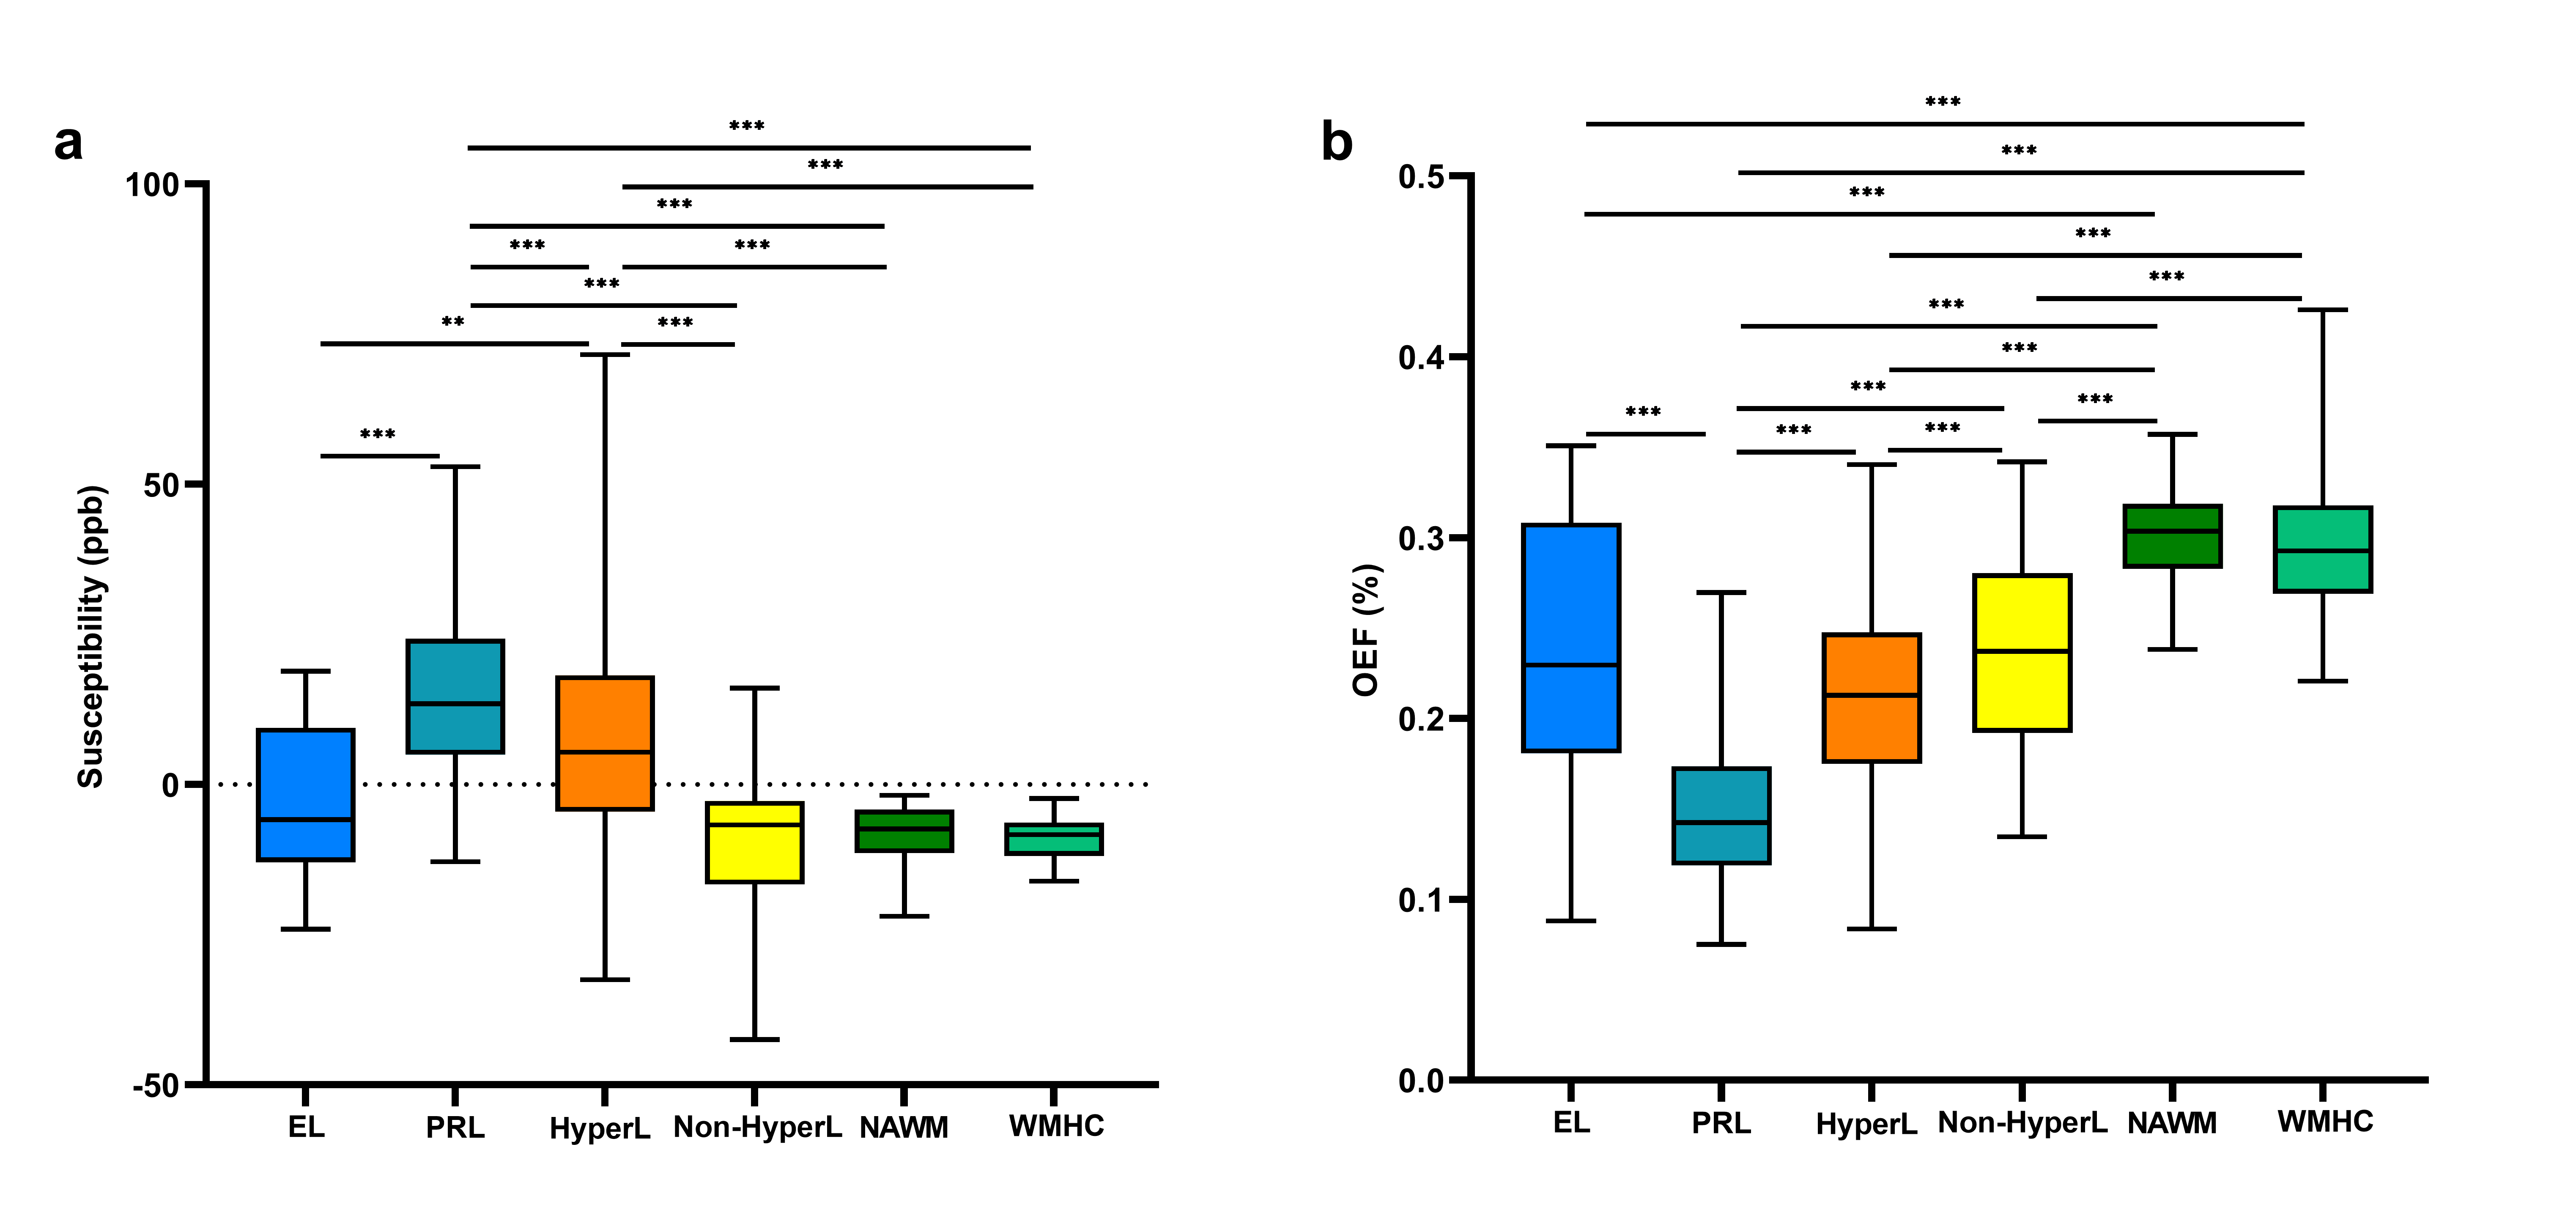
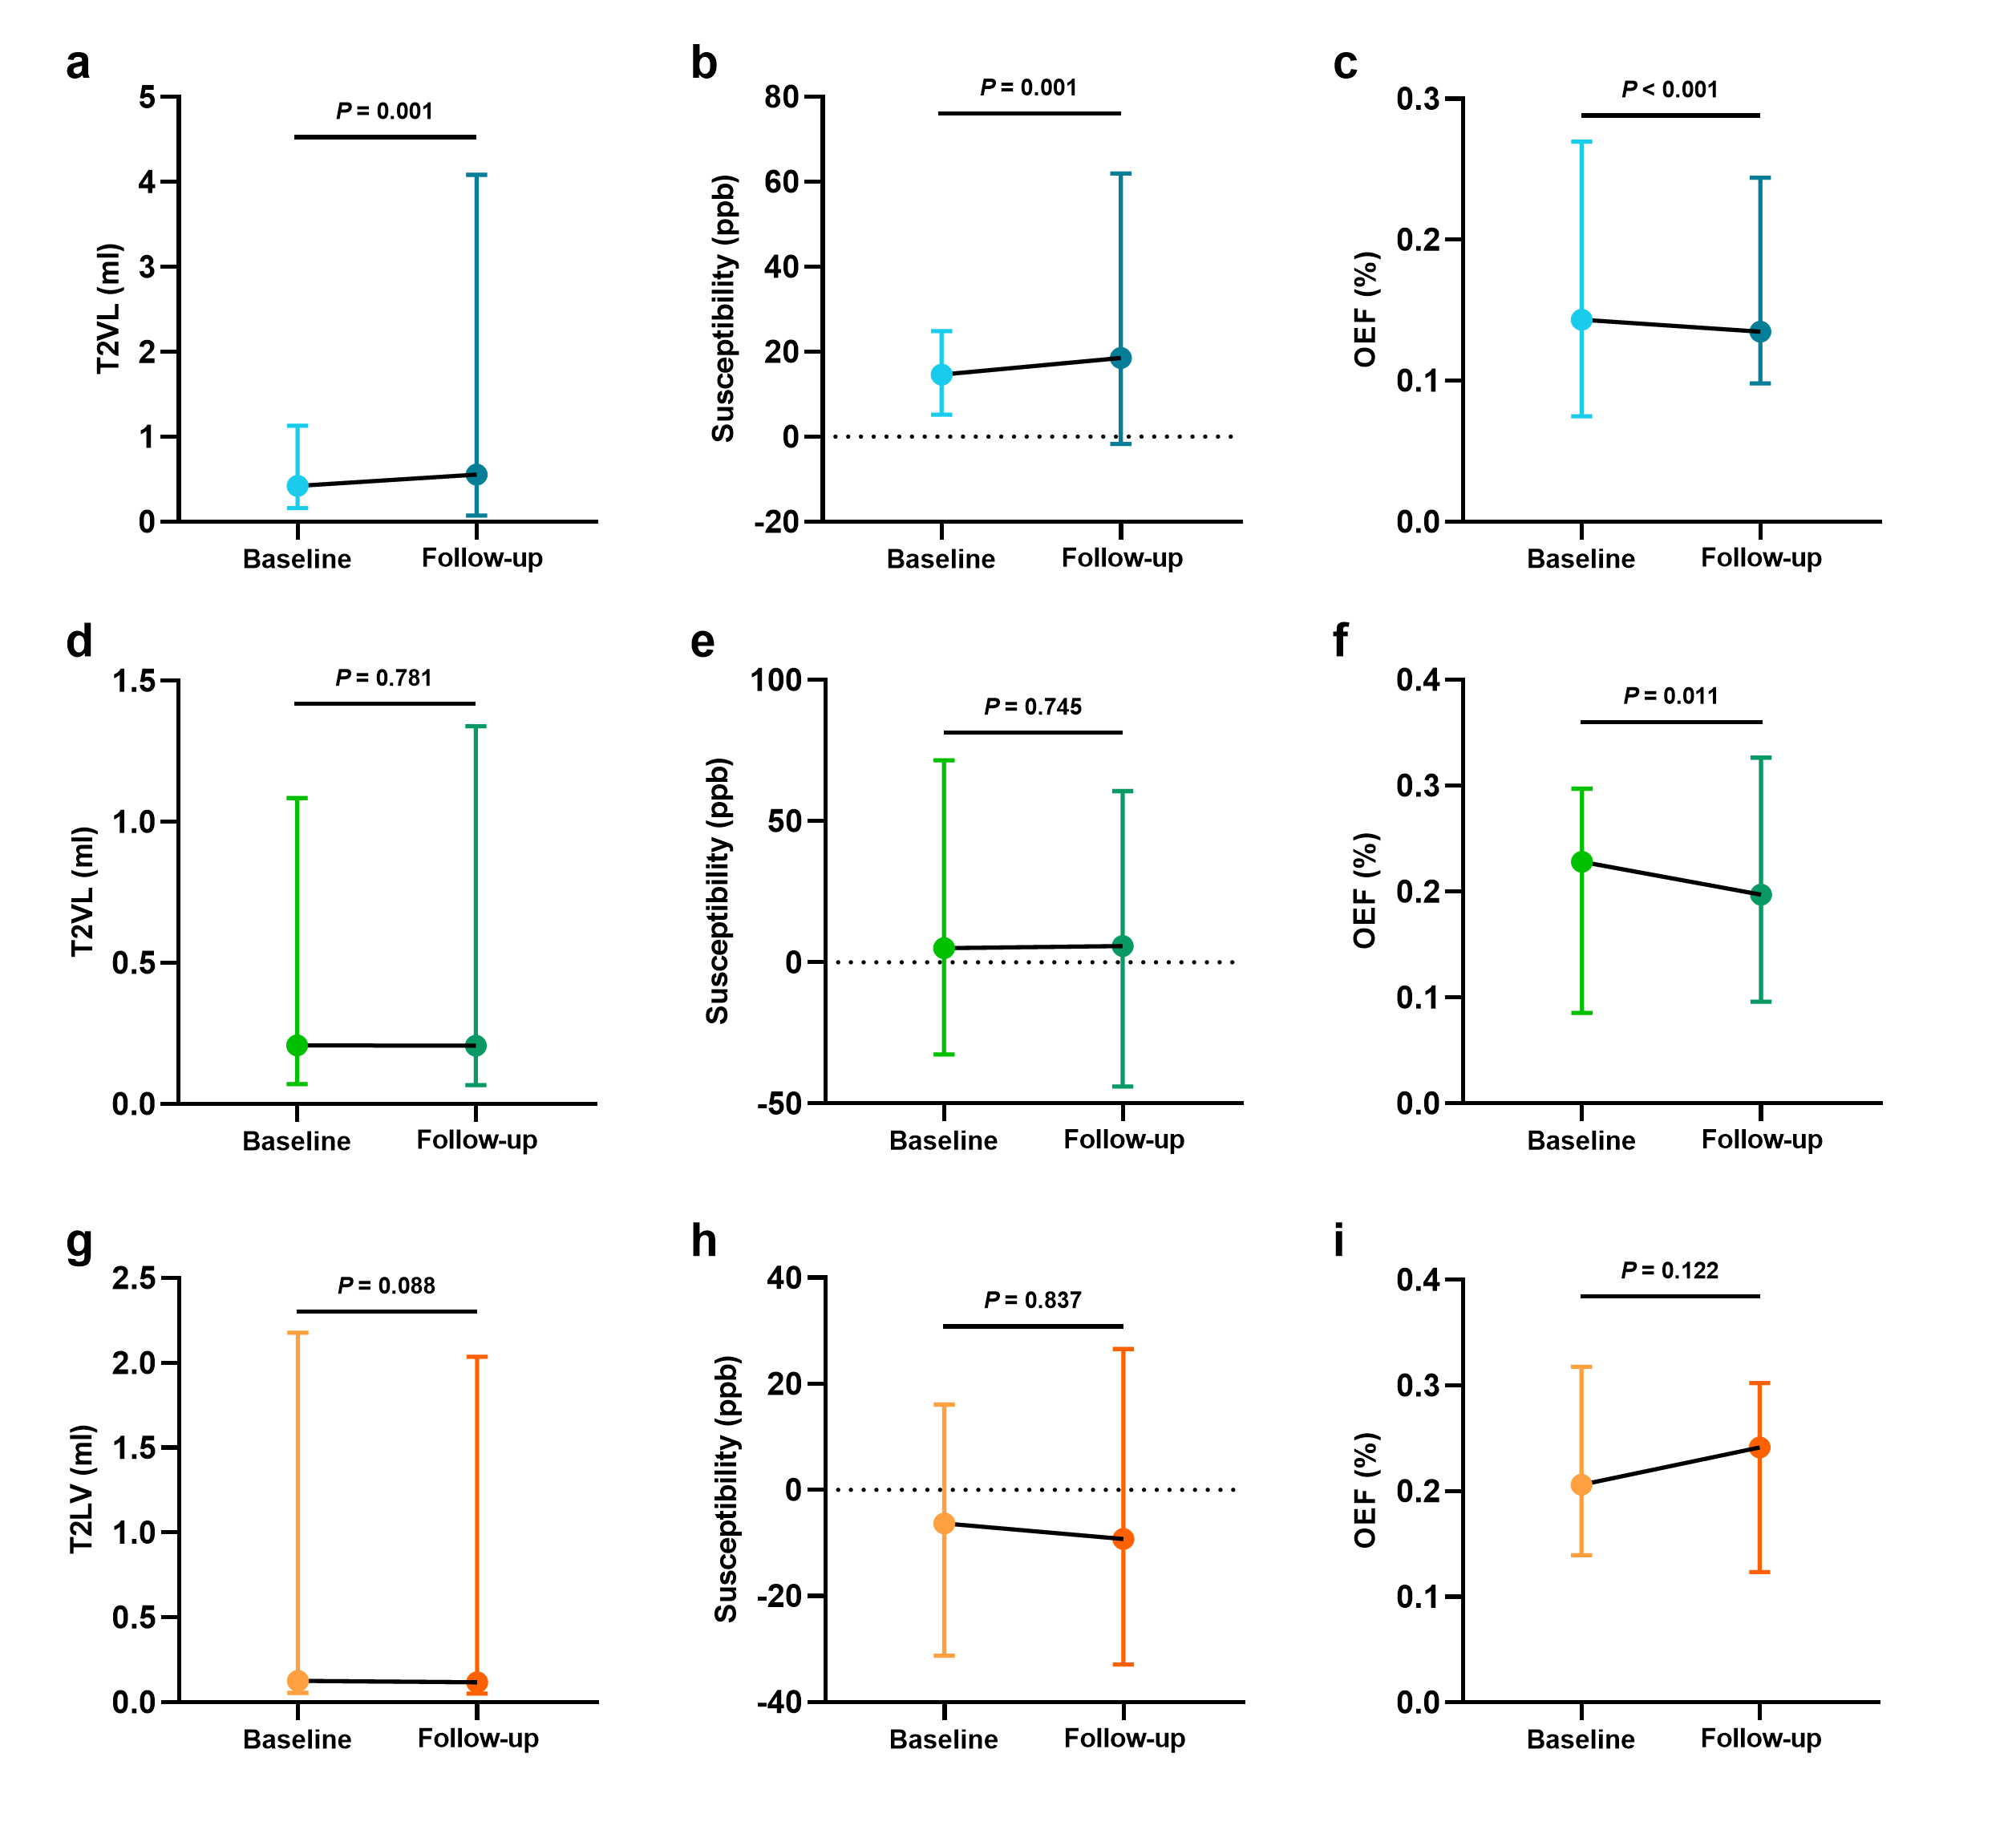
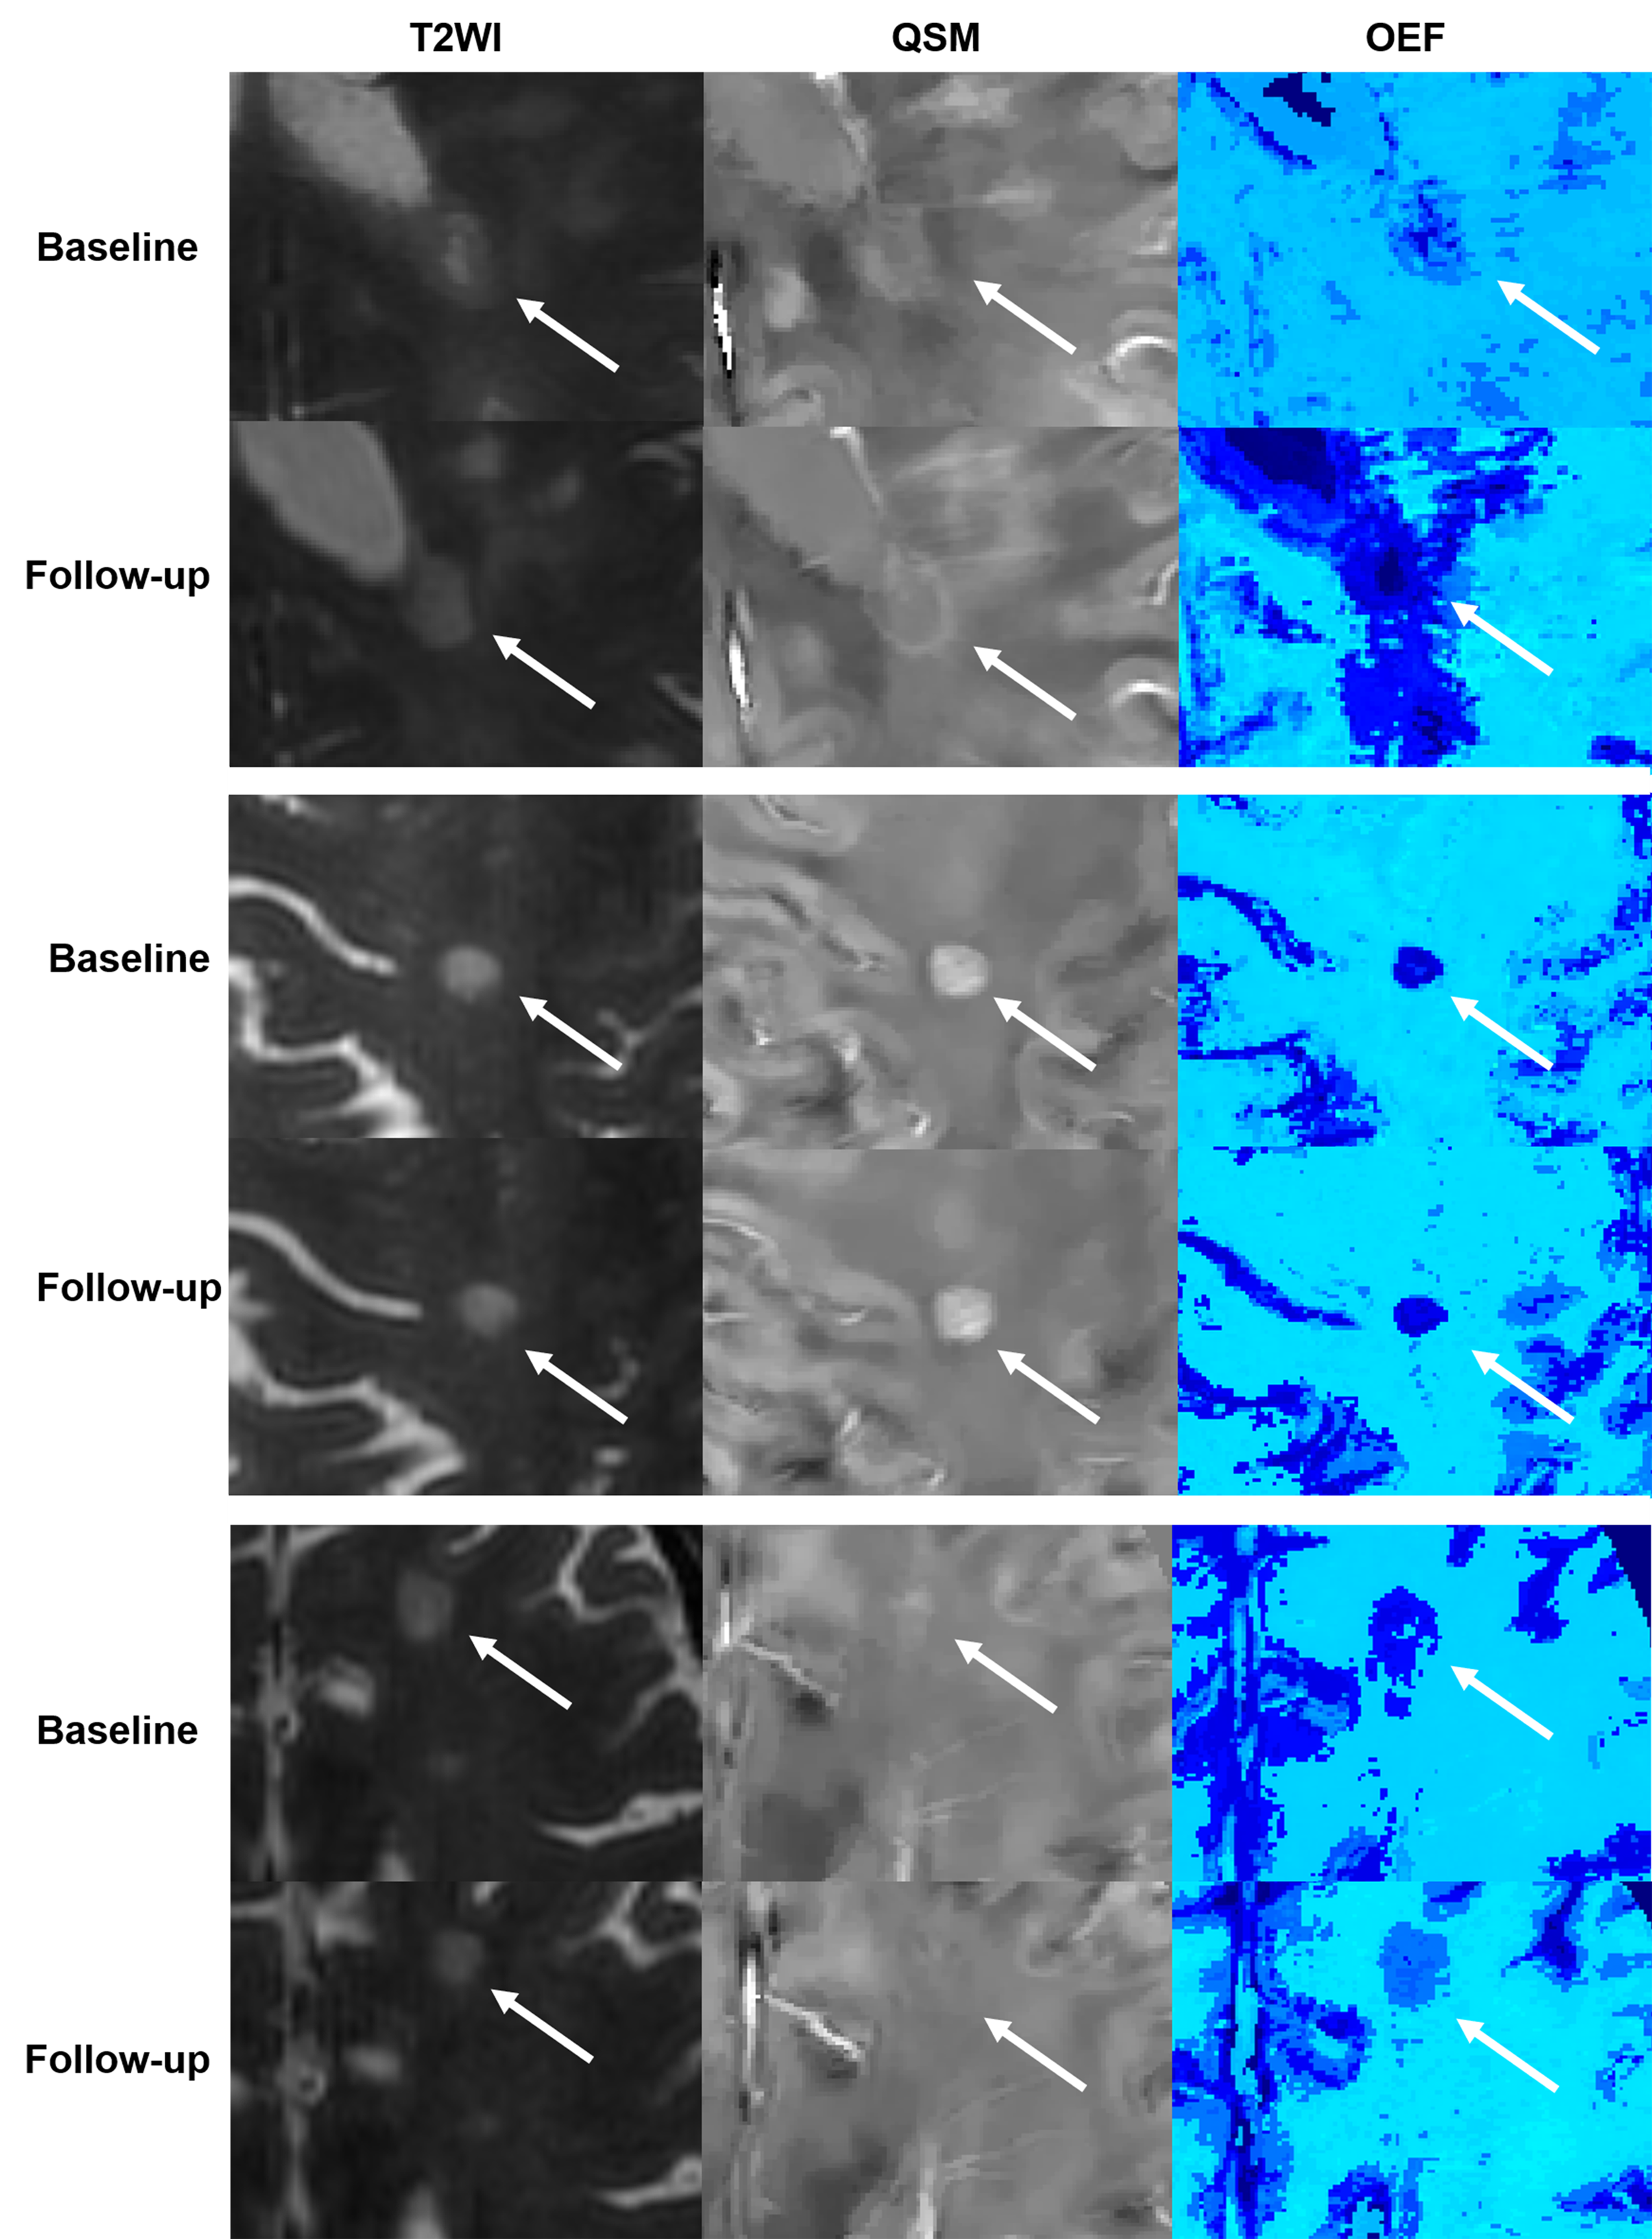
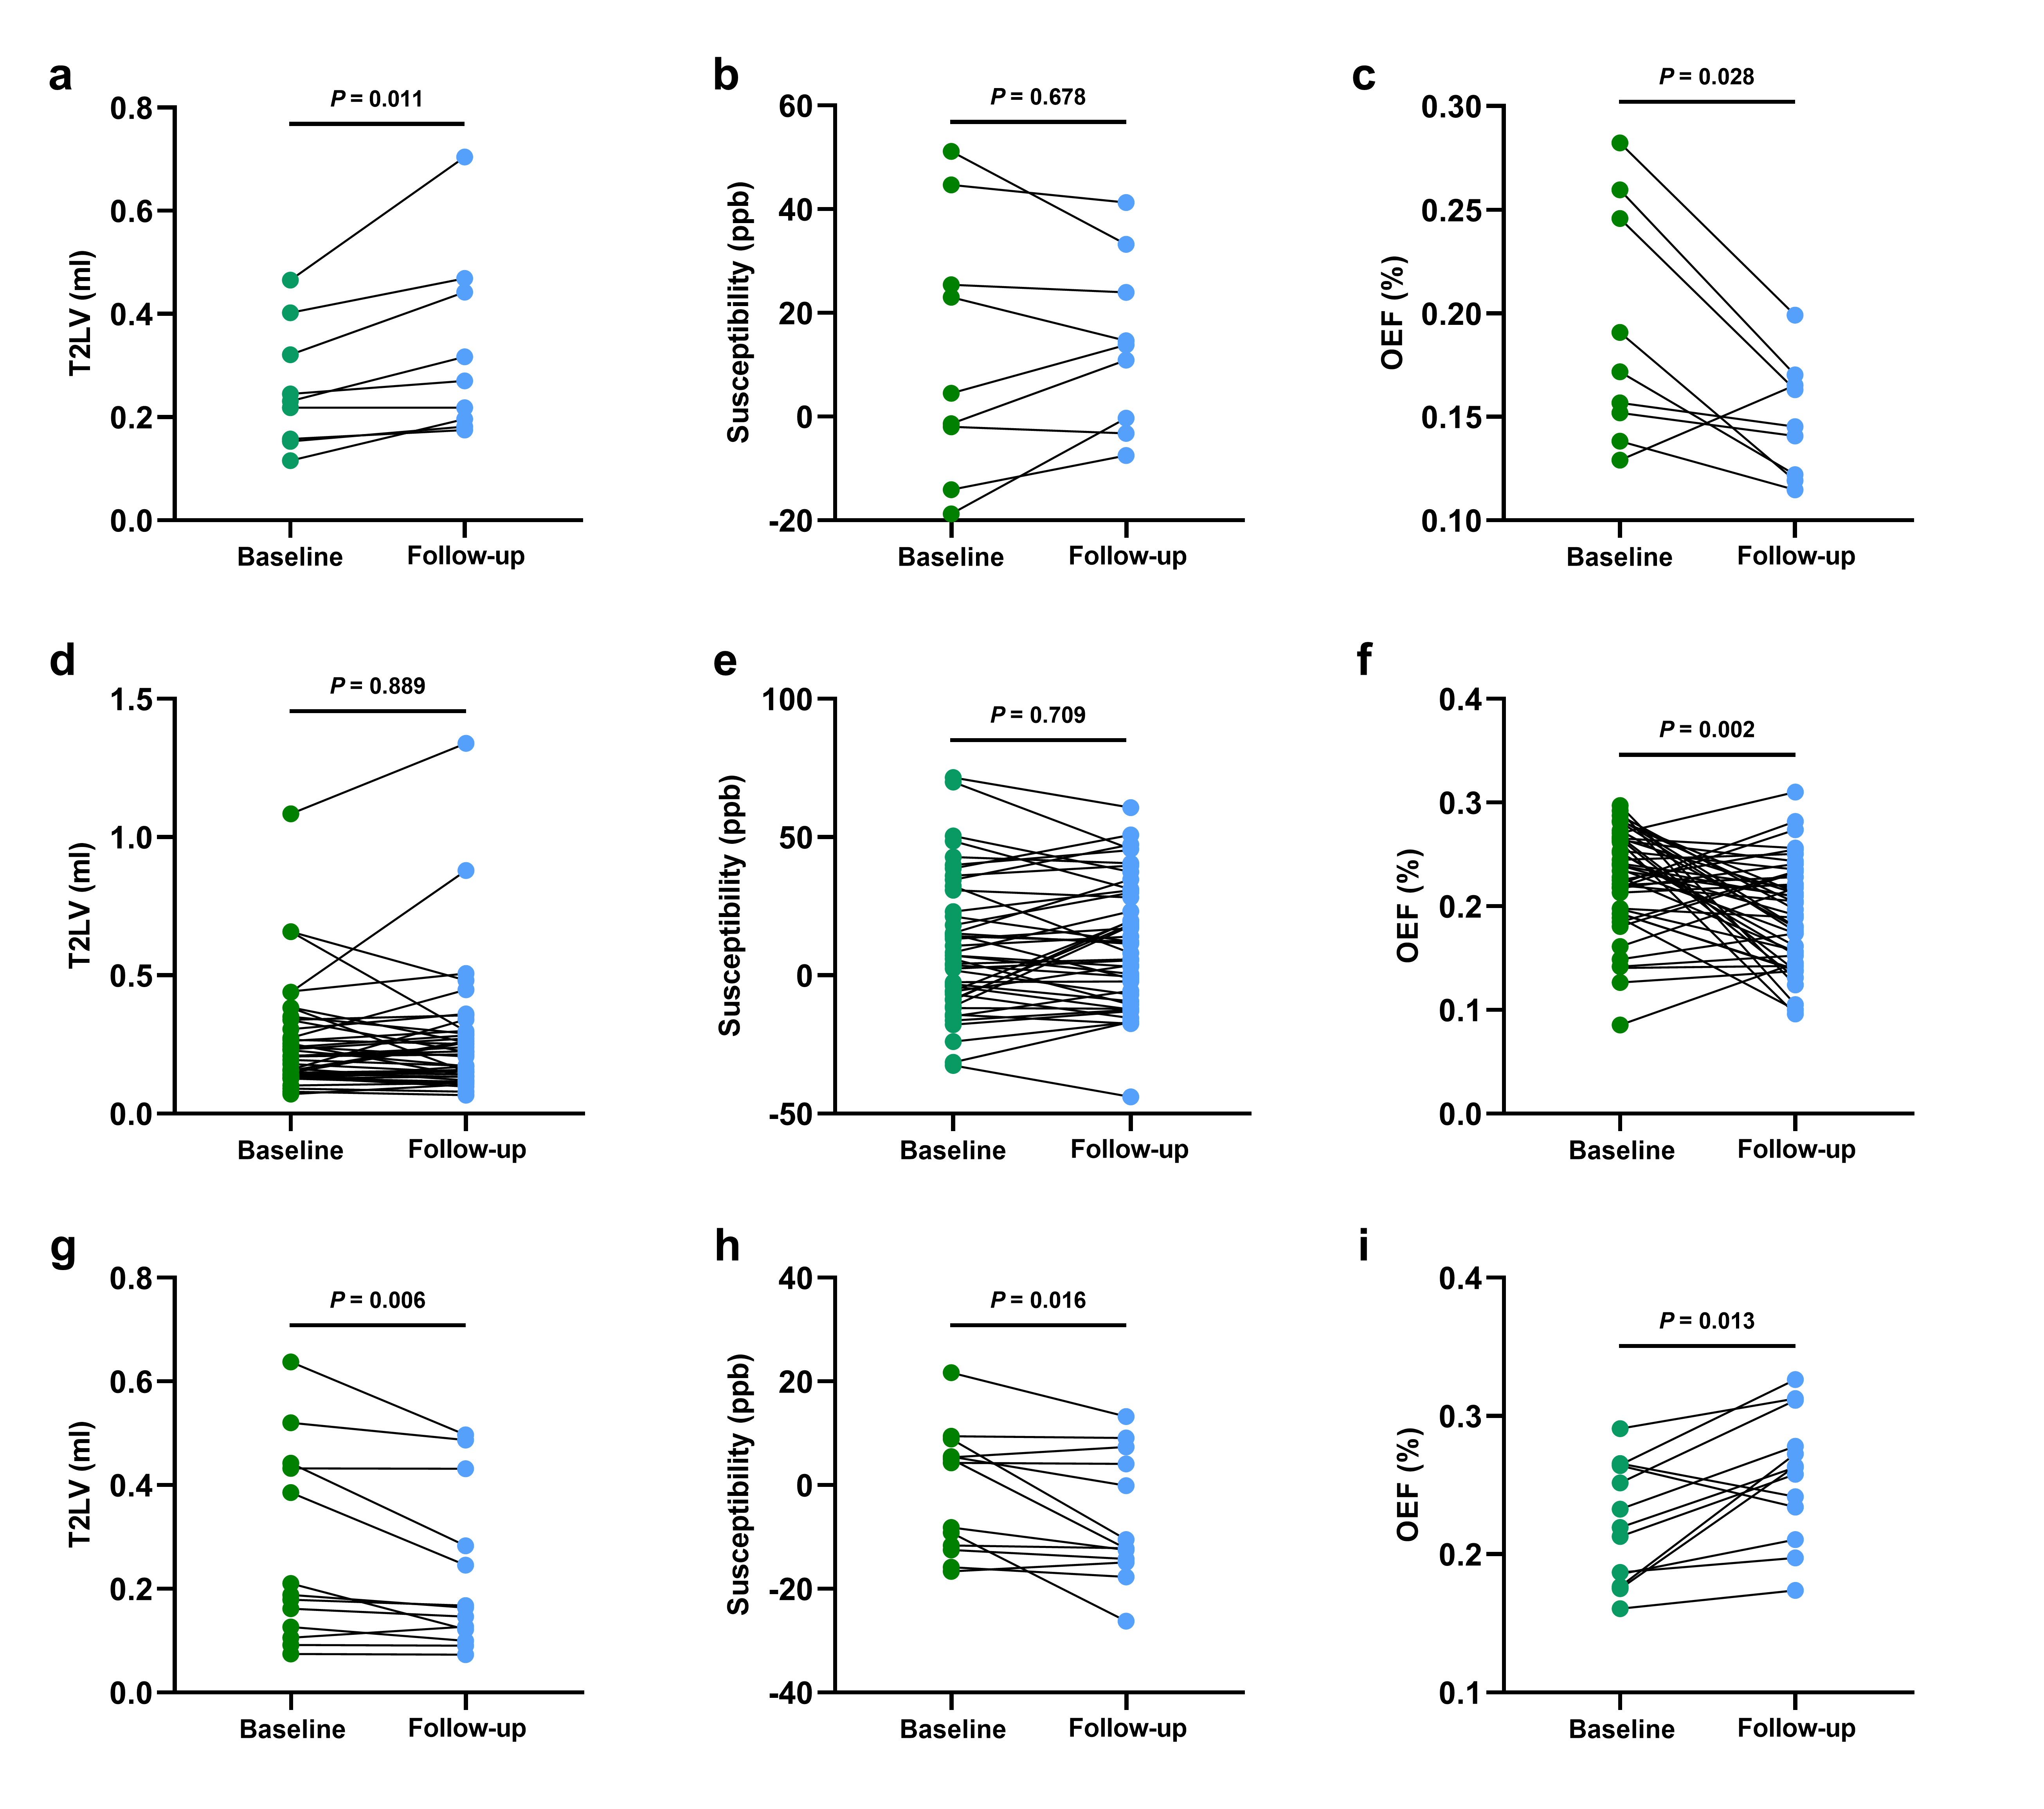
Forty-seven ELs, 146 PRLs, 327 hyperintense lesions and 146 non-hyperintense lesions were included in cross-sectional study (Figure 1). The susceptibility of PRLs was significantly higher than that of the remaining five white matter tissues (Figure 2). The hyperintense lesions had higher susceptibility than ELs, non-hyperintense lesions, normal appear white matter in RRMS and white matter in HC. The PRLs had lower OEF than ELs, hyperintense lesions and non-hyperintense lesions. The OEF of hyperintense lesions was significantly lower than that of non-hyperintense lesions.There were 55 PRLs, 67 hyperintense lesions and 33 non-hyperintense lesions included in longitudinal analysis. The T2VL and susceptibility of PRL at follow-up were significantly increased compared with that at baseline (P=0.001, P=0.001, Figure 3). The OEF of PRL and hyperintense lesion at follow-up was significantly decreased (P<0.001, P=0.011). During the follow-up period, 9 hyperintense lesions converted to PRLs, 13 hyperintense lesions converted to non-hyperintense lesions and the remaining 133 lesions remained unchanged lesion type. Therefore, hyperintense lesions were categorized into three groups (Figure 4). In longitudinal analysis, hyperintense lesions that converted to PRLs had significantly increased T2LV and decreased OEF, hyperintense lesions with unchanged subtype had significantly decreased OEF, and hyperintense lesions that converted to non-hyperintense lesions had significantly decreased T2VL and susceptibility, and increased OEF (P=0.013) (Figure 5).
Discussion
MS patients may develop global cerebral hypoperfusion due to decreased axonal activity, reduced energy metabolism in astrocytes, and increased endothelin-1 concentrations in the blood[10]. However, the increased energy demand of impulse conduction along excitable demyelinated axons and reduced axonal ATP production, leaves demyelinated axons chronically hypoxic[11]. Chronic necrosis of axons and mitochondrial dysfunction are therefore manifested as a decrease in focal OEF. PRLs have been a topic of great interest in MS research in recent years. In longitudinal analysis, we found that PRLs had greater volume, higher susceptibility, and lower OEF at follow-up. The above results demonstrate PRLs are more likely to cause progressive tissue damage and may be a key factor in MS disease progression.Notably, we found the conversion of lesion type in the hyperintense lesions, which may become an important indicator to evaluate the effect of treatment. Calvi et al. found more slowly expanding MS lesions could be identified than PRLs, and some MS lesions without paramagnetic rims also expanded over time[12]. This may be related to the conversion of chronic inactive lesions to chronic active lesions, and more histologic studies are needed to understand the pathological relevance.
Conclusion
The OEF could indirectly reflect the severity of tissue damage and distinguish different types of MS lesion in white matter by monitoring tissue oxygen extraction efficiency in a noninvasive quantitative manner.Acknowledgements
This work was supported by the National Natural Science Foundation of China [grant numbers U22A20354 and 81730049].References
1 Frischer JM, Weigand SD, Guo Y et al (2015) Clinical and pathological insights into the dynamic nature of the white matter multiple sclerosis plaque. Ann Neurol 78:710-721
2 Kuhlmann T, Ludwin S, Prat A, Antel J, Bruck W, Lassmann H (2017) An updated histological classification system for multiple sclerosis lesions. Acta Neuropathol 133:13-24
3 Filippi M, Brück W, Chard D et al (2019) Association between pathological and MRI findings in multiple sclerosis. The Lancet Neurology 18:198-210
4 Dal-Bianco A, Grabner G, Kronnerwetter C et al (2017) Slow expansion of multiple sclerosis iron rim lesions: pathology and 7 T magnetic resonance imaging. Acta Neuropathol 133:25-42
5 Guo Z, Long L, Qiu W et al (2021) The Distributional Characteristics of Multiple Sclerosis Lesions on Quantitative Susceptibility Mapping and Their Correlation With Clinical Severity. Front Neurol 12:647519
6 Marcille M, Hurtado Rua S, Tyshkov C et al (2022) Disease correlates of rim lesions on quantitative susceptibility mapping in multiple sclerosis. Sci Rep 12:4411
7 Rahmanzadeh R, Galbusera R, Lu PJ et al (2022) A New Advanced MRI Biomarker for Remyelinated Lesions in Multiple Sclerosis. Ann Neurol 92:486-502
8 Liu Z, Spincemaille P, Yao Y, Zhang Y, Wang Y (2018) MEDI+0: Morphology enabled dipole inversion with automatic uniform cerebrospinal fluid zero reference for quantitative susceptibility mapping. Magn Reson Med 79:2795-2803
9 Cho J, Spincemaille P, Nguyen TD, Gupta A, Wang Y (2021) Temporal clustering, tissue composition, and total variation for mapping oxygen extraction fraction using QSM and quantitative BOLD. Magn Reson Med 86:2635-2646
10 D'Haeseleer M, Cambron M, Vanopdenbosch L, De Keyser J (2011) Vascular aspects of multiple sclerosis. The Lancet Neurology 10:657-666
11 Trapp BD, Stys PK (2009) Virtual hypoxia and chronic necrosis of demyelinated axons in multiple sclerosis. Lancet Neurol 8:280-291
12 Calvi A, Clarke MA, Prados F et al (2023) Relationship between paramagnetic rim lesions and slowly expanding lesions in multiple sclerosis. Mult Scler 29:352-362
Figures