1050
Multiparametric Quantitative MRI Shows Enhanced Degeneration in Paramagnetic Rim Lesions and Their Perilesional Tissue in Multiple Sclerosis1Translational Imaging in Neurology (ThINk) Basel, Department of Biomedical Engineering, University Hospital Basel and University of Basel, Basel, Switzerland, 2Department of Neurology, University Hospital Basel, Basel, Switzerland, 3Research Center for Clinical Neuroimmunology and Neuroscience Basel (RC2NB), University Hospital Basel and University of Basel, Basel, Switzerland, 4Department of Health Sciences, University of Genova, Genova, Italy, 5Cerrahpasa Medical School, Istanbul University-Cerrahpasa, Istanbul, Turkey, 6Department of Clinical Research, University Hospital Basel, University of Basel, Basel, Switzerland, 7Division of Radiological Physics, Department of Radiology, University Hospital Basel, Basel, Switzerland, 8Laboratory for Research in Neuroimaging, Department of Clinical Neuroscience, Lausanne University Hospital and University of Lausanne, Lausanne, Switzerland, 9Department of Radiology, Weill Cornell Medical College, New York, NY, United States, 10Laboratory for Imaging Science and Technology, Department of Electrical and Computer Engineering, Seoul National University, Seoul, Korea, Republic of
Synopsis
Keywords: Multiple Sclerosis, Multiple Sclerosis, Paramagnetic rim lesions; quantitative MRI
Motivation: Paramagnetic rim lesions (PRLs), a subset of chronic active lesions identifiable through susceptibility-based imaging, are linked to insidious disease progression in multiple sclerosis (MS). However, data on local microstructural changes in PRLs remain limited.
Goal(s): To comprehensively characterize pathological alterations within PRLs and the surrounding perilesional tissue.
Approach: Employing multiparametric quantitative 3T MRI on 175 people with MS, we obtained contrasts sensitive to tissue microstructural damage.
Results: PRLs exhibited more pronounced pathological alterations compared to other white matter lesions, displaying enhanced demyelination, neuro-axonal loss, and iron accumulation. Remarkably, these alterations extended into the perilesional tissue appearing normal on conventional MRI.
Impact: In people with multiple sclerosis, paramagnetic rim lesions (PRLs) exhibit pronounced microstructural quantitative MRI alterations. This strengthens PRLs as reliable biomarkers for lesions with smoldering degenerative activity, and offers potential insights into their association with a more severe disease course.
Introduction
White matter lesions in multiple sclerosis (MS) display significant variability in the extent of inflammatory, degenerative, and repair processes.1 Among MS lesions, chronic active lesions are characterized by persistent inflammation and smoldering degeneration, contributing to subtle disease progression in people with MS.2 A subset of chronic active lesions, known as paramagnetic rim lesions (PRLs), can be identified in vivo due to the accumulation of iron-laden microglia/macrophages at the lesion's periphery.3,4 PRLs have been linked to more severe disease outcomes,3 and a pathological study suggested that Wallerian degeneration might originate from PRLs and contribute to PRL-associated damage.5We conducted a multiparametric quantitative MRI (qMRI) investigation to explore the microstructural tissue changes associated with PRLs, both within the lesions and in the surrounding tissue that appears normal on conventional MRI. We compared focal changes between PRLs and other white matter lesions (“non-PRLs”) using various qMRI metrics sensitive to myelin, neuro-axonal, and iron content.
Methods
We included in the study 175 people with MS (Table 1) and 104 healthy controls. We examined microstructural changes using multiple qMRI metrics, including: i) quantitative-T1 (qT1), as an indicator of micro-macrostructural integrity; ii) magnetization transfer saturation (MTsat), measuring macromolecular content; iii) myelin water fraction (MWF) and iv) the diamagnetic χ-separation component, as proxies for myelin content; v) the intracellular volume fraction (ICVF), as a marker of axon-dendrite density; and iv) the paramagnetic χ-separation component, serving as a proxy for iron content.6MRI acquisition
All participants underwent the same 3T MRI protocol, which included 3D-FLAIR, 3D-MP2RAGE, multi-shell diffusion, 3D-EPI, three 3D gradient echo acquisitions for MTsat map, fast acquisition with spiral trajectory (FAST-T2), and multi-echo gradient echo imaging. Protocol details are reported in Table 2.
MRI processing
qT1 maps were derived from MP2RAGE images.7 MTsat maps were computed as previously proposed.8–10 Microscopic diffusion processes were modeled using NODDI.11 Quantitative susceptibility maps (QSM) were reconstructed from 3D-EPI images,12 and paramagnetic and diamagnetic susceptibility maps were generated using the χ-separation algorithm on multi-echo gradient echo images and FAST-T2.13
MRI analysis
White matter lesions were semi-automatically segmented. PRLs, defined as discrete FLAIR-hyperintense lesions entirely or partially surrounded by a paramagnetic signal rim in unwrapped phase/QSM, were manually identified and segmented by two raters by consensus (Figure 1). Progressive expansions of the lesion masks were performed to obtain the segmentation of the normal-appearing perilesional white matter (divided into two concentric rings, each 2 mm wide). The regions of interest (ROIs), comprising the lesion and perilesional tissue, were then transformed to the original space of the different qMRI contrasts, and local mean intensity was extracted.
Statistical analysis
For each ROI, we quantified the percentage deviation of each qMRI metric from the corresponding brain location in the healthy control population (to account for physiological tissue composition differences across different brain areas). We then compared the alterations in qMRI metrics between the pool of PRLs and non-PRLs in each subject using the Wilcoxon signed-rank test. The comparison was also conducted lesion-wise, employing mixed-effect models. The models used the deviation from the healthy control population as the dependent variable and the lesion type (PRL vs non-PRL) as the explanatory variable, adjusting for age and sex and introducing random intercepts for subjects.
Results
Compared to non-PRLs, PRLs exhibited more severe damage in all considered qMRI metrics, including prolonged T1-relaxation time, reduced MTsat, MWF, ICVF, and diamagnetic χ-map values, and increased paramagnetic χ-map values (all p<0.0001). The perilesional tissue also displayed more pronounced alterations in qT1, MTsat, MWF, and ICVF for PRLs compared to non-PRLs. The qMRI differences between PRLs and non-PRLs were most prominent within the lesions, gradually diminishing in magnitude but remaining statistically significant within the two concentric 2-mm thick perilesional rings (Figure 2).The results were confirmed when comparing PRLs and non-PRLs lesion-wise (the magnitude of the difference between PRLs and non-PRLs in qMRI alterations is visually depicted in Figure 3).
Discussion
Our study highlights the pronounced microstructural changes associated with PRLs in the brain of MS patients. PRLs, which are increasingly recognized as potential contributors to more severe disease courses, exhibited significant qMRI alterations indicative of heightened tissue damage, including increased demyelination, neuro-axonal loss, and iron accumulation. These changes extended beyond the lesion boundaries, affecting the surrounding perilesional tissue, further emphasizing the broader impact of PRLs on the MS brain.Conclusion
Our findings emphasize the importance of PRLs as negative prognostic markers in MS. Understanding the distinctive characteristics of PRLs is crucial for early identification and for the implementation of targeted interventions in MS patients with more aggressive disease courses.Acknowledgements
No acknowledgement found.References
1. Lucchinetti C, Brück W, Parisi J, Scheithauer B, Rodriguez M, Lassmann H. Heterogeneity of multiple sclerosis lesions: Implications for the pathogenesis of demyelination. Ann Neurol. 2000;47(6):707-717. doi:10.1002/1531-8249(200006)47:6<707::AID-ANA3>3.0.CO;2-Q
2. Luchetti S, Fransen NL, van Eden CG, Ramaglia V, Mason M, Huitinga I. Progressive multiple sclerosis patients show substantial lesion activity that correlates with clinical disease severity and sex: a retrospective autopsy cohort analysis. Acta Neuropathol. 2018;135(4):511-528. doi:10.1007/S00401-018-1818-Y
3. Absinta M, Sati P, Masuzzo F, et al. Association of Chronic Active Multiple Sclerosis Lesions With Disability In Vivo. JAMA Neurol. 2019;76(12):1474. doi:10.1001/JAMANEUROL.2019.2399
4. Dal-Bianco A, Grabner G, Kronnerwetter C, et al. Slow expansion of multiple sclerosis iron rim lesions: pathology and 7 T magnetic resonance imaging. Acta Neuropathol. 2017;133(1):25. doi:10.1007/S00401-016-1636-Z
5. Dal-Bianco A, Grabner G, Kronnerwetter C, et al. Long-term evolution of multiple sclerosis iron rim lesions in 7 T MRI. Brain. 2021;144(3):833-847. doi:10.1093/brain/awaa436
6. Granziera C, Wuerfel J, Barkhof F, et al. Quantitative magnetic resonance imaging towards clinical application in multiple sclerosis. Brain. 2021;144(5):1296-1311. doi:10.1093/brain/awab029
7. Marques JP, Kober T, Krueger G, van der Zwaag W, Van de Moortele PF, Gruetter R. MP2RAGE, a self bias-field corrected sequence for improved segmentation and T1-mapping at high field. Neuroimage. 2010;49(2):1271-1281. doi:10.1016/j.neuroimage.2009.10.002
8. Helms G, Dathe H, Dechent P. Quantitative FLASH MRI at 3T using a rational approximation of the Ernst equation. Magn Reson Med. 2008;59(3):667-672. doi:10.1002/mrm.21542
9. Helms G, Dechent P. Increased SNR and reduced distortions by averaging multiple gradient echo signals in 3D FLASH imaging of the human brain at 3T. J Magn Reson Imaging. 2009;29(1):198-204. doi:10.1002/jmri.21629
10. Tabelow K, Balteau E, Ashburner J, et al. hMRI – A toolbox for quantitative MRI in neuroscience and clinical research. Neuroimage. 2019;194:191-210. doi:10.1016/j.neuroimage.2019.01.029
11. Zhang H, Schneider T, Wheeler-Kingshott CA, Alexander DC. NODDI: Practical in vivo neurite orientation dispersion and density imaging of the human brain. Neuroimage. 2012;61(4):1000-1016. doi:10.1016/j.neuroimage.2012.03.072
12. Liu T, Xu W, Spincemaille P, Avestimehr AS, Wang Y. Accuracy of the morphology enabled dipole inversion (MEDI) algorithm for quantitative susceptibility mapping in MRI. IEEE Trans Med Imaging. 2012;31(3):816-824. doi:10.1109/TMI.2011.2182523
13. Shin HG, Lee J, Yun YH, et al. χ-separation: Magnetic susceptibility source separation toward iron and myelin mapping in the brain. Neuroimage. 2021;240:118371. doi:10.1016/j.neuroimage.2021.118371
Figures
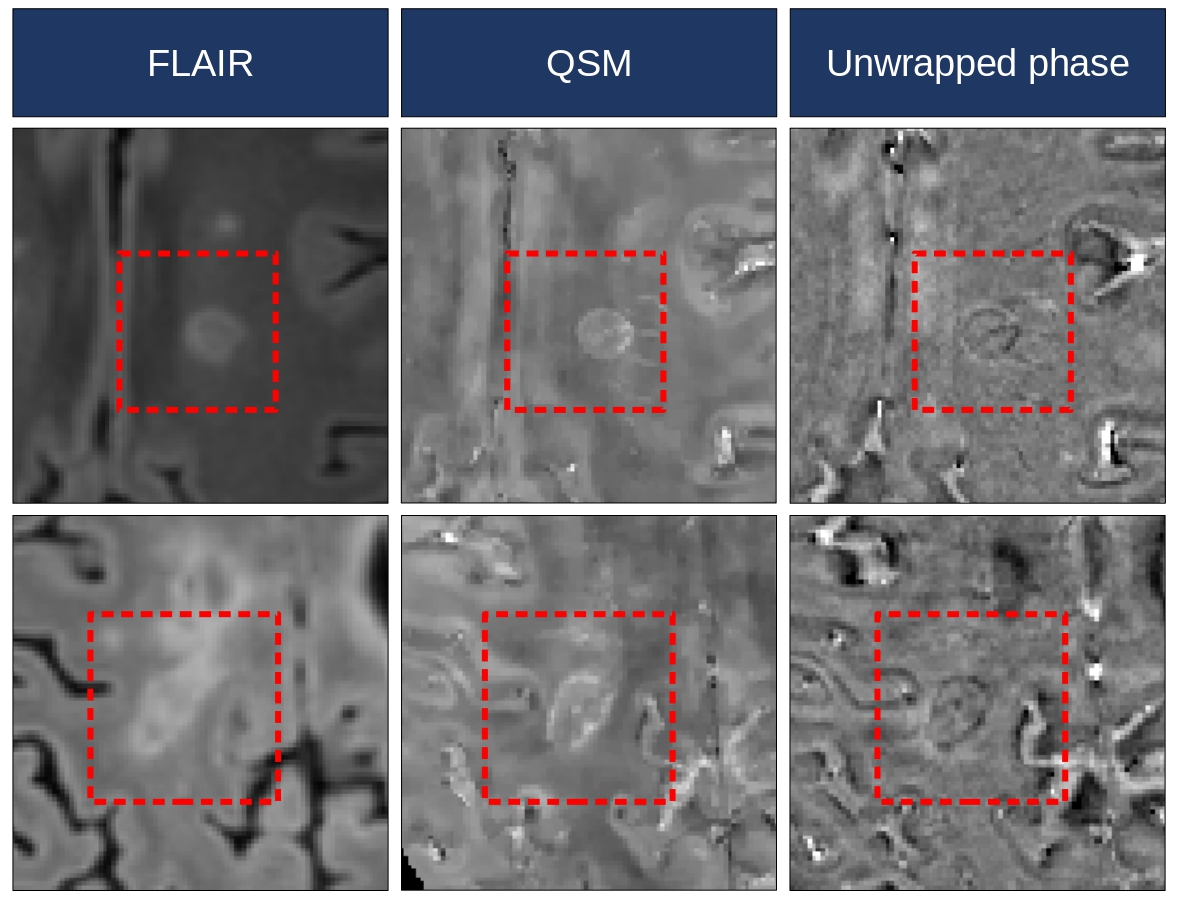
Figure 1. Examples of paramagnetic rim lesions
Two examples of FLAIR-hyperintense lesions displaying a rim of paramagnetic signal on both quantitative susceptibility mapping (QSM) and unwrapped phase images. Abbreviations: FLAIR: fluid-attenuated inversion recovery; QSM: quantitative susceptibility mapping.
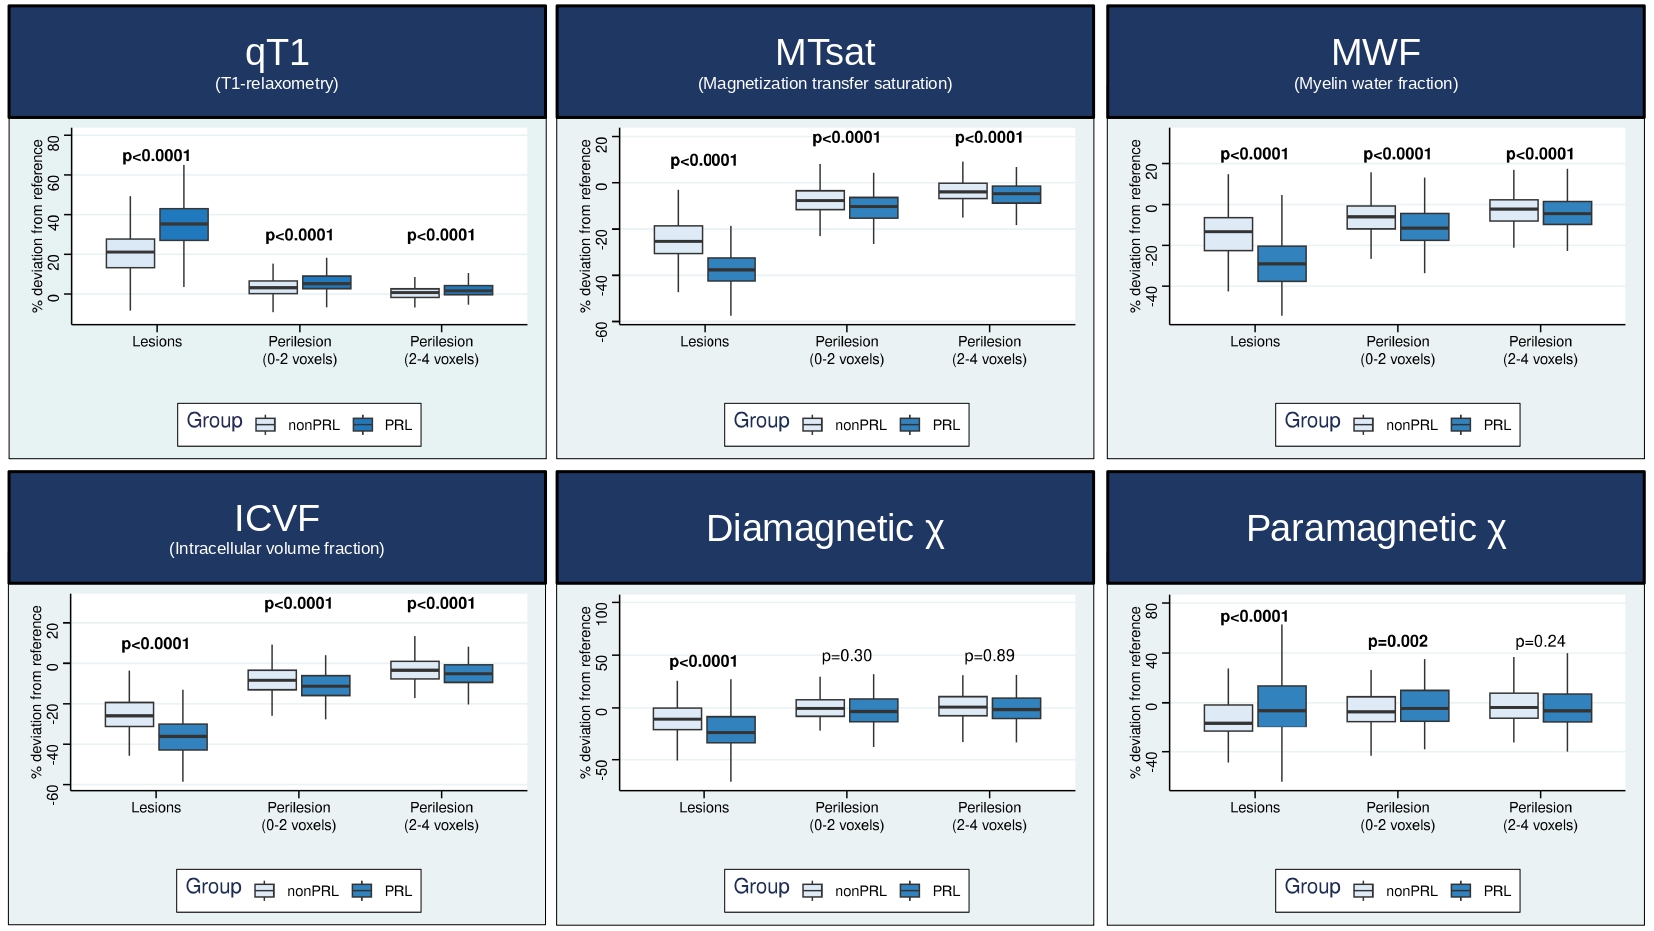
Figure 2. Comparisons in qMRI alterations between PRLs and non-PRLs
The comparisons in qMRI alterations (with reference to the healthy control population) between PRLs and non-PRLs were performed with the Wilcoxon signed-rank test.
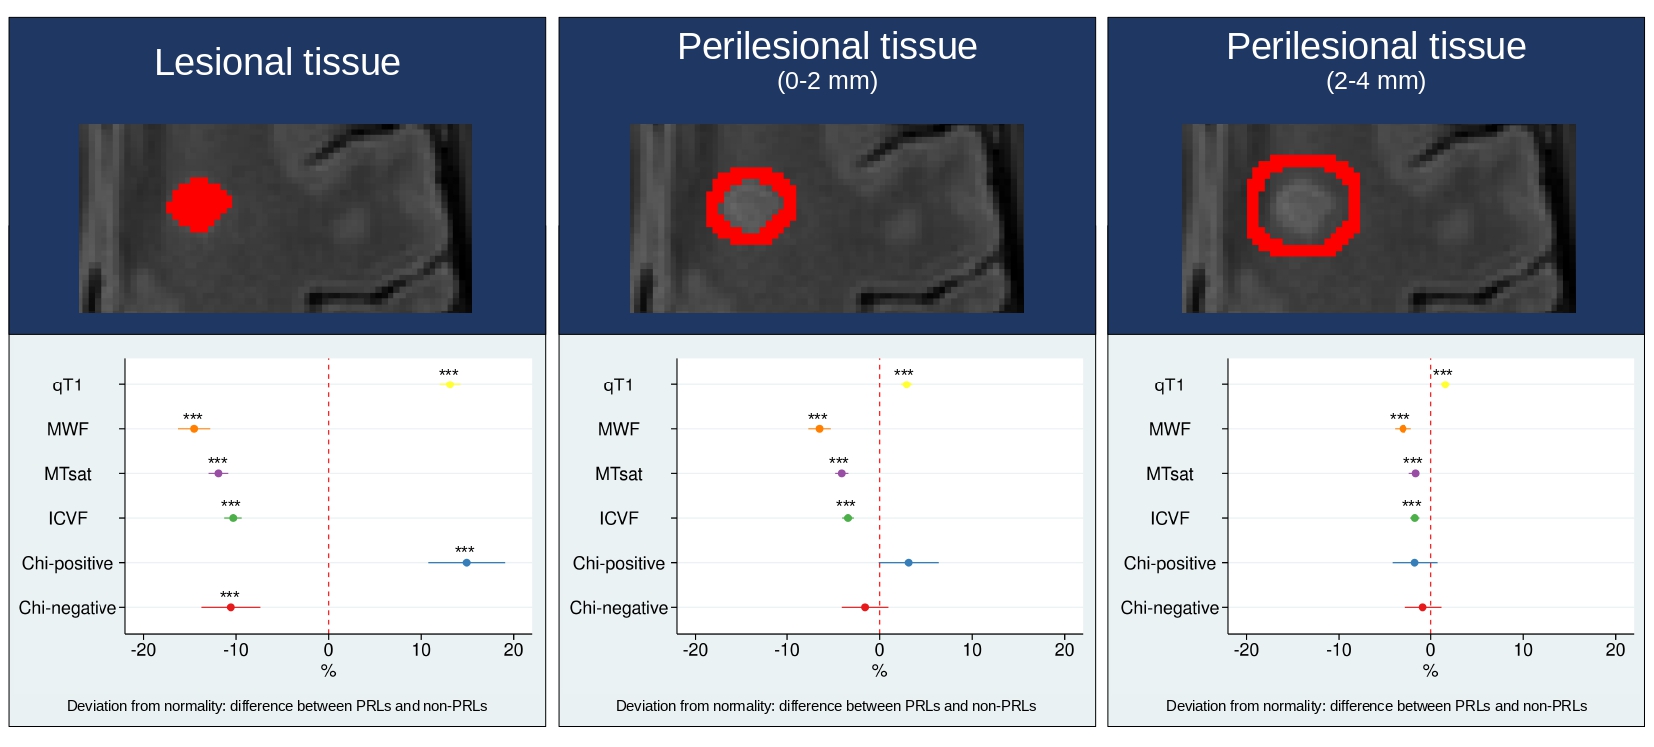
Figure 3. Difference between PRLs and non-PRLs in qMRI deviation from normality
Comparisons in qMRI alterations between PRLs and non-PRLs were explored lesion-wise with mixed-effect models, using the deviation from the healthy control population as the dependent variable and the lesion type (PRL vs non-PRL) as the explanatory variable, adjusting for age and sex, and introducing random intercepts for subjects. ***p<0.0001 Abbreviations: ICVF: intracellular volume fraction; MTsat: magnetization transfer saturation; MWF: myelin water fraction; qT1: quantitative T1.
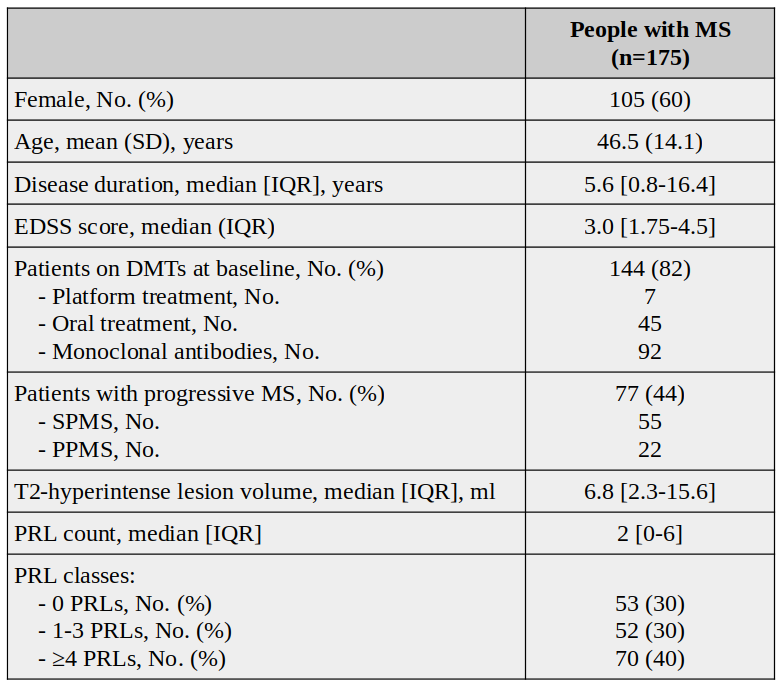
Table 1. Main demographic and clinical characteristics of people with multiple sclerosis
Abbreviations: DMTs: disease-modifying therapies; EDSS: Expanded Disability Status Scale score; IQR: interquartile range; MS: multiple sclerosis; No.: number; PPMS: primary-progressive multiple sclerosis; PRLs: paramagnetic rim lesions; SD: standard deviation; SPMS: secondary-progressive multiple sclerosis.
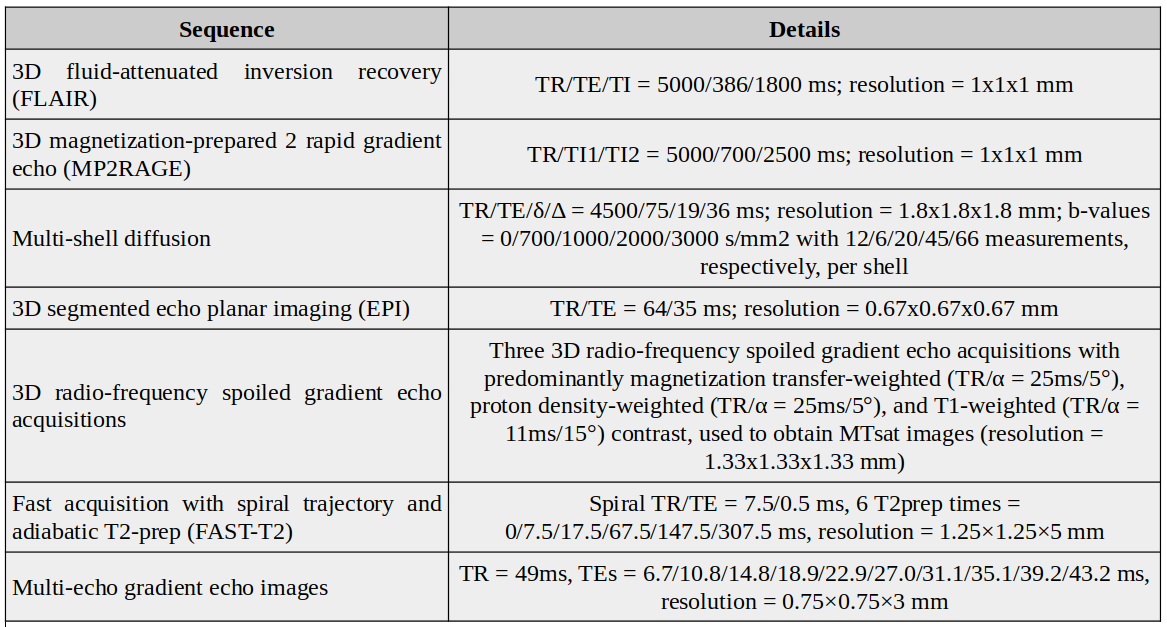
Table 2. MRI protocol details
All scans were obtained with a 3T whole-body MR scanner (Magnetom Prisma, Siemens Healthineers), using a 64-channel phased-array head and neck coil for radio-frequency reception.
Abbreviations: TE: echo time; TI: inversion time; TR: repetition time.