1047
Identification of transcriptomic signatures associated with cortical thinning in neuromyelitis optica spectrum disorder1Department of Radiology, Beijing Tiantan Hospital, Capital Medical University, Beijing, China, 2United Imaging Research Institute of Intelligent Imaging, Beijing, China
Synopsis
Keywords: Neuroinflammation, Genetics
Motivation: Determining the potential transcriptomic signatures driving cortical thinning in neuromyelitis optica spectrum disorder (NMOSD) and multiple sclerosis (MS).
Goal(s): To compare the cortical atrophy patterns and the underlying molecular mechanisms between NMOSD and MS.
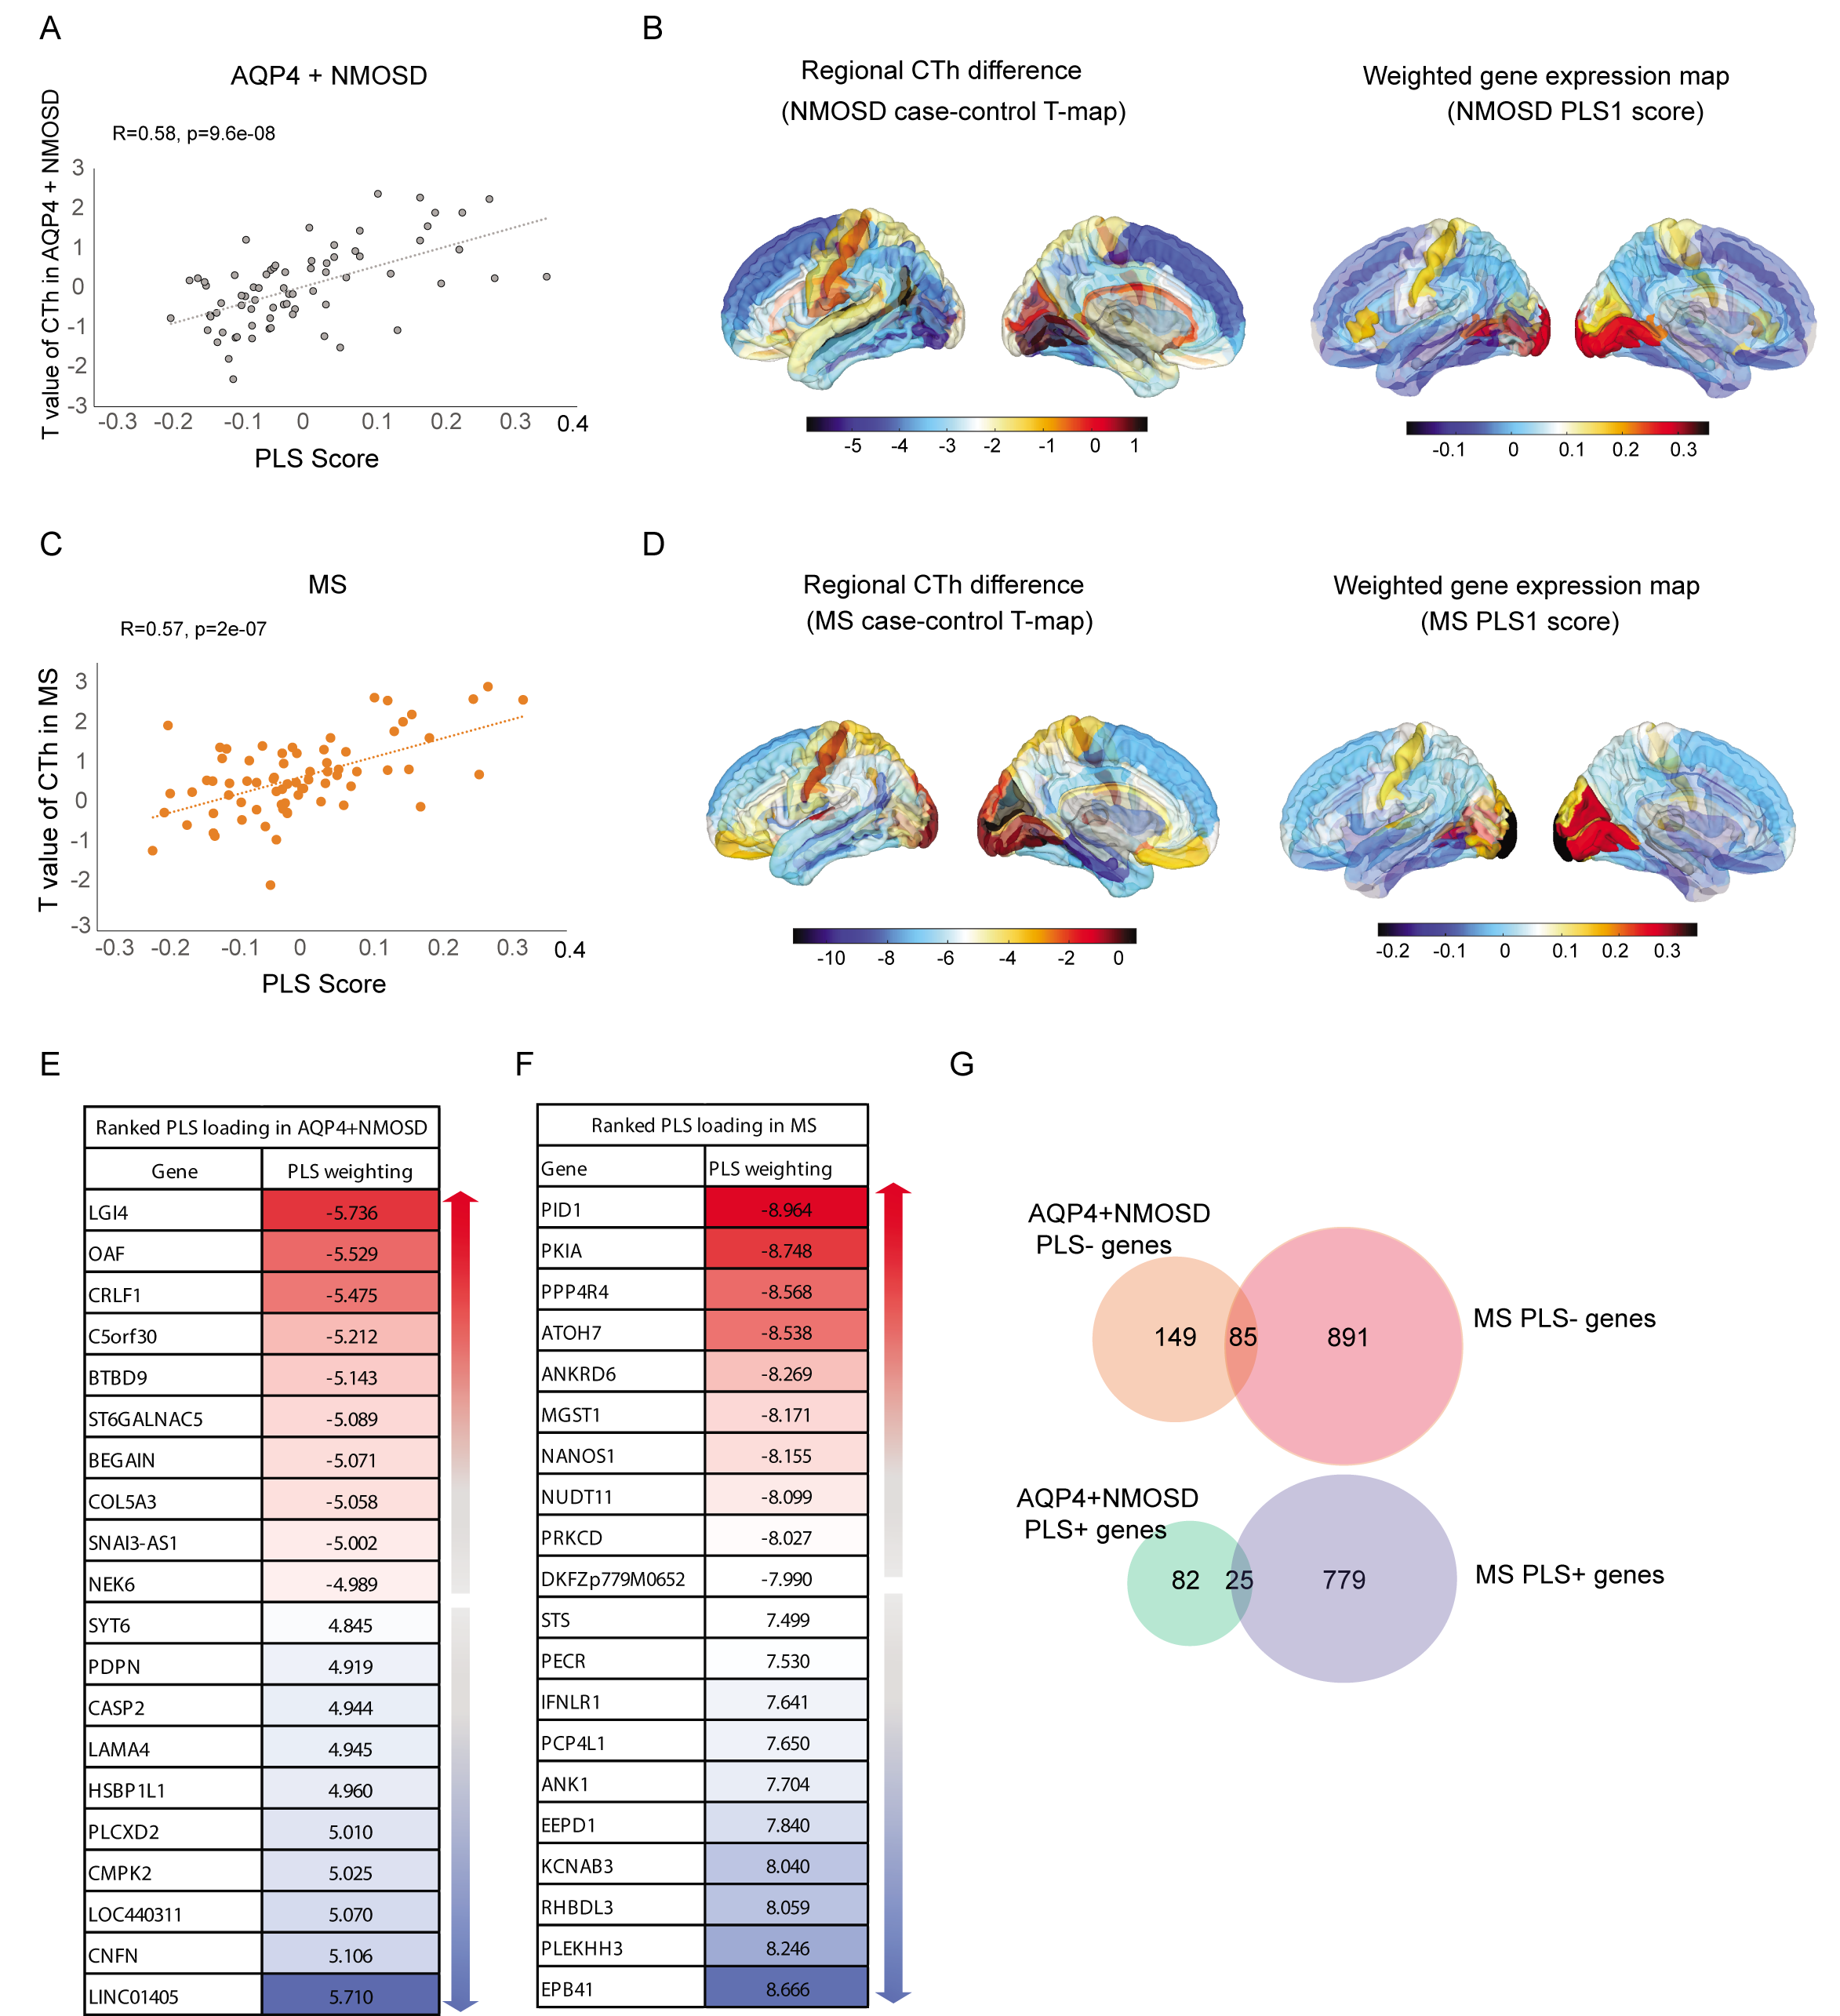
Approach: A partial least squares (PLS) regression model was used to associate the CTh alteration profile with the expression of genes from the Allen Human Brain Atlas (AHBA) database, then Metascape analysis was performed to identify the functional biological processes.
Results: Distinct cortical atrophy patterns and underlying cell signaling pathways were observed in NMOSD and MS.
Impact: The distinct cortical atrophy patterns will help in differential diagnosis of NOMOSD and MS. The identified genes and signaling pathways will help understand the pathological mechanism of both diseases and provide potential therapeutic targets.
Introduction
Distinct patterns of cortical thinning have been observed in neuromyelitis optica spectrum disorder (NMOSD) and multiple sclerosis (MS), but the potential transcriptomic signatures driving cortical thinning are unclear.Methods
The cortical thickness (CTh) values of 74 AQP4+ NMOSD patients, 166 MS patients and 327 healthy controls (HCs) were compared. A partial least squares (PLS) regression model was used to associate the CTh alteration profile with the expression of genes from the Allen Human Brain Atlas (AHBA) database. Metascape analysis was performed to identify the functional biological processes of these PLS genes, and these genes were linked with brain cell types to specify the contributing cells. The correlation distribution of PLS genes with clinical variable-associated CTh alterations was analyzed.Results
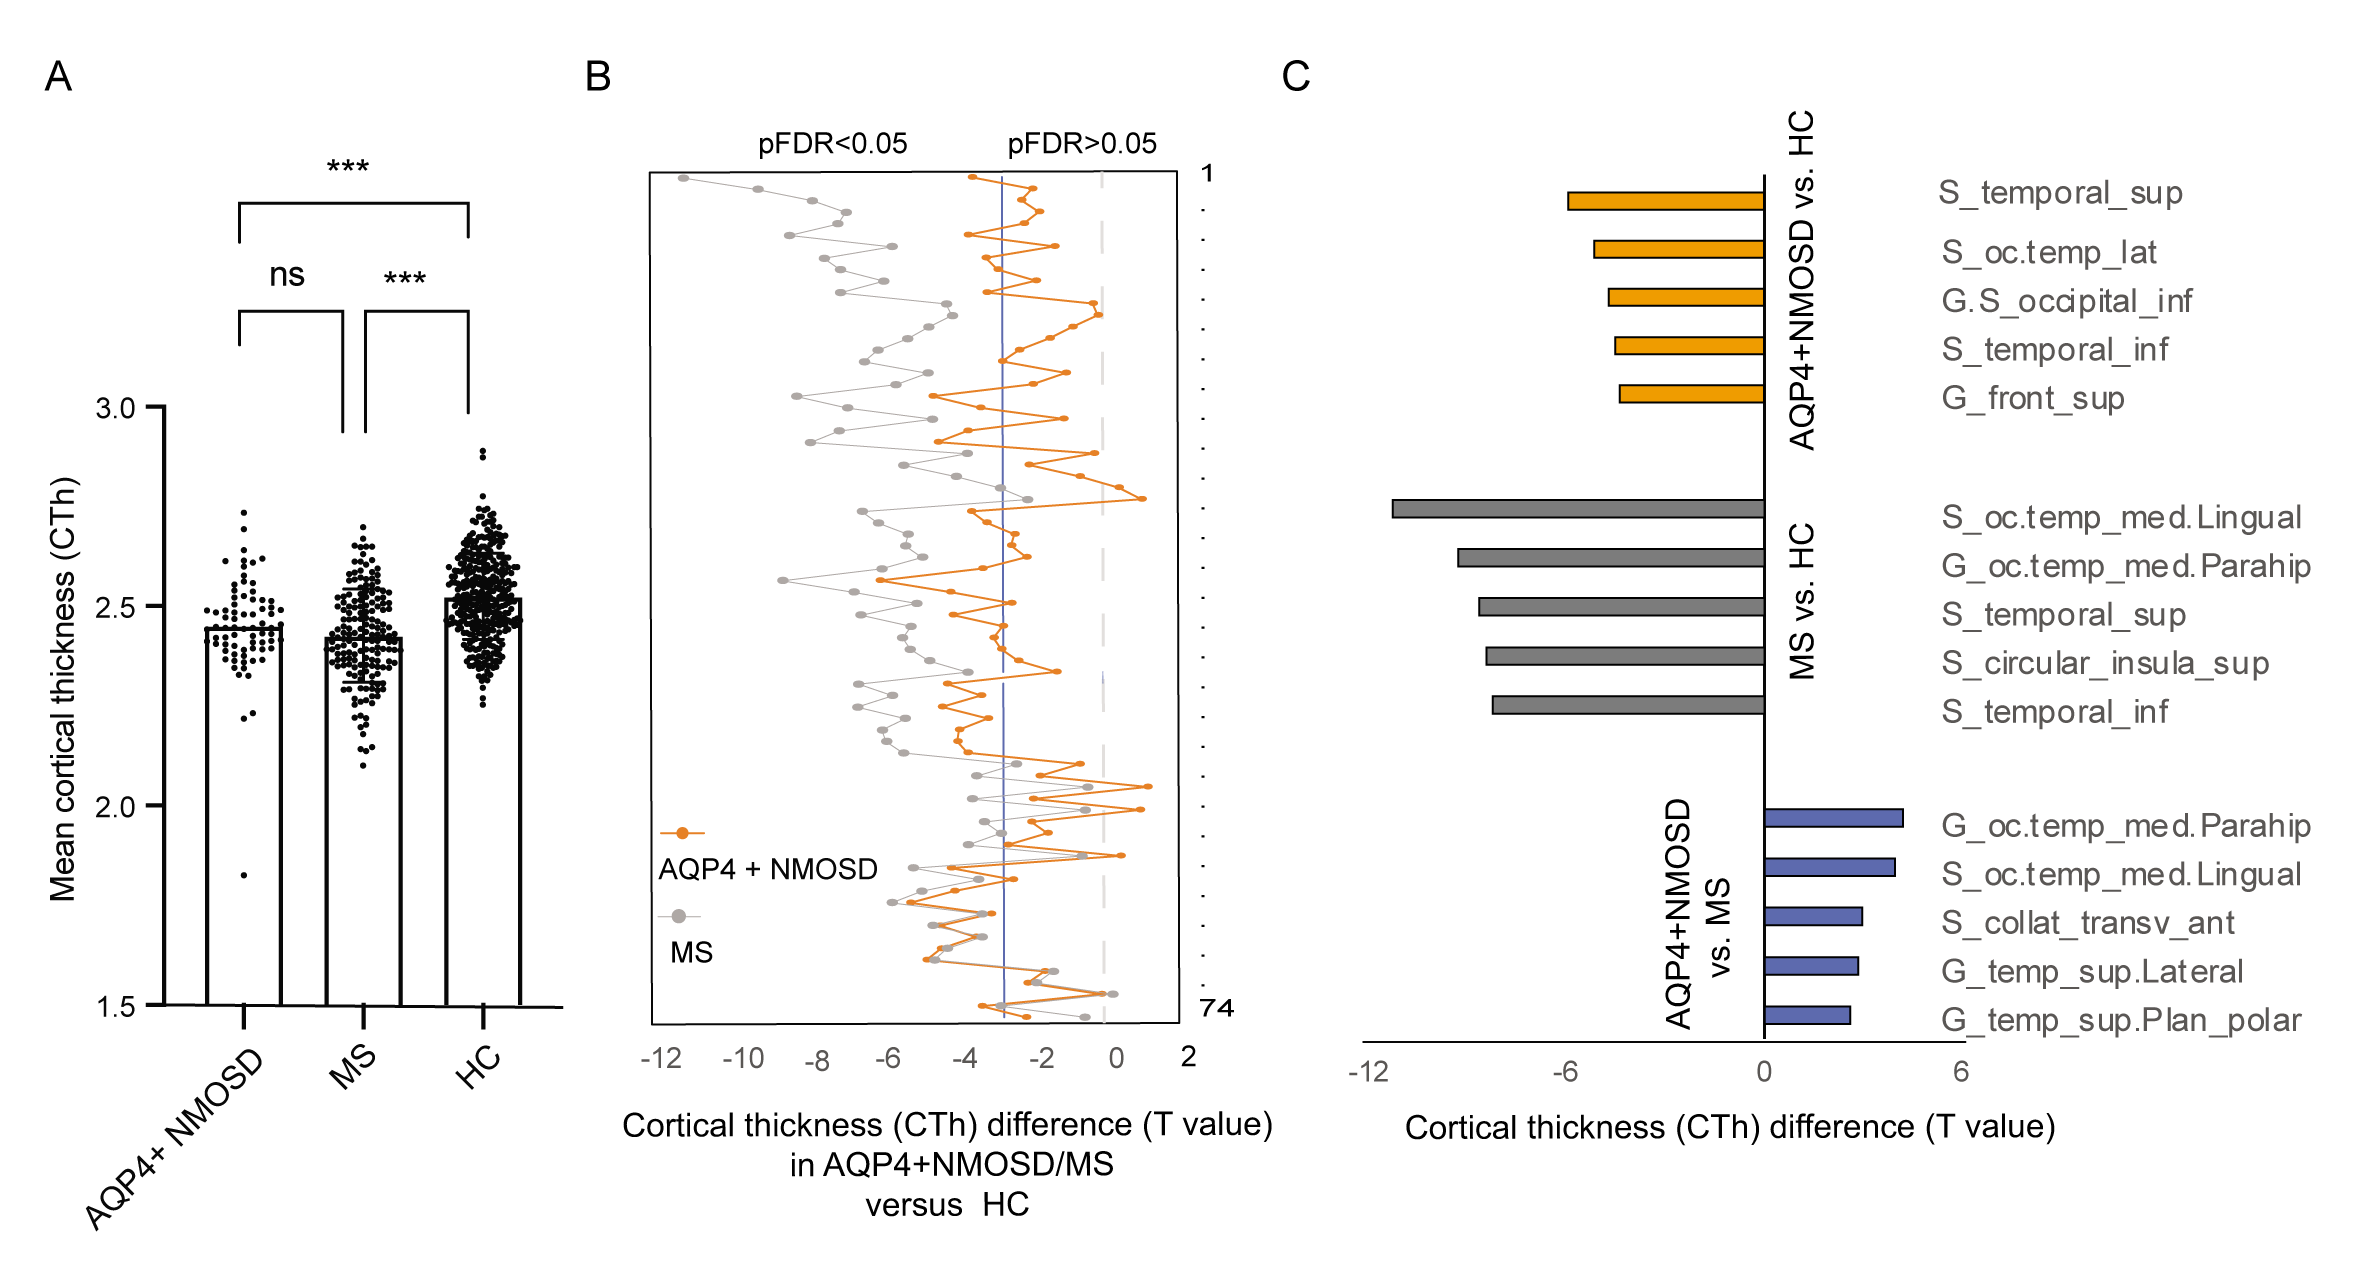
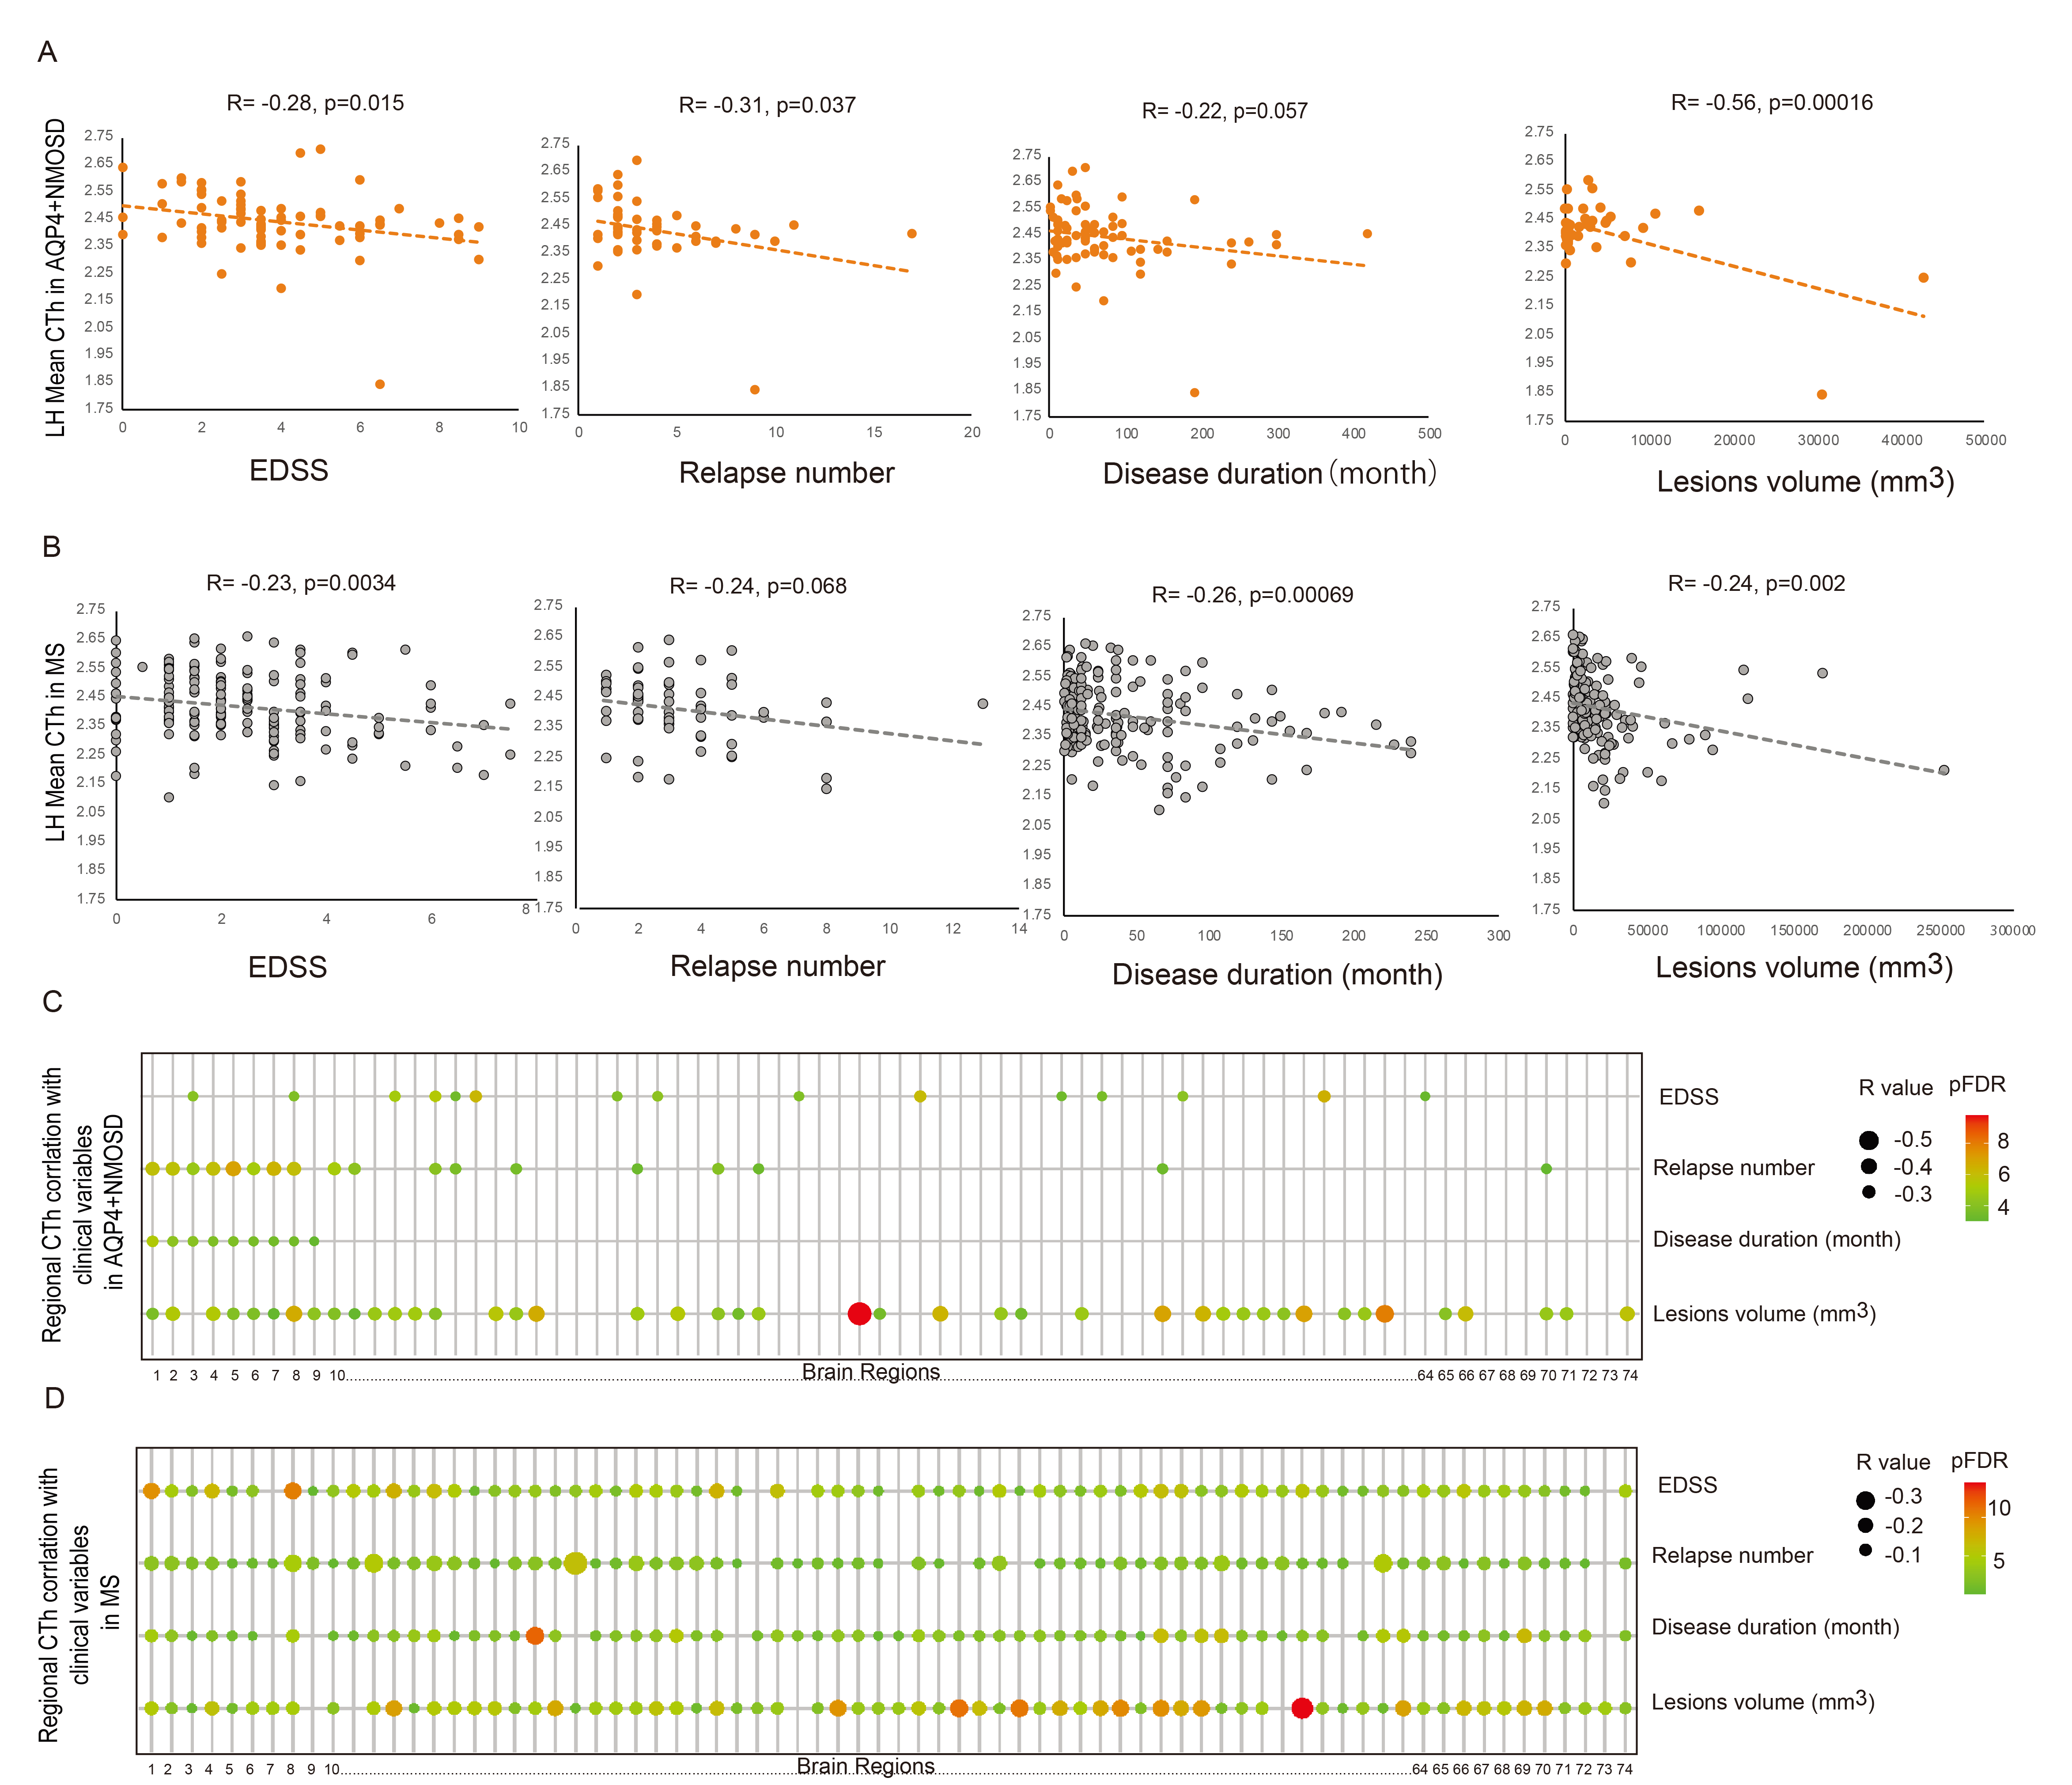
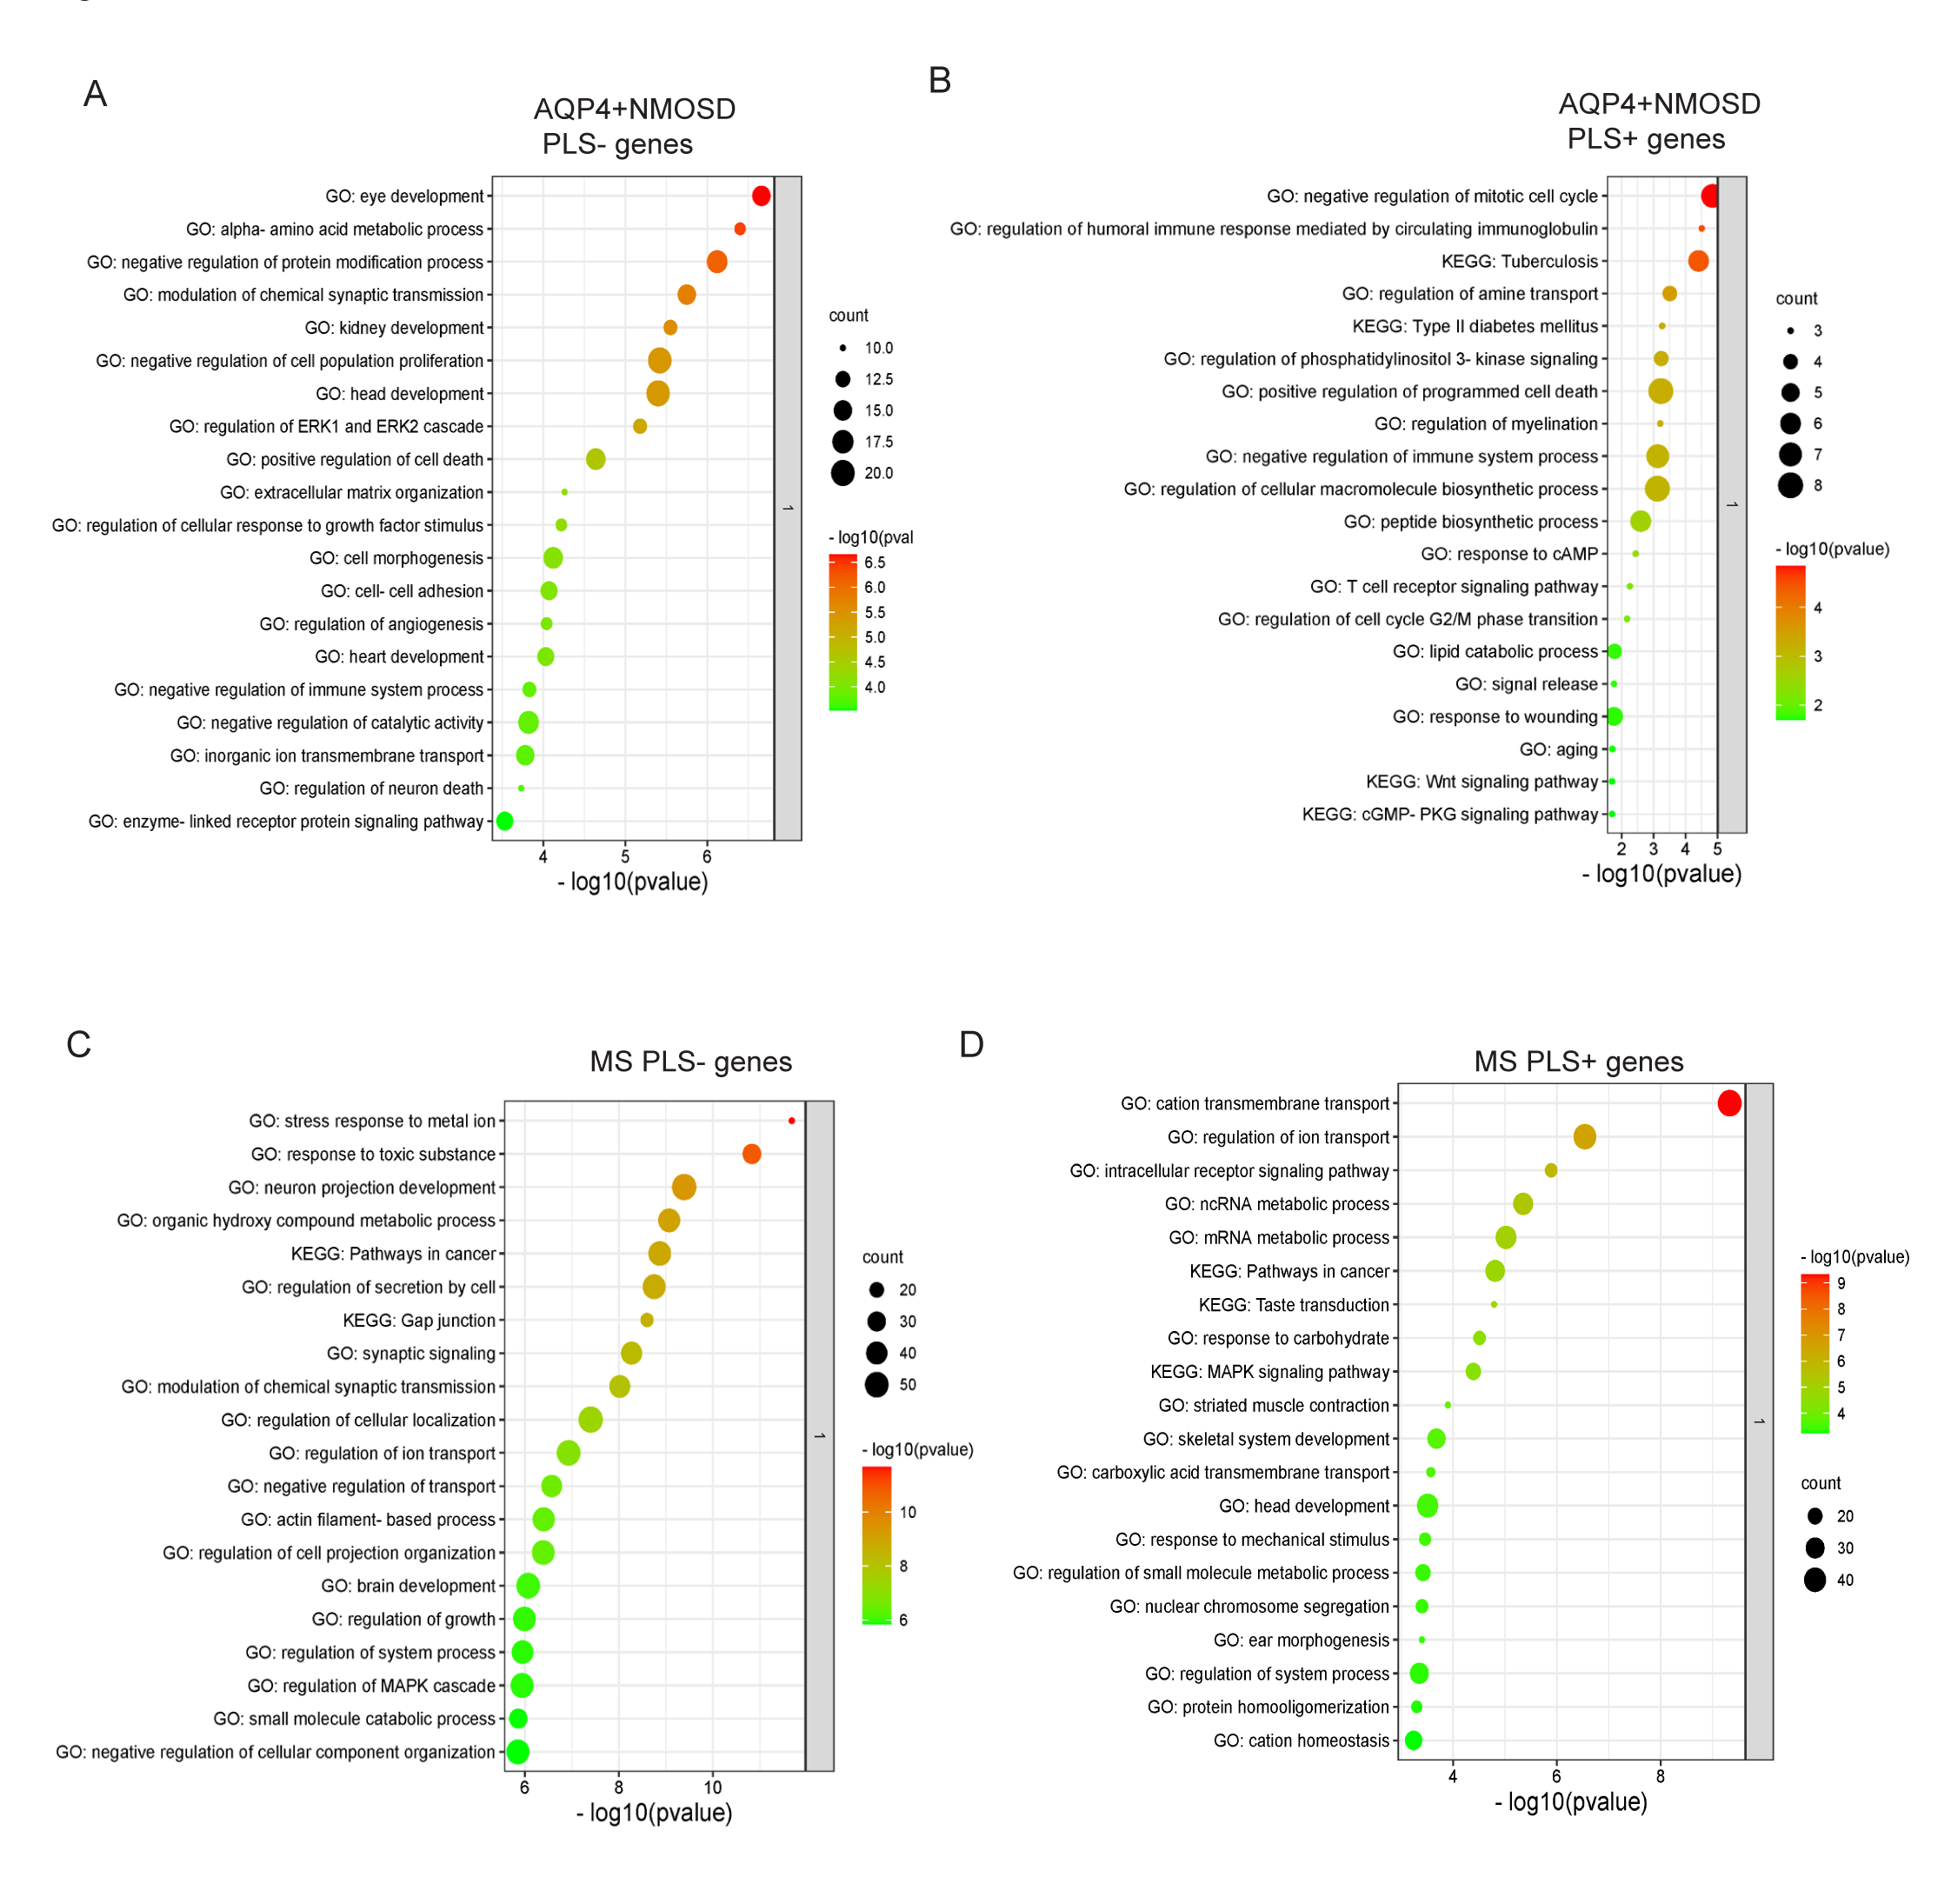
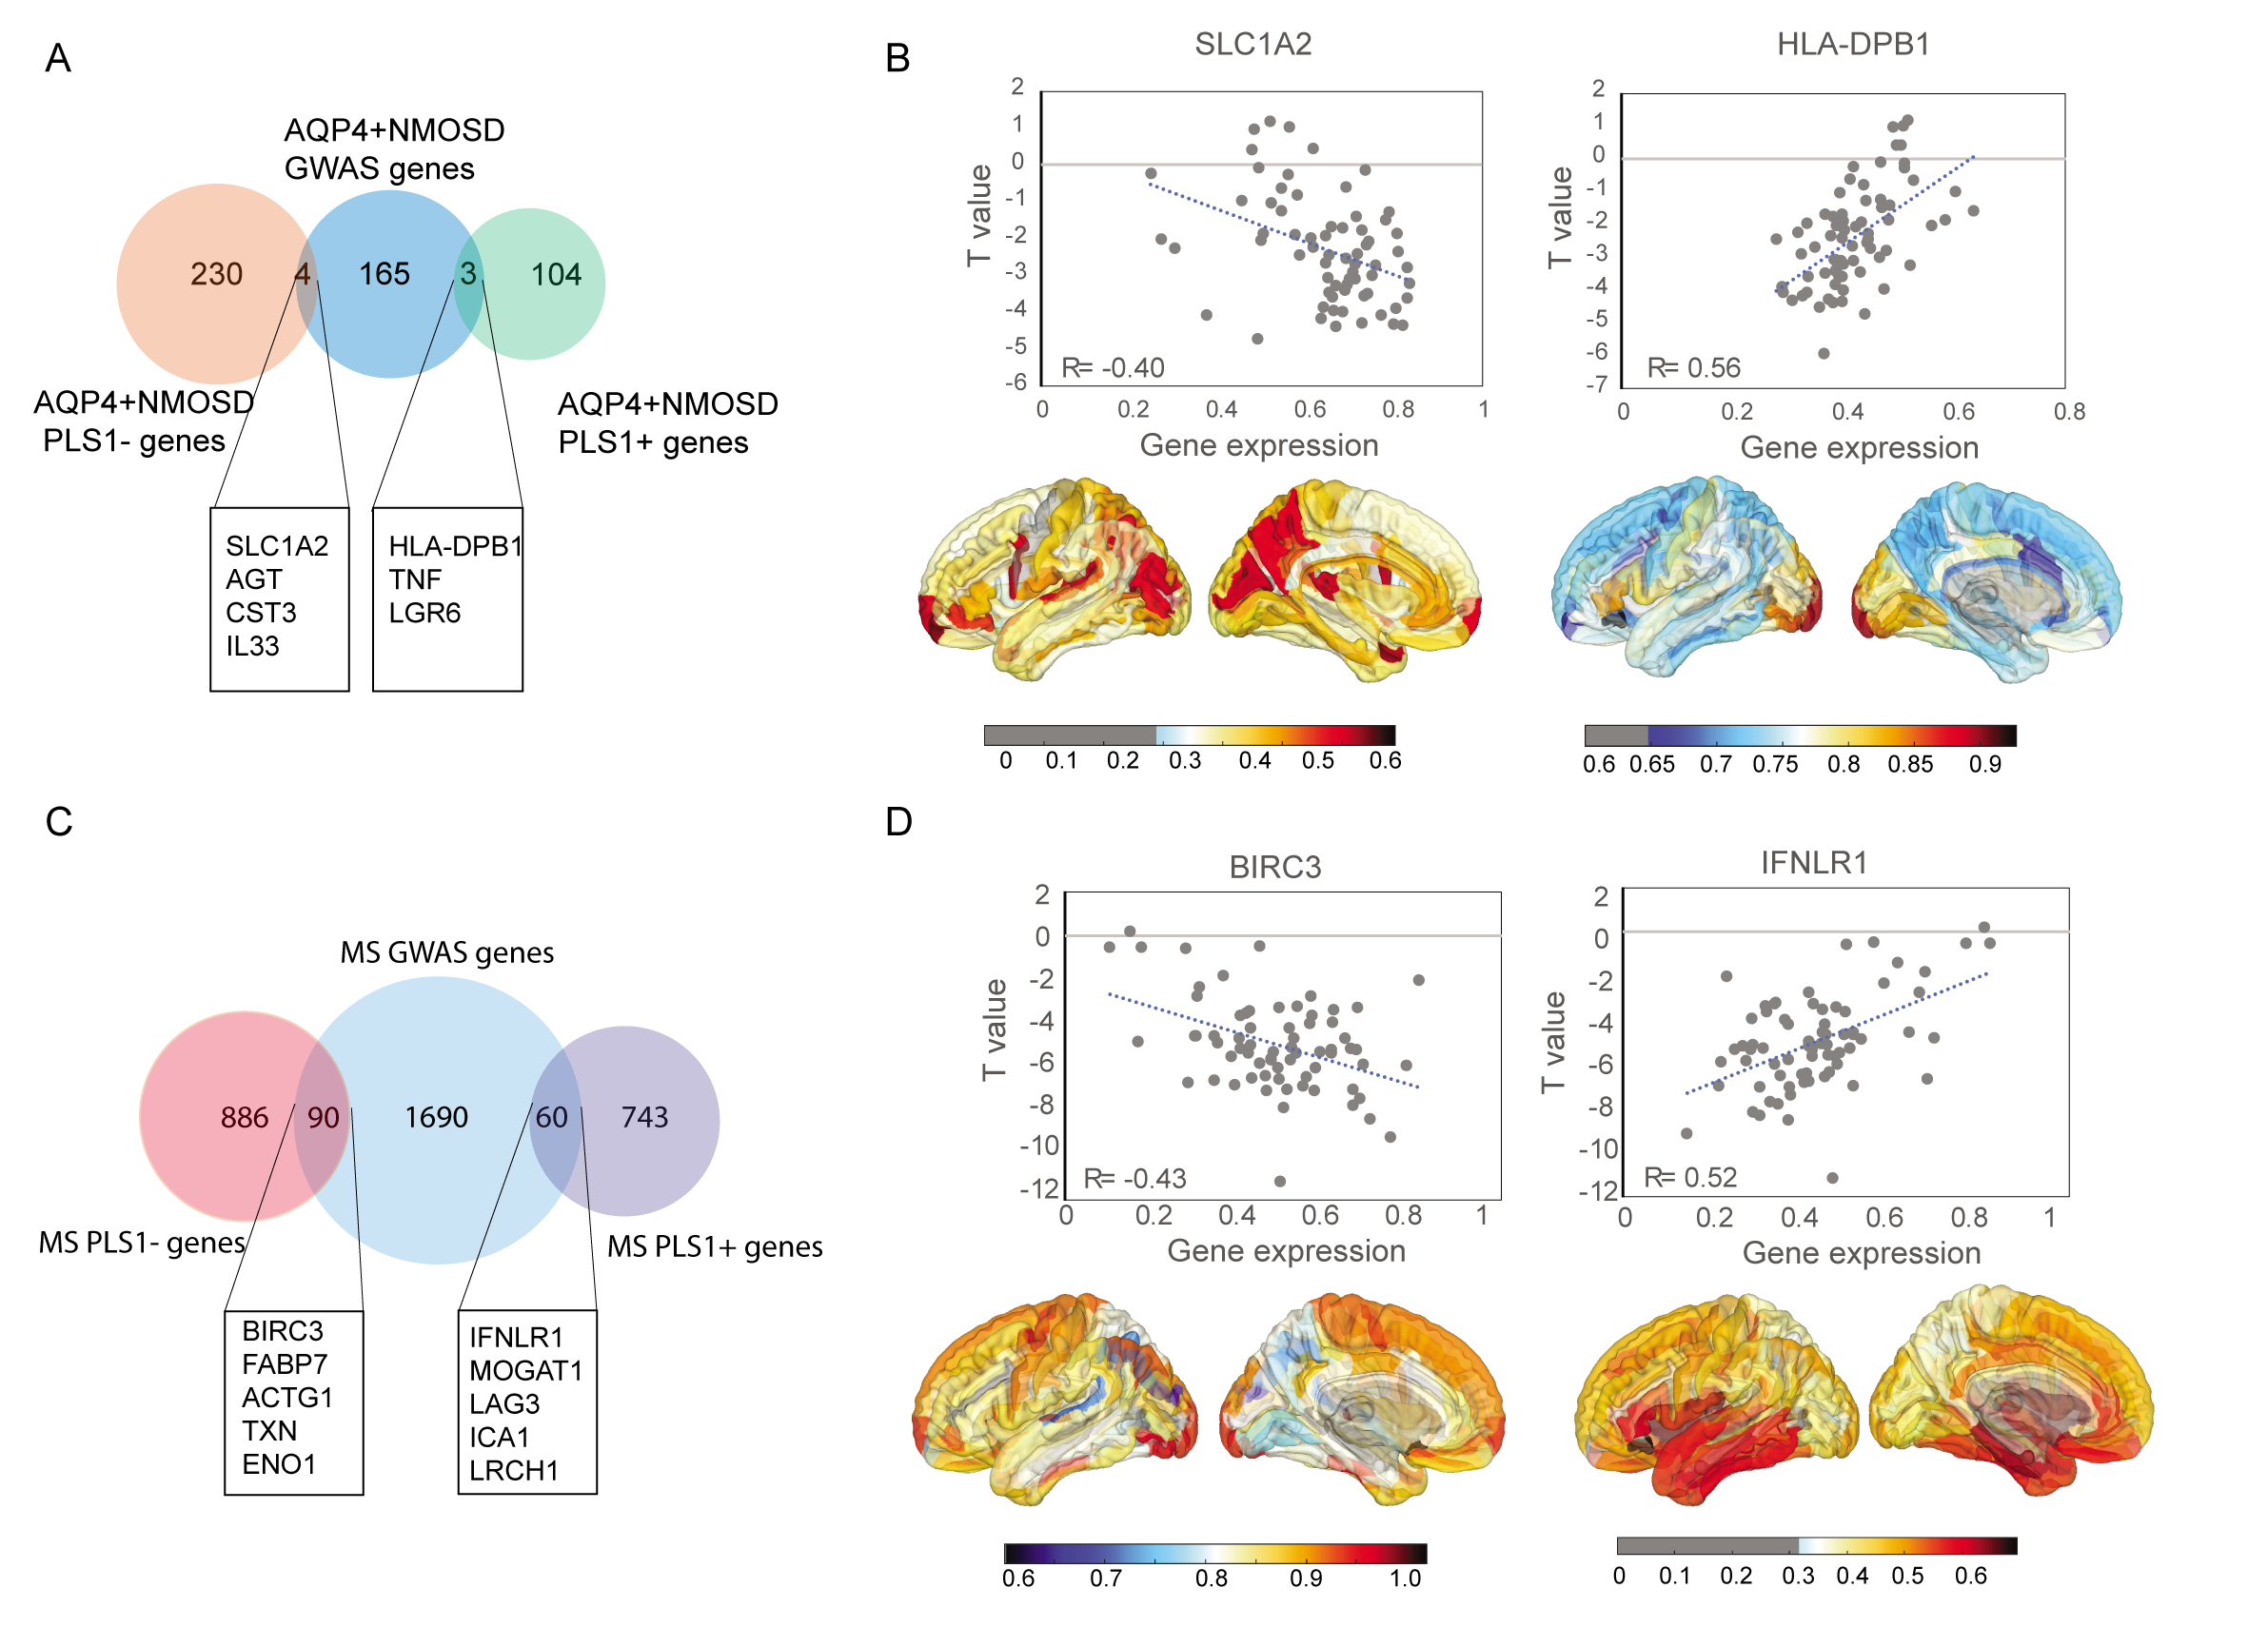
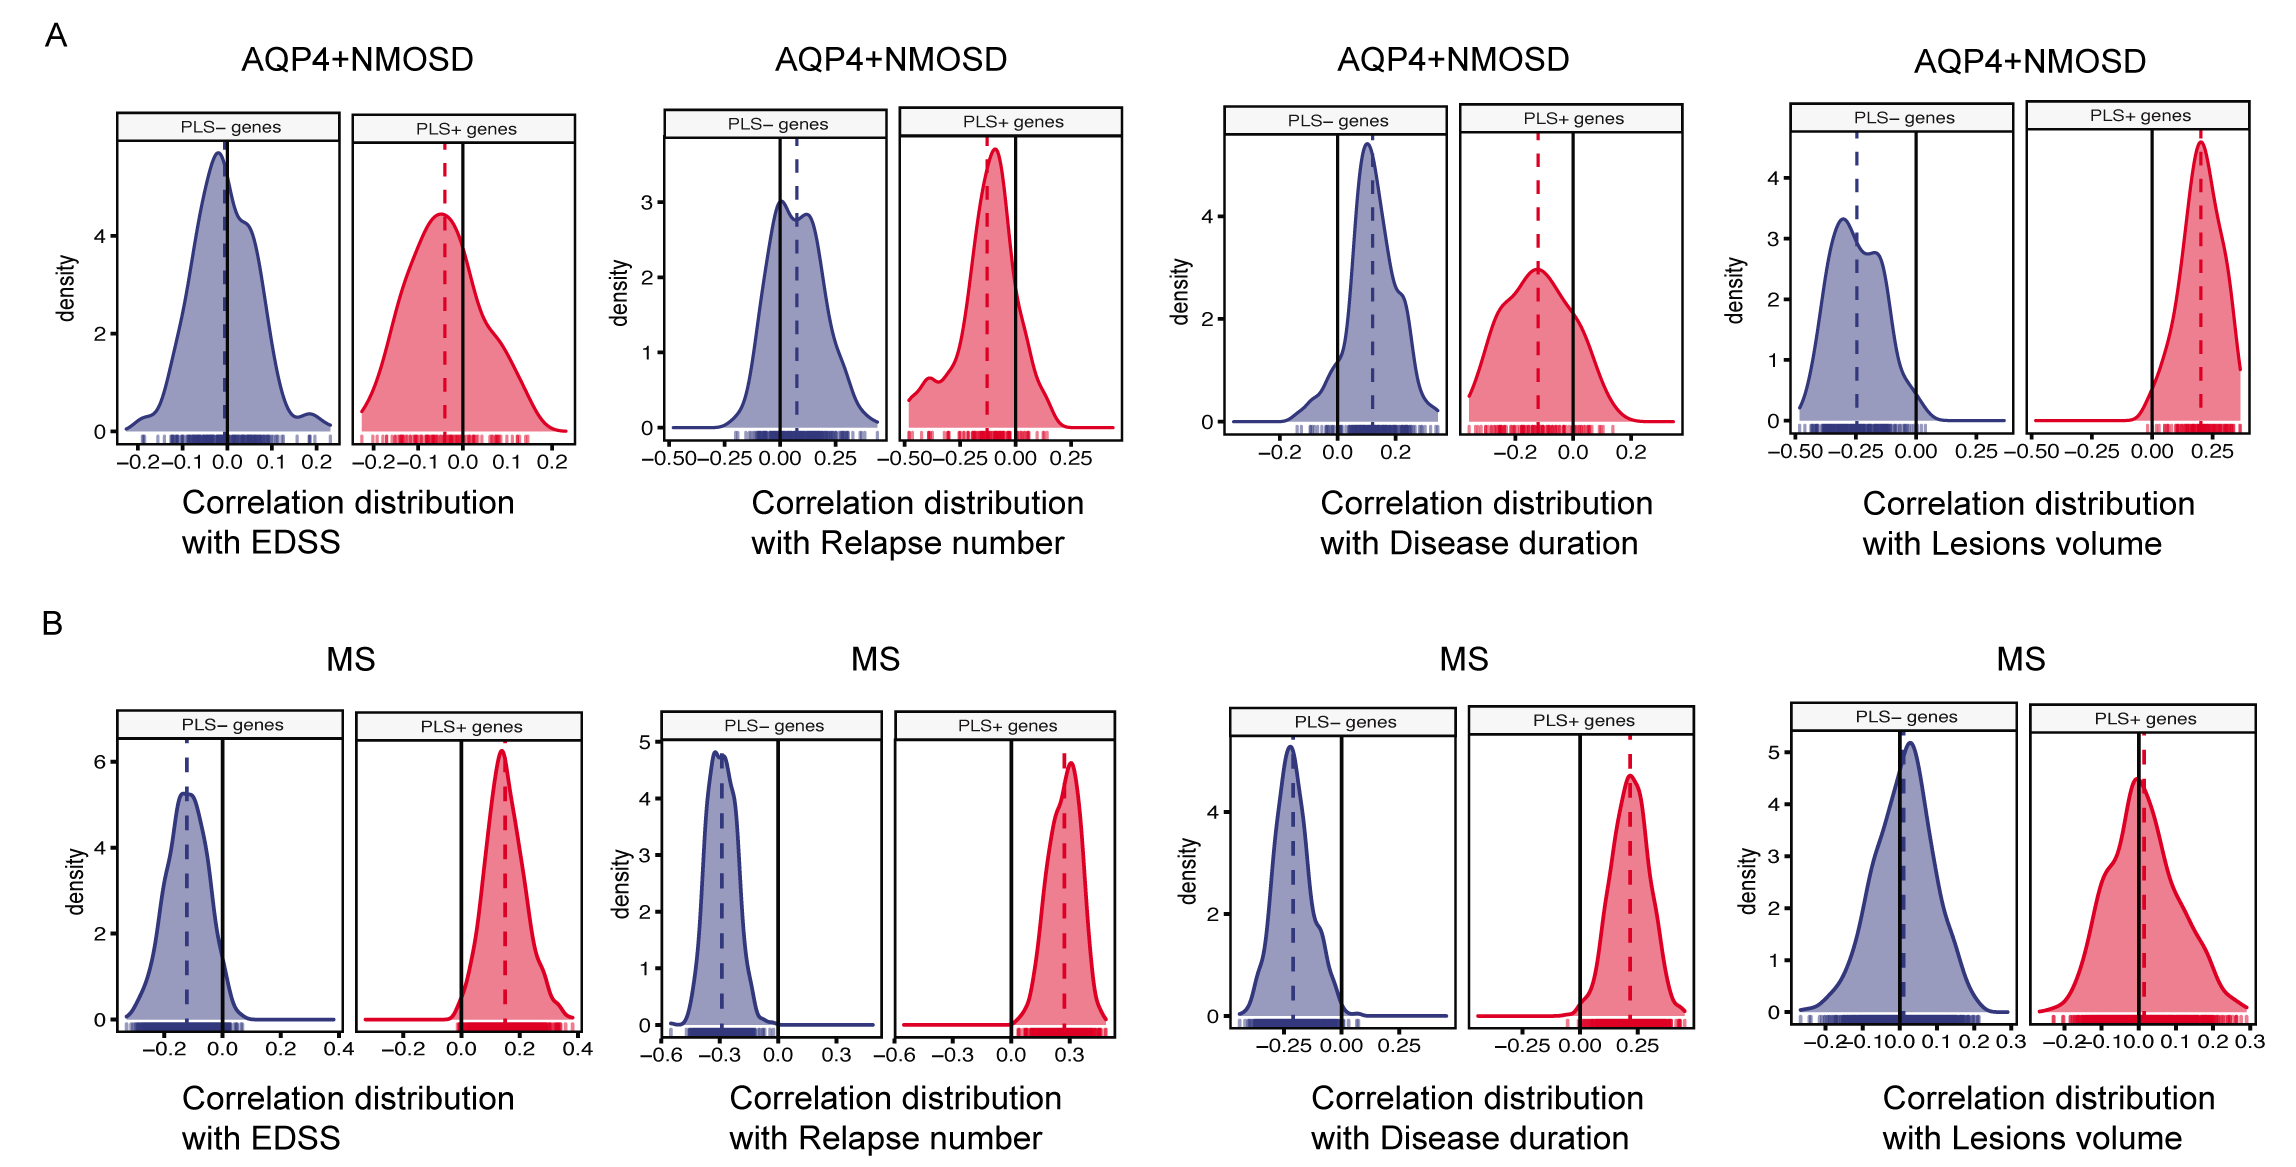
Cortical thinning was observed in the inferior and superior temporal sulcus in both NMOSD and MS patients. A total of 234 AQP4+ NMOSD-associated genes and 976 MS-associated genes were identified to be negatively correlated with cortical thinning (PLS1- genes), of which 85 genes overlapped. NMOSD and MS PLS1- genes were both enriched in synaptic signaling, ion transport, brain development and MAPK signaling, whereas the visual system development pathway was unique to NMOSD. The correlation analysis demonstrated that cortical thinning was directly associated with lesion volume in AQP4+ NMOSD patients but correlated with Expanded Disability Status Scale (EDSS) score, disease duration, and number of relapses in MS patients.Discussion
In this study, we investigated the differential cortical atrophy patterns and underlying transcriptomic signatures between NMOSD and MS. Several methodological issues must be considered. First, we only included the AHBA gene data from six left hemispheres measured postmortem in six participants, which limited the analysis of transcriptome–neuroimaging associations across groups. Second,we lack biological validation of the identified genes. In vitro and in vivo experiments should be performed to validate their functions.Conclusion
AQP4+ NMOSD patients displayed less regional cortical thinning than MS patients. PLS1- genes in both diseases were negatively correlated with cortical thinning and enriched in multiple functional signaling pathways.Acknowledgements
The authors would like to thank all patients and informants for their participation.References
1 Eshaghi A, Marinescu RV, Young AL, Firth NC, Prados F, Jorge Cardoso M et al. Progression of regional grey matter atrophy in multiple sclerosis. Brain 2018; 141: 1665-1677.
2 Liu Y, Xie T, He Y, Duan Y, Huang J, Ren Z et al. Cortical thinning correlates with cognitive change in multiple sclerosis but not in neuromyelitis optica. Eur Radiol 2014; 24: 2334-2343.
3 Kim SH, Kwak K, Hyun JW, Jeong IH, Jo HJ, Joung A et al. Widespread cortical thinning in patients with neuromyelitis optica spectrum disorder. Eur J Neurol 2016; 23: 1165-1173.
4 Matsushita T, Madireddy L, Sprenger T, Khankhanian P, Magon S, Naegelin Y et al. Genetic associations with brain cortical thickness in multiple sclerosis. Genes Brain Behav 2015; 14: 217-227.
5 Wang Y, Chai L, Chu C, Li D, Gao C, Wu X et al. Uncovering the genetic profiles underlying the intrinsic organization of the human cerebellum. Mol Psychiatry 2022.
6 Li J, Seidlitz J, Suckling J, Fan F, Ji GJ, Meng Y et al. Cortical structural differences in major depressive disorder correlate with cell type-specific transcriptional signatures. Nat Commun 2021; 12: 1647.
7 Shang Z, Sun W, Zhang M, Xu L, Jia X, Zhang R et al. Identification of key genes associated with multiple sclerosis based on gene expression data from peripheral blood mononuclear cells. PeerJ 2020; 8: e8357.
8 Sun J, Xie Y, Wang Q, Shen J, Qin W, Zhang N et al. Genes associated with grey matter volume reduction in multiple sclerosis. J Neurol 2022; 269: 2004-2015.
Figures