1046
Distinct virtual histology of gray matter atrophy in neuroinflammatory diseases1Capital Medical Universtiy, Beijing Tiantan Hospital, Beijing, China, 2MR Research Collaboration, Siemens Healthineers Ltd., Beijing, China
Synopsis
Keywords: Neuroinflammation, Neuroinflammation, virtual histology
Motivation: Gray matter (GM) atrophied early in multiple sclerosis (MS), anti-aquaporin-4 antibody-positive [AQP4+] / -negative [AQP4-] neuromyelitis optica spectrum disorder (NMOSD), and myelin oligodendrocyte glycoprotein antibody-associated disease (MOGAD). Their neurobiological underpinnings have not been clarified.
Goal(s): The purpose was to explore their GM atrophy-associated histology using a multicenter cohort.
Approach: 324 MS, 197 AQP4+ NMOSD, 75 AQP4- NMOSD, 47 MOGAD, and 2,169 healthy controls (HCs) were examined by virtual histology method.
Results: The unique virtual histology was glial cells for MS, astrocytes for AQP4+ NMOSD and oligodendrocytes for MOGAD. The neuronal and endothelial cells were shared potential targets.
Impact: It might help to optimize therapy.
Introduction
Neuroimaging has revealed gray matter (GM) atrophy in multiple sclerosis (MS), neuromyelitis optica spectrum disorders (NMOSD; both anti-aquaporin-4 antibody-positive [AQP4+] and -negative [AQP4-] subtypes), and myelin oligodendrocyte glycoprotein antibody-associated disease (MOGAD). Understanding the shared and distinct pathogenic mechanisms of brain atrophy in these disorders will aid their differential diagnoses and guide therapeutic strategies. However, understanding of their pathogenic mechanisms remains limited.Methods
To determine the neurobiological underpinnings of GM atrophy profiles in MS, AQP4+ / AQP4- NMOSD, and MOGAD, a multicenter cohort of 324 patients with MS, 197 patients with AQP4+ NMOSD, 75 patients with AQP4- NMOSD, 47 patients with MOGAD, and 2,169 healthy controls (HCs) were examined. Interregional profiles of group differences (Cohen’s d) in GM atrophy profiles were generated from T1-weighted images. These were compared between patients with MS, AQP4+/AQP4- NMOSD, MOGAD and HCs. Virtual histological analysis was followed to identify a putative histological basis for any differences. To clarify neurobiological changes in regard to specific clinical features, virtual histology of GM atrophy was also investigated based on the clinical features of each disease, stratified by physical disability severity, disease duration, number of relapses, lesion volume, and cognitive function.Results
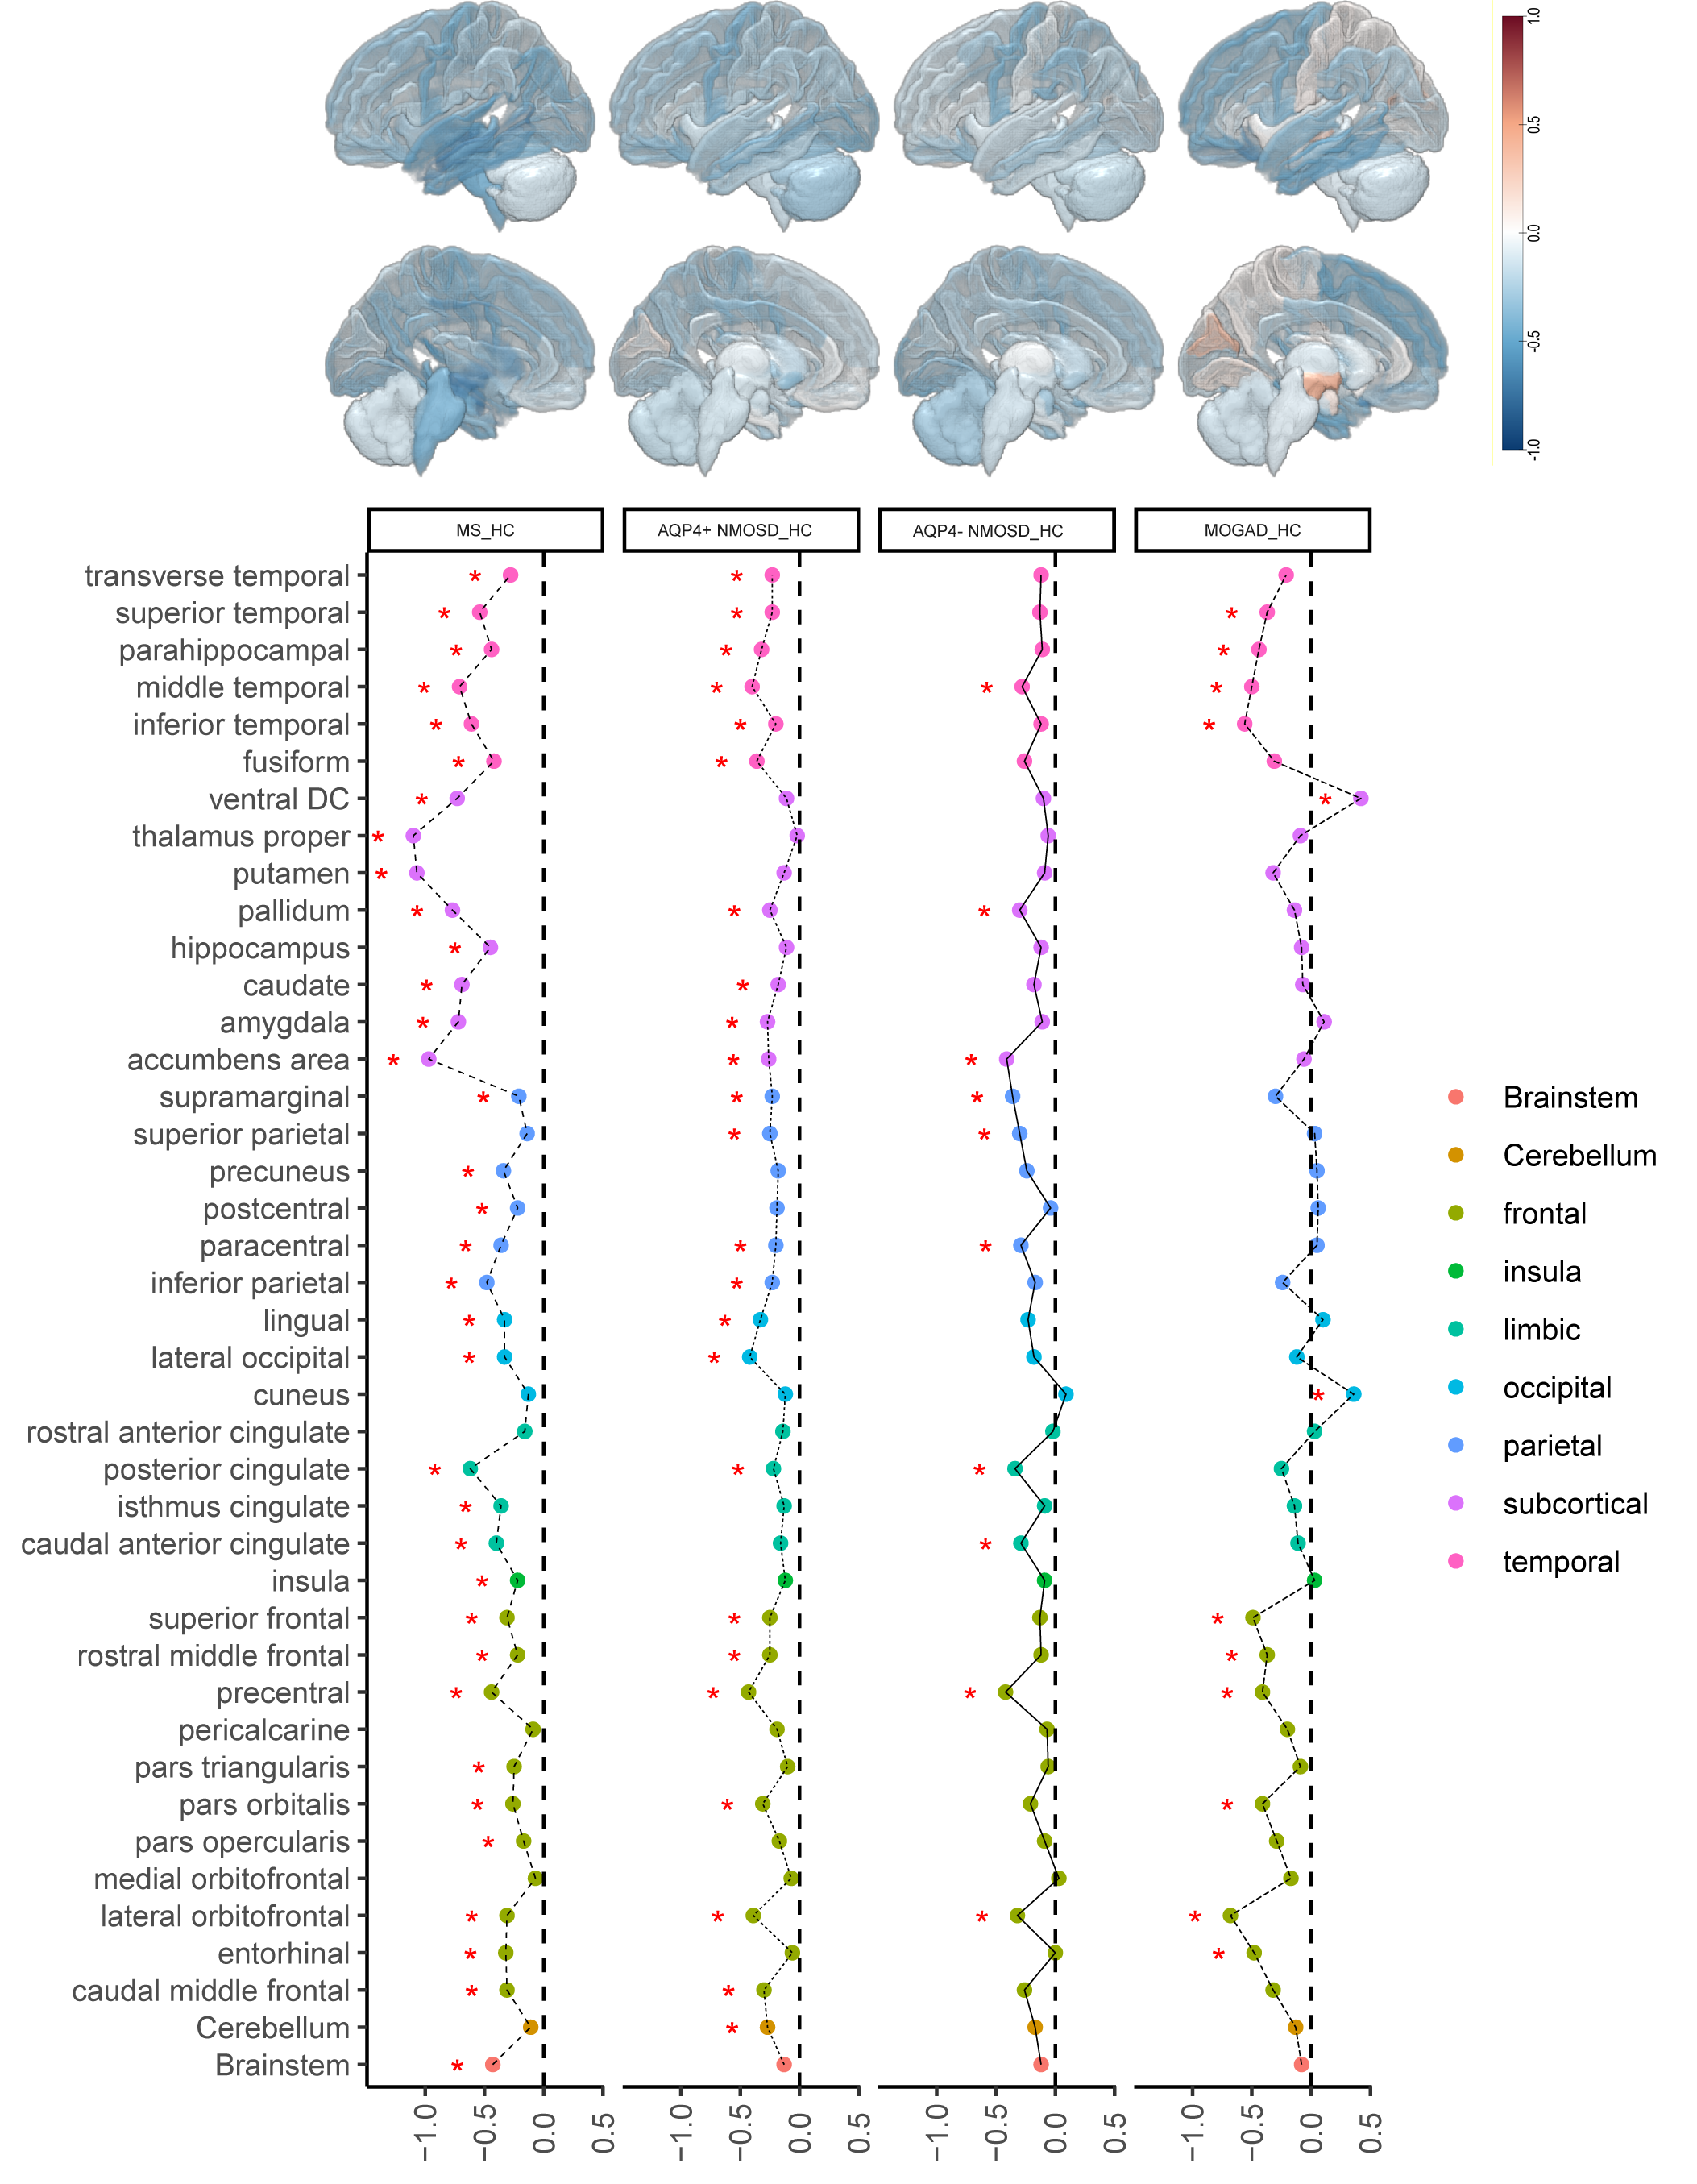
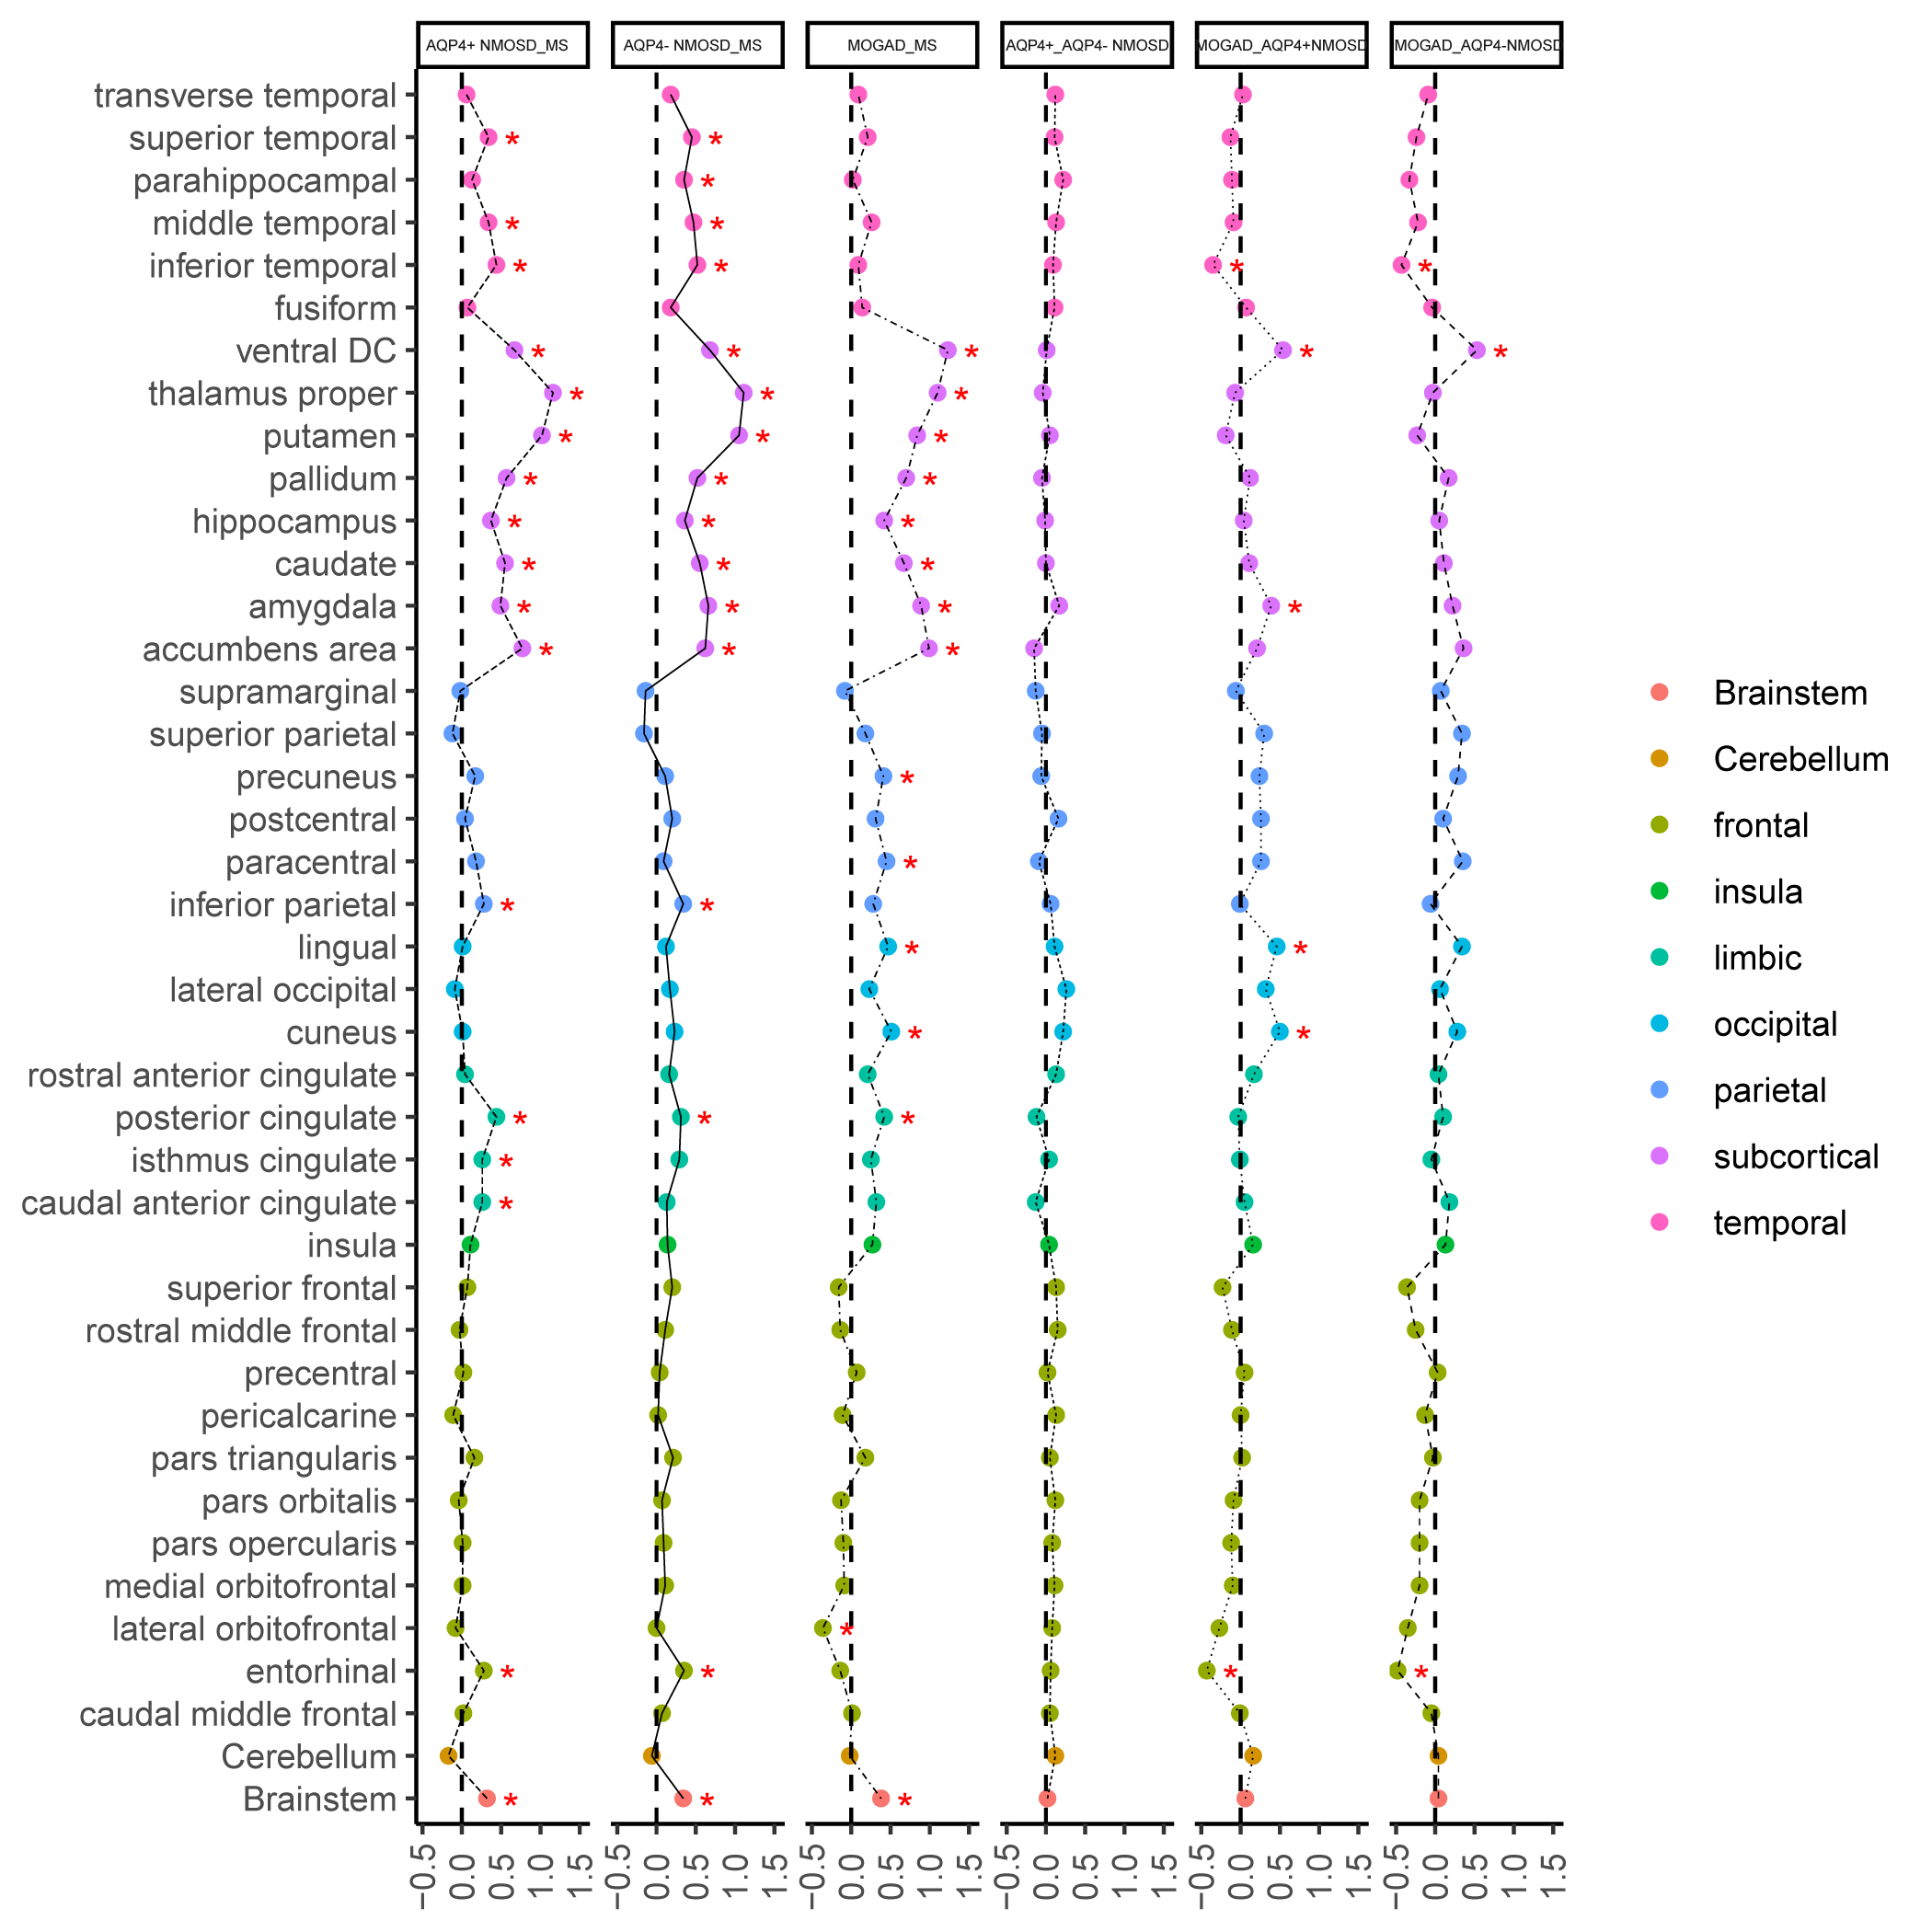
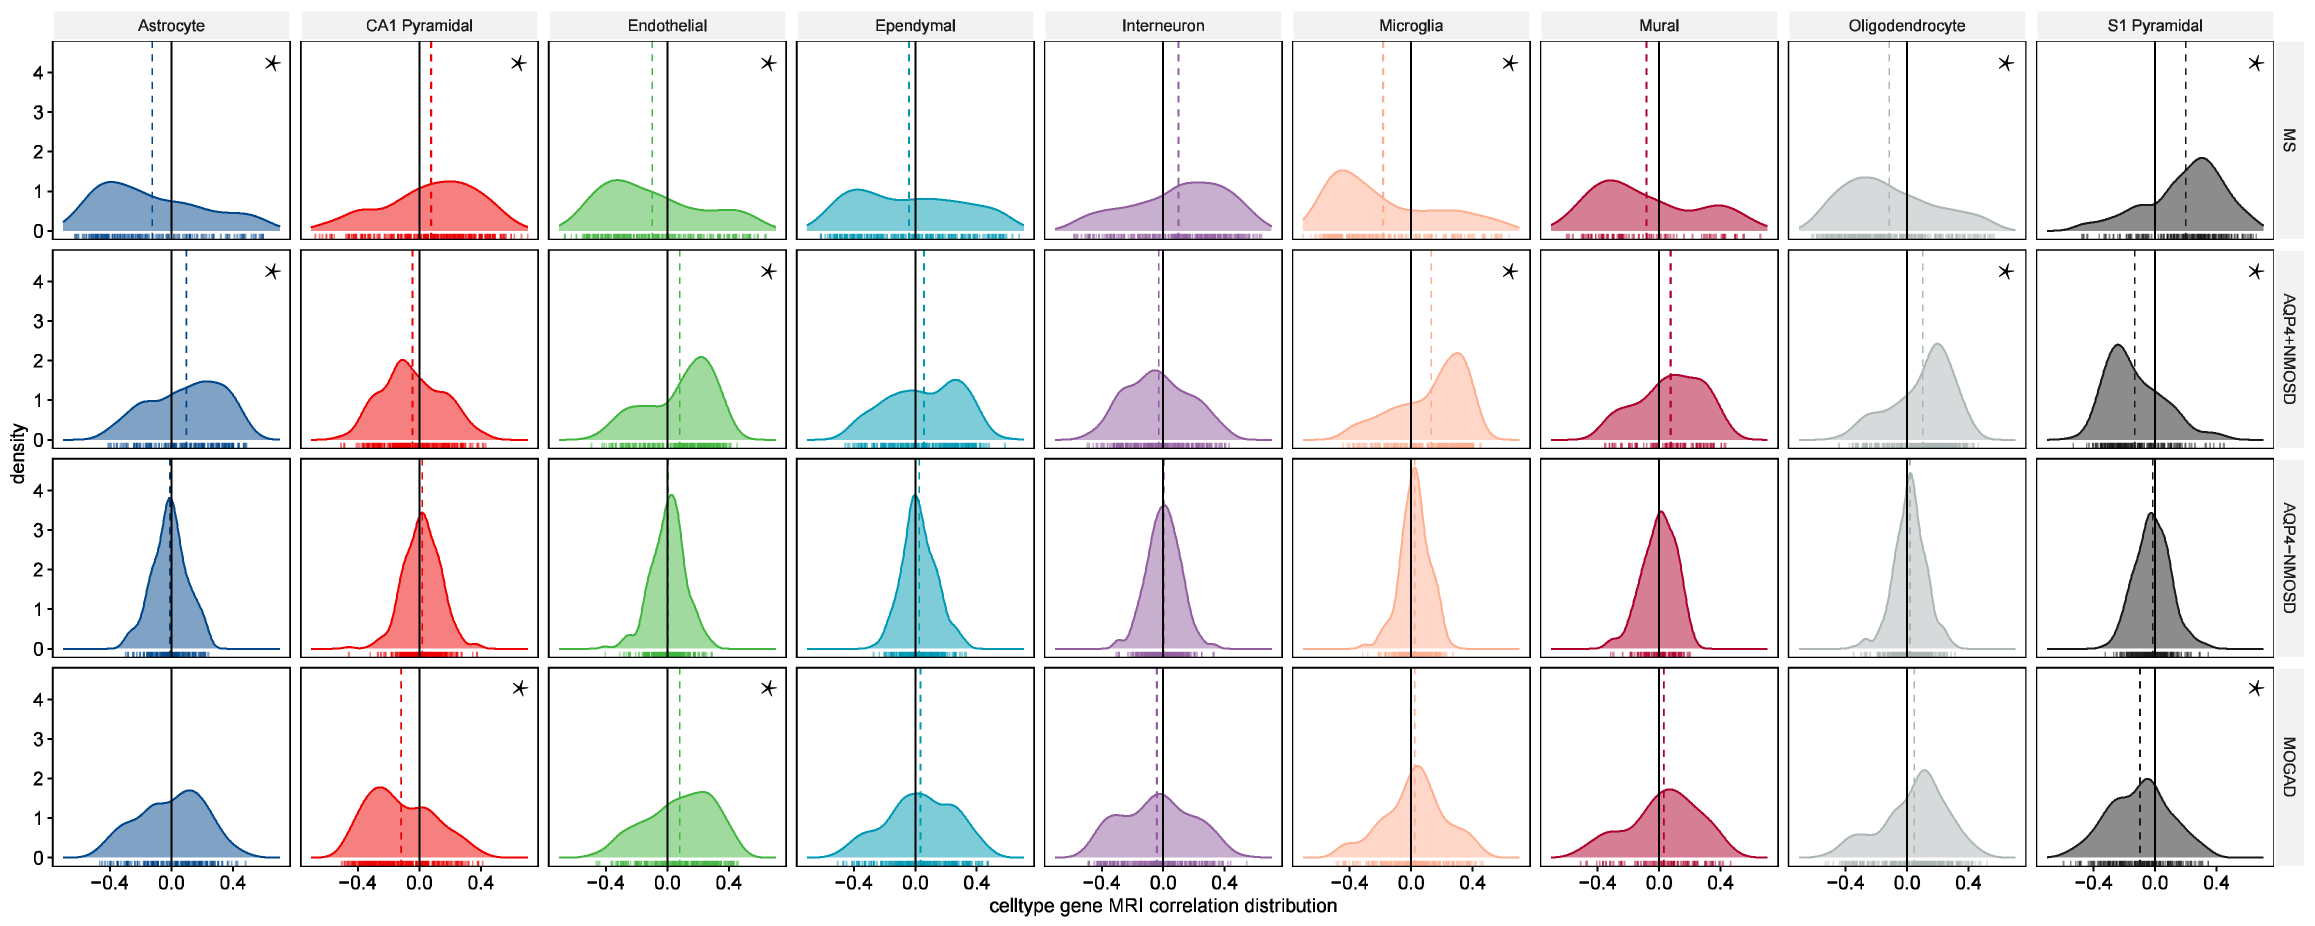
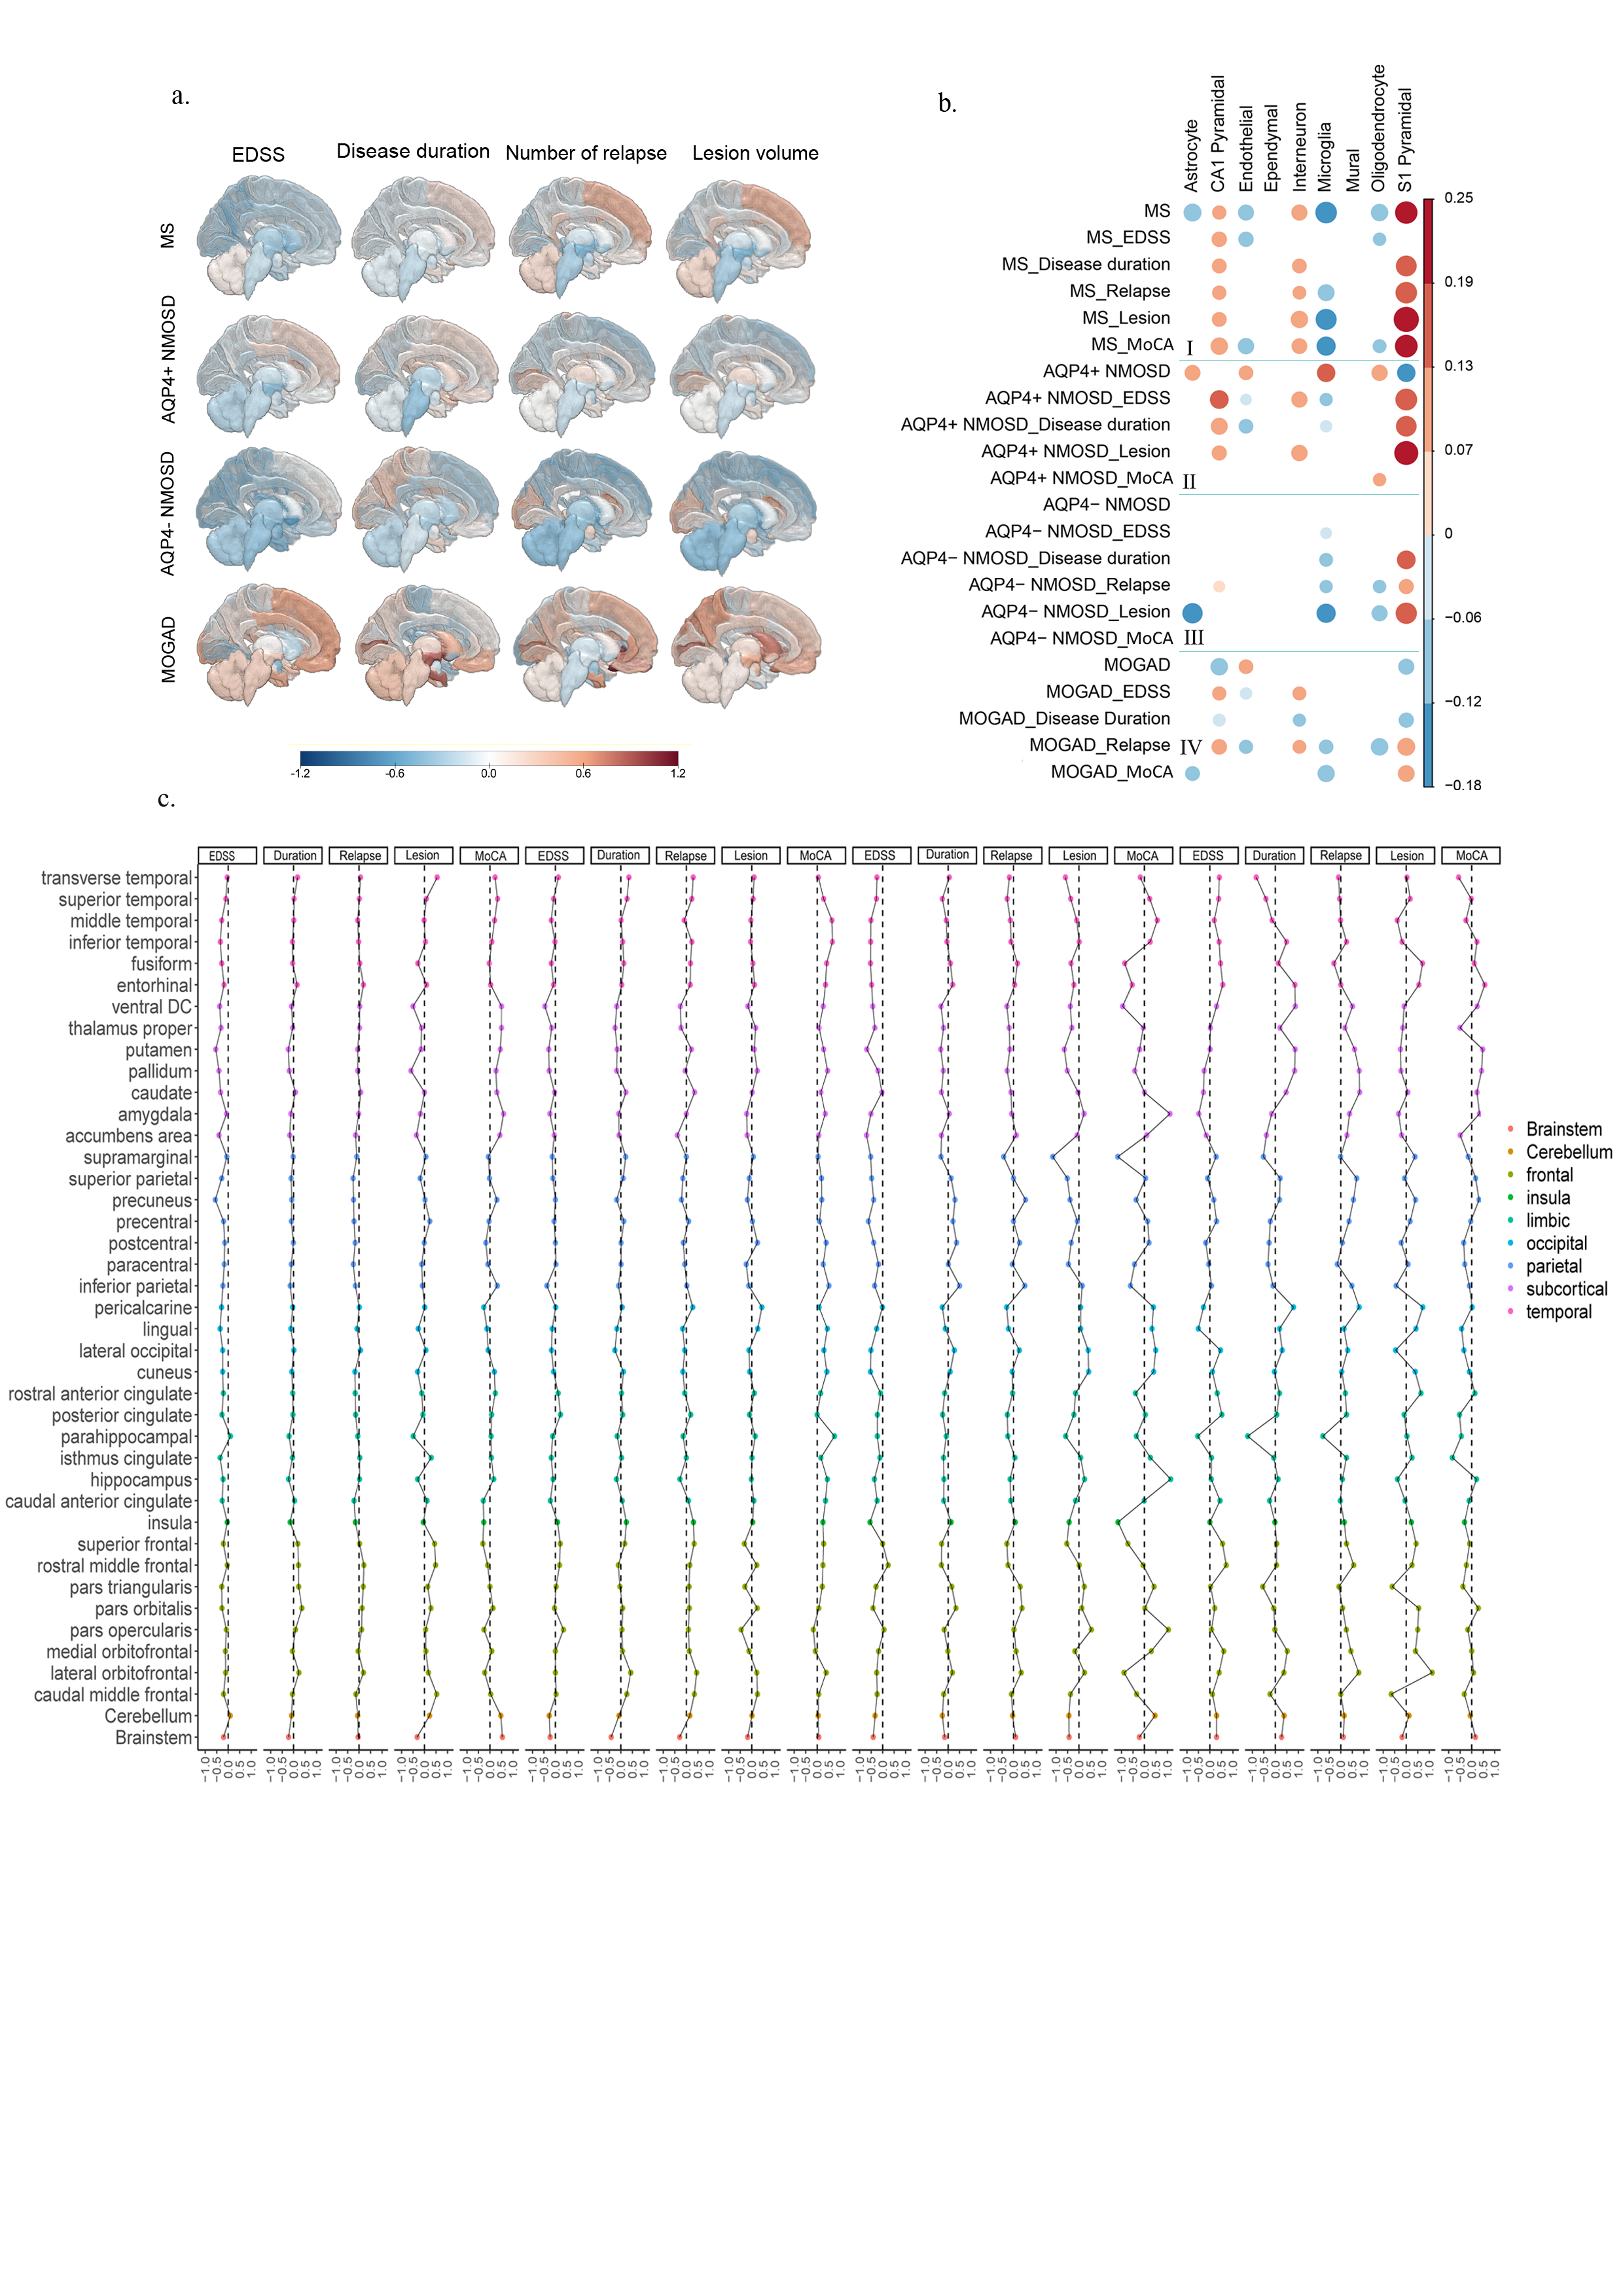
MS showed severe widespread GM atrophy pattern, including subcortical nuclei, frontal cortex, temporal cortex, parietal cortex, occipital cortex, limbic cortex, insula, and brainstem. AQP4+ NMOSD showed obvious widespread GM atrophy pattern, predominately located in subcortical nuclei, frontal, temporal, parietal, occipital and limbic cortex, as well as cerebellum. AQP4- NMOSD showed mild widespread GM atrophy pattern, mainly located in subcortical nuclei, frontal, temporal, parietal, and limbic cortex. MOGAD was observed in the frontal and temporal cortex. Virtual histology of GM atrophy was stable and specific to high expression of genes in microglia, astrocytes, oligodendrocytes, and endothelial cells in MS, high expression of genes in S1 pyramidal cells in AQP4+ NMOSD, and high expression of genes in S1 and CA1 pyramidal cells in MOGAD. No specific CNS cell types were associated with the GM atrophy profile of patients with AQP4- NMOSD. In addition, virtual histology of GM atrophy based on clinical features revealed the neuron and endothelial cells might be the potential shared neurological pathology. MS patients were characterized with subcortical, ventral DC and brainstem compared with AQP4+ / AQP4- NMOSD and MOGAD. AQP4+ / AQP4- NMOSD patients showed occipital cortex atrophy compared with MOGAD. MOGAD patients showed atrophy in the temporal and frontal cortex compared with AQP4+ / AQP4- NMOSD.Discussion
The unique underlying virtual histology patterns were glial cells for MS, astrocytes for AQP4+ NMOSD and oligodendrocytes for MOGAD. The neuronal and endothelial cells were shared potential targets for the neuroinflammatory diseases, which might help to optimize therapeutic approaches.Conclusion
The present study offers additional evidence regarding shared and distinct neuroimaging and pathophysiological characteristics of GM atrophy, which can be exclusively observed by MRI in various neurological disorders. Our findings have implications for targeted clinical medicine in the future and provide potential directions for experimental autoimmune encephalomyelitis experiments.Acknowledgements
This work was supported by the National Science Foundation of China (Nos. 81870958 and 81571631), the Beijing Municipal Natural Science Foundation for Distinguished Young Scholars (No. JQ20035), the Special Fund of the Pediatric Medical Coordinated Development Center of Beijing Hospitals Authority (No. XTYB201831), Beijing Hospital Management Center Young Talents (QML20210505).References
1. Mahad DH, Trapp BD, Lassmann H. Pathological mechanisms in progressive multiple sclerosis. The Lancet Neurology 2015;14:183-193.
2. Kawachi I, Lassmann H. Neurodegeneration in multiple sclerosis and neuromyelitis optica. Journal of Neurology Neurosurgery and Psychiatry 2017;88:137-145.
3. Duan Y, Zhuo Z, Li H, et al. Brain structural alterations in MOG antibody diseases: a comparative study with AQP4 seropositive NMOSD and MS. Journal of Neurology Neurosurgery and Psychiatry 2021;92:709-716.
4. Writing Committee for the Attention-Deficit/Hyperactivity D, Autism Spectrum D, Bipolar D, et al. Virtual Histology of Cortical Thickness and Shared Neurobiology in 6 Psychiatric Disorders. JAMA Psychiatry 2021;78:47-63.
5. Zeisel A, Muñoz-Manchado AB, Codeluppi S, et al. Brain structure: cell types in the mouse cortex and hippocampus revealed by single-cell RNA-seq. Science. 2015;347(6226):1138-1142.
6. Hacohen Y, Wong YY, Lechner C, et al. Disease Course and Treatment Responses in Children With Relapsing Myelin Oligodendrocyte Glycoprotein Antibody-Associated Disease. JAMA Neurology 2018; 75: 478.
7. Buch AM, Vértes PE, Seidlitz J, Kim SH, Grosenick L, Liston C. Molecular and network-level mechanisms explaining individual differences in autism spectrum disorder. Nature Neuroscience. 2023; 26(4): 650-663.
Figures