1045
A correction for modeling of radial, spiral, and PROPELLOR DCE data: time-averaged extended Tofts1Radiology and Nuclear Medicine, Amsterdam University Medical Centers, Amsterdam, Netherlands
Synopsis
Keywords: Contrast Agents, DSC & DCE Perfusion, Perfusion, Pharmacokinetics, Body, Liver, DCE, Diagnosis
Motivation: Accurate quantification of pharmacokinetic parameters in dynamic contrast-enhanced (DCE) MRI requires high temporal resolution, often reached through non-cartesian sampling patterns that oversample the center of k-space (e.g. radial, spiral, PROPELLOR). In pharmacokinetic models, image contrast is assumed to be formed instantly at discrete time-points. However, in acquisitions oversampling the k-space center, the signal per time-frame becomes an average over acquisition time.
Goal(s): To correct for the time-averaged signals.
Approach: We proposed a modification to DCE modeling and tested it in simulations and in-vivo.
Results: Modern sampling patterns predominantly affect the pharmacokinetic parameter estimates for longer sampling times (>8s) per DCE frame.
Impact: We verified that for short acquisitions per frame (<8s) per DCE-frame, conventional Toft's modeling is sufficient. However, for longer sampling times (>8s) per DCE frame, our time-averaged extended Toft's model is needed for accurate estimations of pharmacokinetic parameters.
Dynamic contrast-enhanced (DCE) MRI allows for characterizing tissue perfusion by continuous imaging during the injection of a contrast agent. DCE has several promising applications, including treatment stratification and response monitoring in cancer patients(1-3). Accurate quantitative pharmacokinetic modeling of the DCE signal requires high temporal resolution(4). To achieve this, variable density sampling patterns, such as radial, (pseudo-) spiral, and PROPELLOR are often used.
Conventional pharmacokinetic models, including the Extended Tofts(5) (ET) model, describe the contrast variation as a continuous function in time and fit well to discrete samples over time. This is exactly what happens in conventional Cartesian sampling, where the center of k-space (defining the image contrast) is sampled once each DCE time-frame. However, in many variable density acquisitions, the center of k-space is acquired multiple times, during the DCE time-frame. Consequently, the signal at each time-frame is no longer a discrete sample point but time-averaged.
To assess to what extent this influences DCE modeling, and to correct for it, we introduced a modified ET model tailored to account for time-averaged signals as a result of oversampling the center of k-space. We explored to what extent time-averaged signals influence DCE modeling, validated the performance of our correction through simulations, and demonstrated its feasibility in-vivo.
Methods:
In our proposed modification to DCE modeling, we analytically convolved (*) the pharmacokinetic model describing contrast agent concentration (C(t)) over time (t) with a rectangular function (rect) with a rect-width equivalent to the acquisition time (Δt) per DCE frame (Figure 1A):
$$C'(t)=C(t)*rect(\frac{t}{\Delta t})=\int_{t-\frac{1}{2}\Delta t}^{t+\frac{1}{2}\Delta t}C(\tau)d\tau$$
C(t) can be any pharmacokinetic model, including the ET model, which is typically used in DCE modeling:
$$C(t)=v_pC_p(t)+K^{trans}\int_{0}^{T}C_p(\tau)e^{-(K^{trans}/v_e)(t-\tau)}d\tau$$
It expresses contrast agent concentration through fractional plasma volume (vp), fractional volume of extracellular extravascular space (EES) (ve), and mass flux rate from plasma to EES (Ktrans). Additionally, the mass reflux rate from EES to plasma (ke) can be calculated as a ratio of Ktrans over ve. Here, we used the implementation of the ET model by OG_MO_AUMC_ICR_RMH_NL_UK(6) from OSIPI Git(7).
To evaluate the potential of our proposed approach in a controlled environment, we simulated contrast agent concentration curves with different pharmacokinetic parameters (Figure 1B). Subsequently, both ET models were tested in four healthy volunteers who underwent a DCE-MRI of the liver (Figure 1B).
For the quantification of pharmacokinetic parameters, we utilized a non-linear least-squares fit. To compare both models, we calculated the error distribution for predictions of simulated parameters vp and Ktrans. Assuming the effect of averaging signal gets larger with longer time-frames, in vivo, we calculated the mean absolute difference of vp and Ktrans between the 8 and 12-second-per-frame acquisitions in the liver and kidneys.
Results:
Error distribution in simulations showed that the time-adjusted model yielded more precise predictions than the conventional model at acquisition times of 8 seconds-per-frame or higher (Figure 2). Additionally, the prediction of Ktrans and vp exhibited higher precision at lower values and reduced accuracy at higher values.
Results in-vivo were comparable with simulations: the most pronounced difference between predictions produced by the two models was visible at acquisition times of 8 seconds-per-frame and higher (Figures 3 and 4). The discrepancies in predictions were notably greater in the kidneys than in the liver, which could be associated with higher vp and Ktrans values in the kidneys, which, as per the simulations, resulted in less precise outcomes with the conventional model. Furthermore, the mean absolute difference between predictions obtained at different acquisition times of 8 and 12 seconds-per-frame was overall lower in the modified ET model, highlighting its more robust performance in comparison to the conventional model (Table 1).
Discussion:
This study introduces a modification of the ET model, accounting for time-averaged signals due to k-space center oversampling. Our findings demonstrated enhanced accuracy and precision at acquisition times of 8 seconds-per-frame and higher in simulations and in-vivo. Moreover, organs with high pharmacokinetic parameter values, such as kidneys, were more sensitive to the choice of the model. This sensitivity in higher errors linked to the parameter vp is reasonable, as estimating the peak of the contrast agent curve is challenging, especially at longer acquisition times.
The main limitation of this study is that the time-averaging effects were modeled with the convolution in the contrast agent domain, while it is usually observed in the signal domain. As the relation between these domains is not linear, additional investigation of the presented outcomes is needed in the future.
Acknowledgements
We would like to extend our sincere appreciation to Matthew R Orton for his invaluable input and insights that significantly contributed to this work.
This work was funded by the KWF Dutch Cancer Society (KWF-UVA 2021.13785, OG-C) and the Cancer Center Amsterdam (CCA 2020-7-01, OG-C and NK).
The preview image was adapted from Ichikawa, Shintaro, et al. "Utility of stack-of-stars acquisition for hepatobiliary phase imaging without breath-holding." Magnetic Resonance in Medical Sciences 19.2 (2020): 99-107.
References
1. Counago F, del Cerro E, Diaz-Gavela AA, Marcos FJ, Recio M, Sanz-Rosa D, et al. Tumor staging using 3.0 T multiparametric MRI in prostate cancer: impact on treatment decisions for radical radiotherapy. Springerplus. 2015;4.2. Jahani N, Cohen E, Hsieh MK, Weinstein SP, Pantalone L, Hylton N, et al. Prediction of Treatment Response to Neoadjuvant Chemotherapy for Breast Cancer via Early Changes in Tumor Heterogeneity Captured by DCE-MRI Registration. Sci Rep-Uk. 2019;9.
3. Wang CH, Yin FF, Horton J, Chang Z. Review of treatment assessment using DCE-MRI in breast cancer radiation therapy. World J Methodol. 2014;4(2):46-58.
4. Henderson E, Rutt BK, Lee TY. Temporal sampling requirements for the tracer kinetics modeling of breast disease. Magn Reson Imaging. 1998;16(9):1057-73.
5. Tofts PS. Modeling tracer kinetics in dynamic Gd-DTPA MR imaging. Jmri-J Magn Reson Im. 1997;7(1):91-101.
6. Orton MR, d'Arcy JA, Walker-Samuel S, Hawkes DJ, Atkinson D, Collins DJ, Leach MO. Computationally efficient vascular input function models for quantitative kinetic modelling using DCE-MRI. Phys Med Biol. 2008;53(5):1225-39.
7. van Houdt PJ, Ragunathan S, Berks M, Ahmed Z, Kershaw LE, Gurney-Champion OJ, et al. Contrast-agent-based perfusion MRI code repository and testing framework: ISMRM Open Science Initiative for Perfusion Imaging (OSIPI). Magnetic Resonance in Medicine. 2023.
Figures
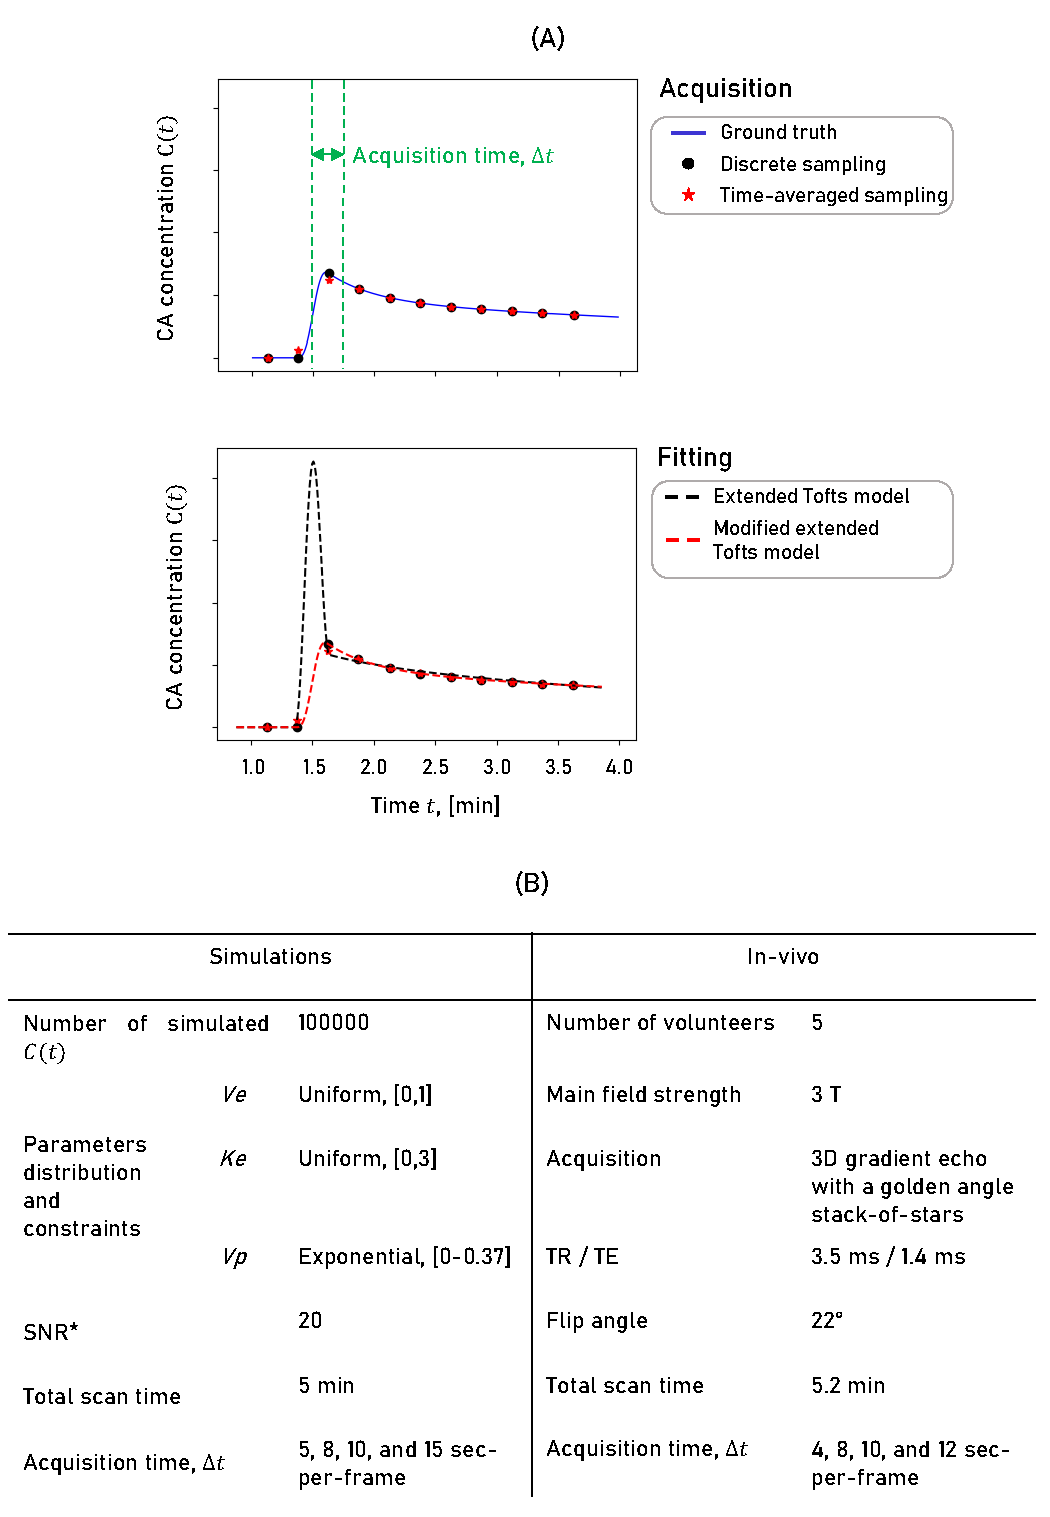
Figure 1: (A) An example of contrast agent curve sampling with discrete acquisition and time-averaged acquisition that oversamples the center of k-space within one DCE time-frame and resulting pharmacokinetic parameter fitting using an extended Tofts model with and without correction. (B) Settings used in simulations and in-vivo acquisition and reconstruction.
*Gaussian noise was added to the C(t) with a signal-to-noise ratio (SNR), defined as a ratio of the time-averaged C(t) over the standard deviation of the noise.
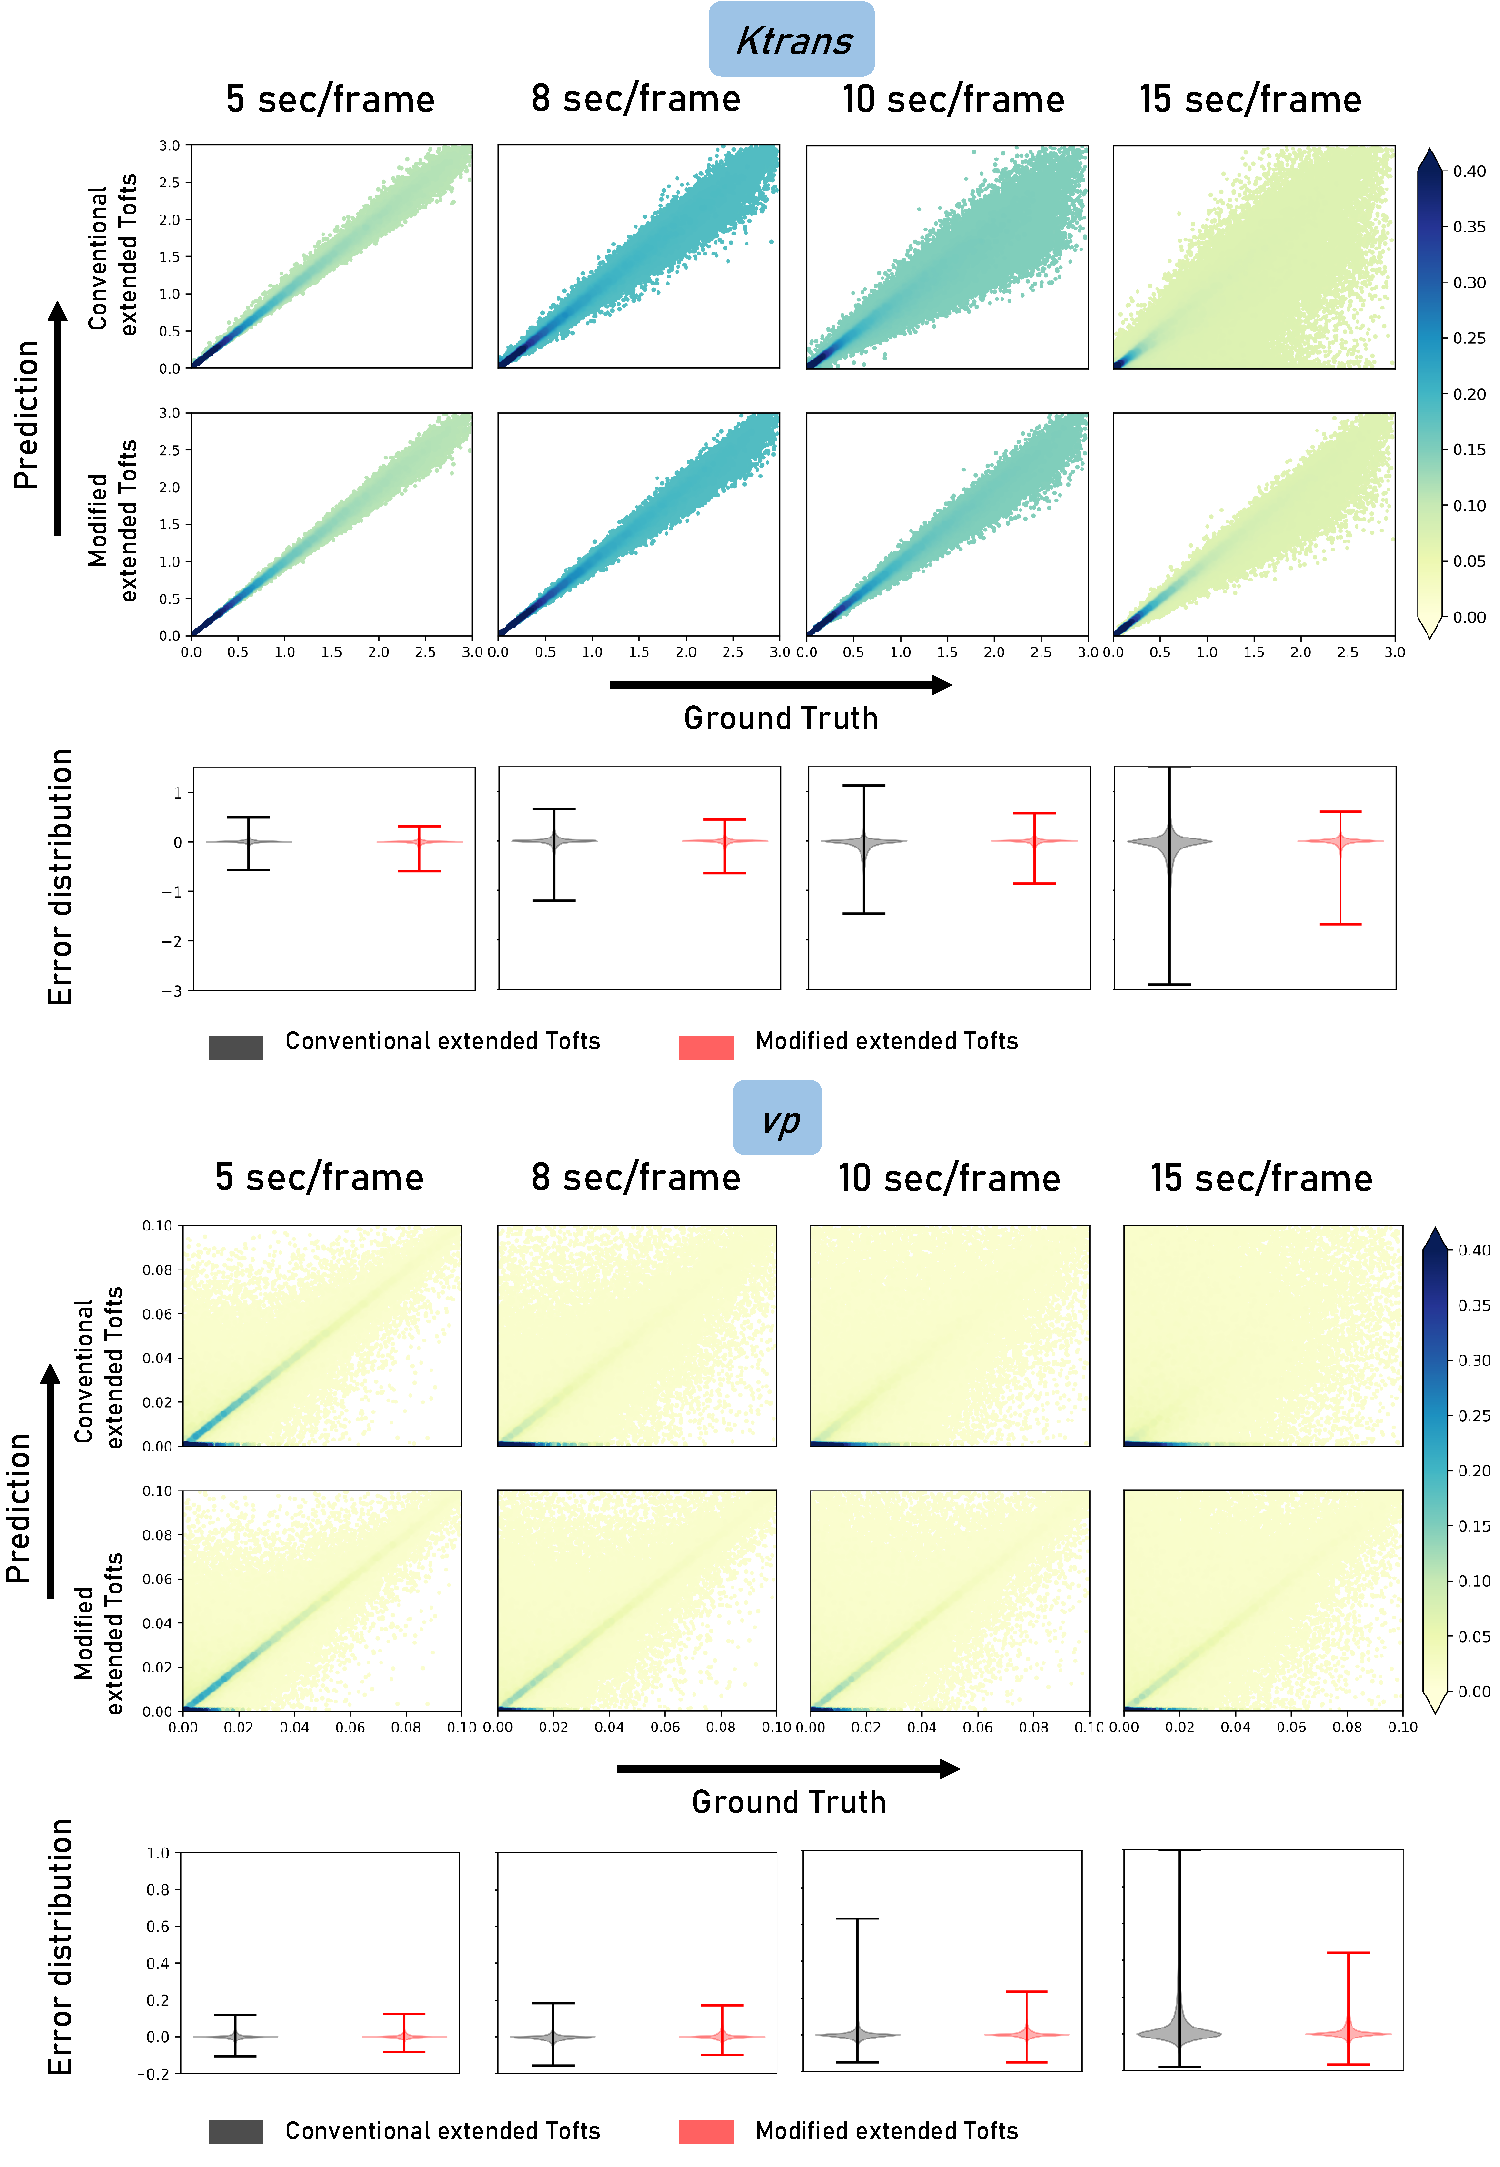
Figure 2: Performance of modified and conventional extended Tofts model on the parameters Ktrans and vp. Rows 1,2,4 and 5 show a normalized histogram of predictions, while rows 3 and 6 demonstrate an error distribution.
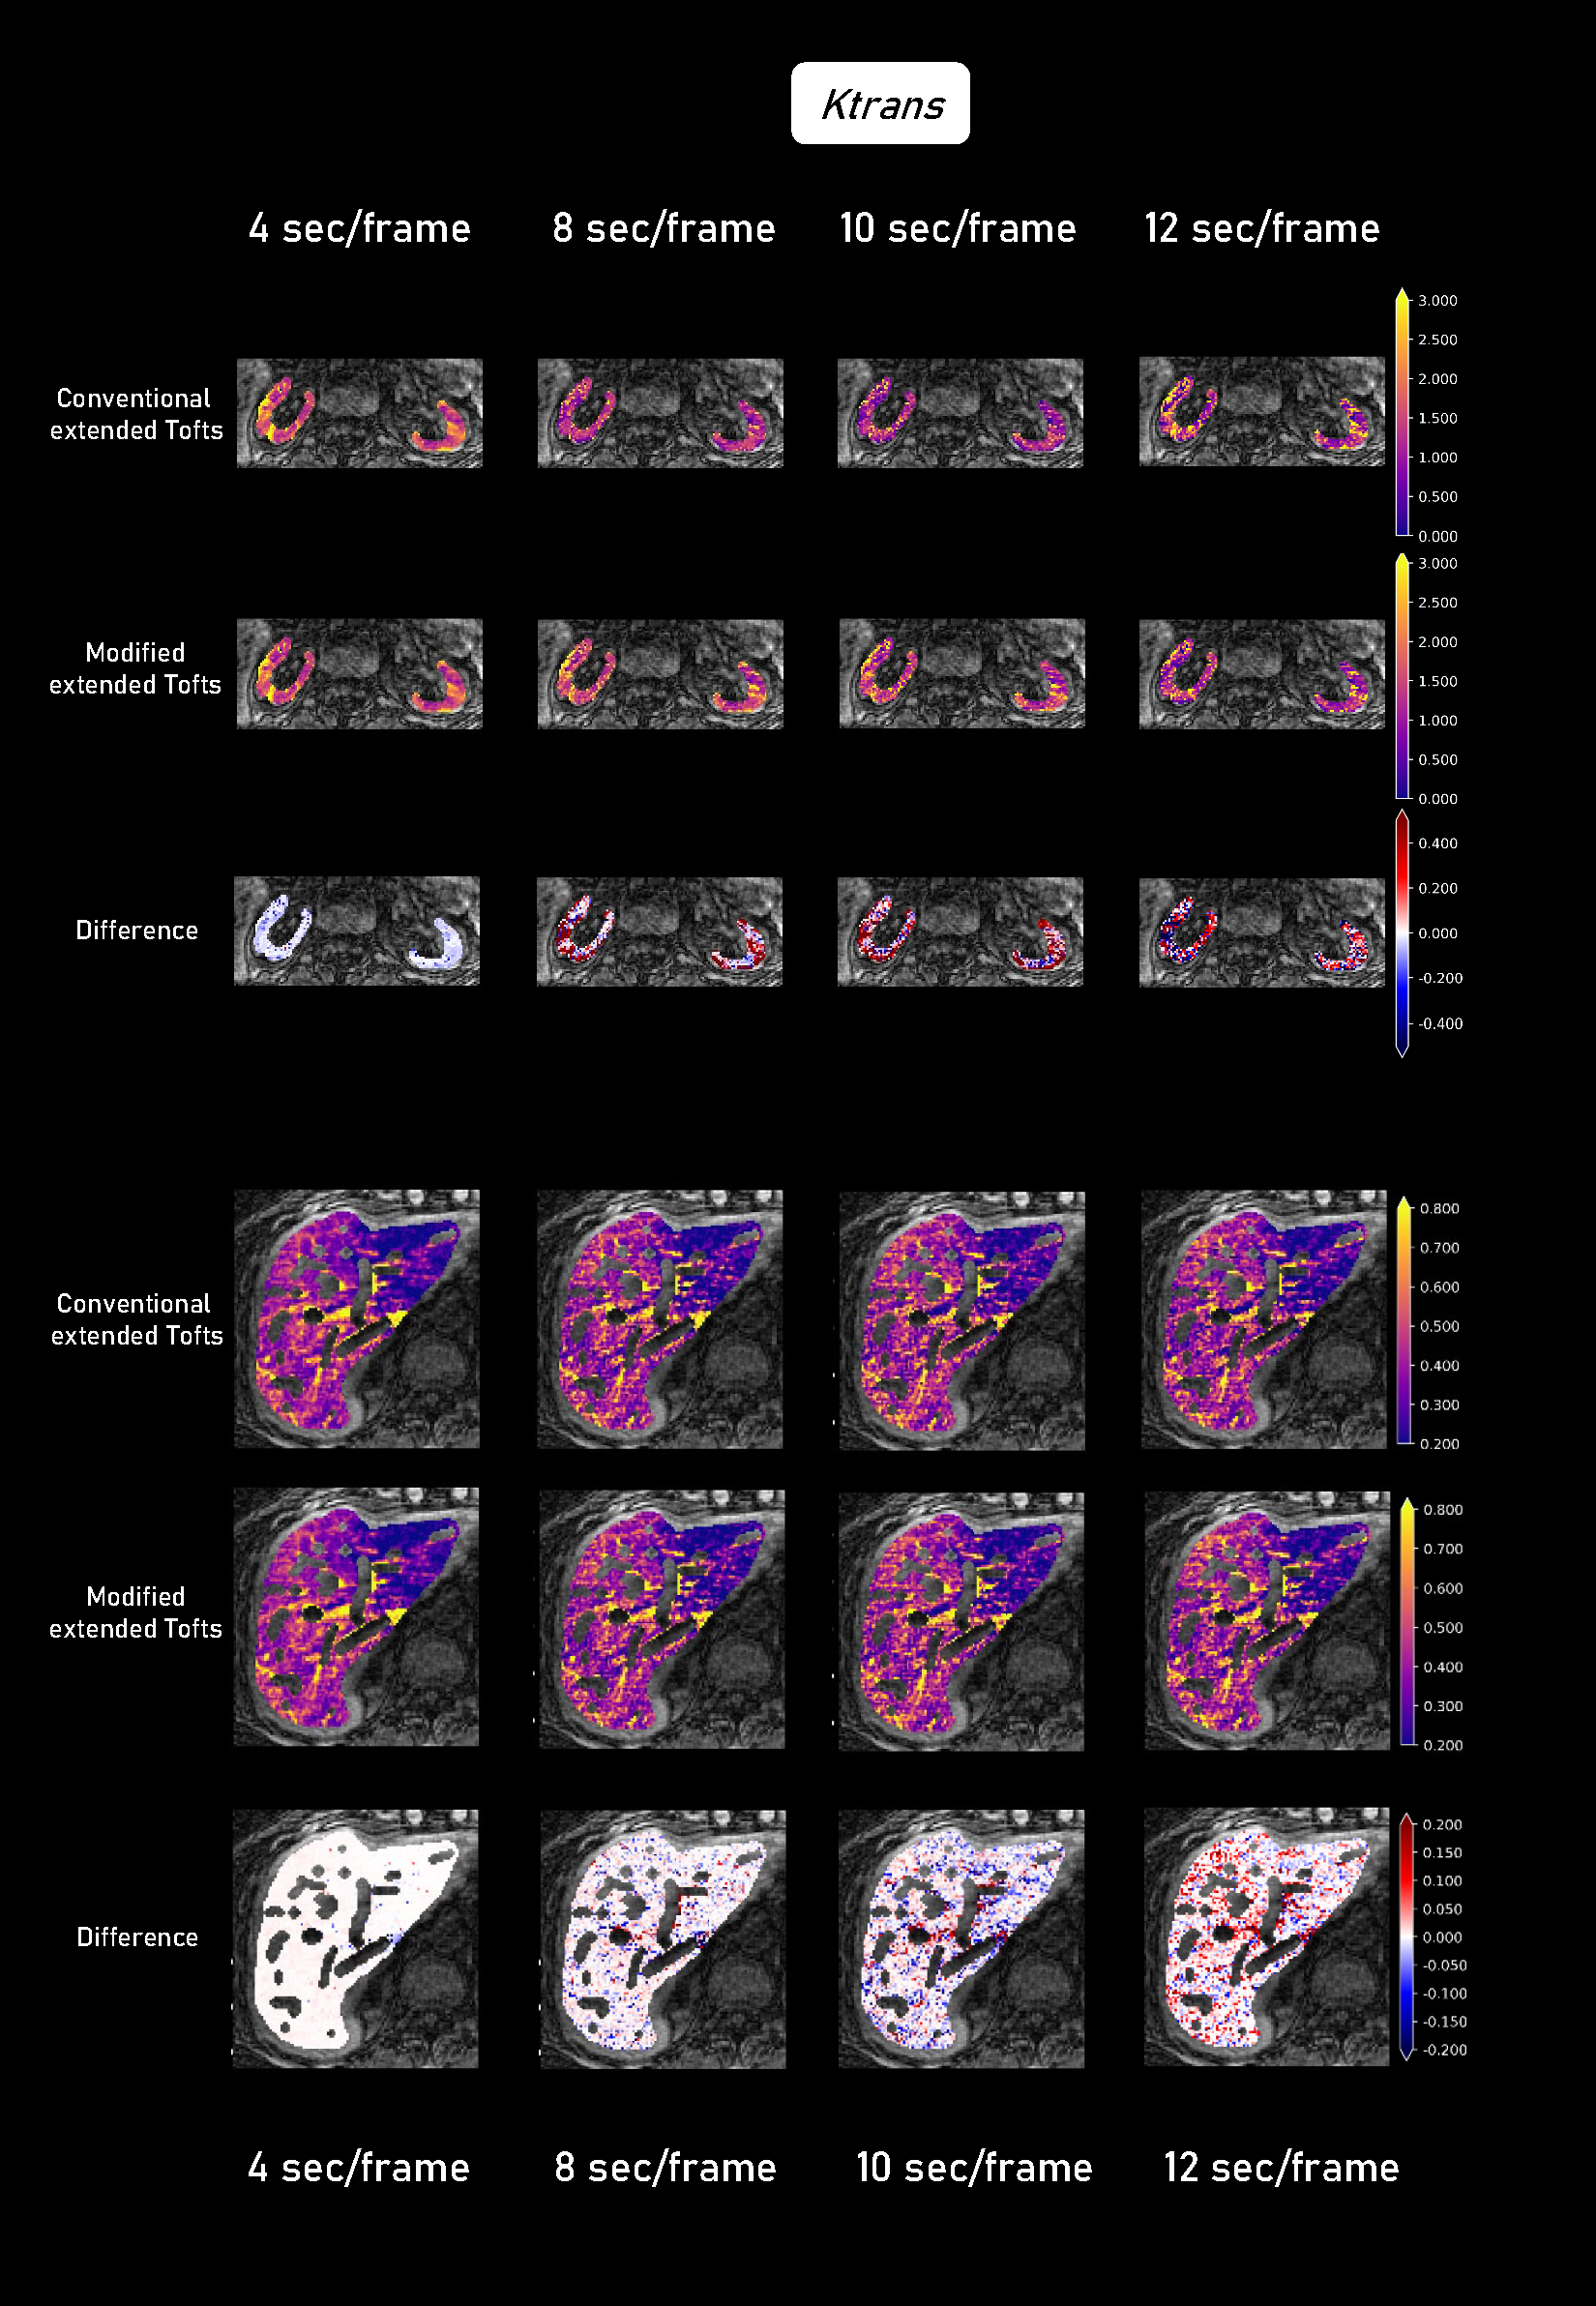
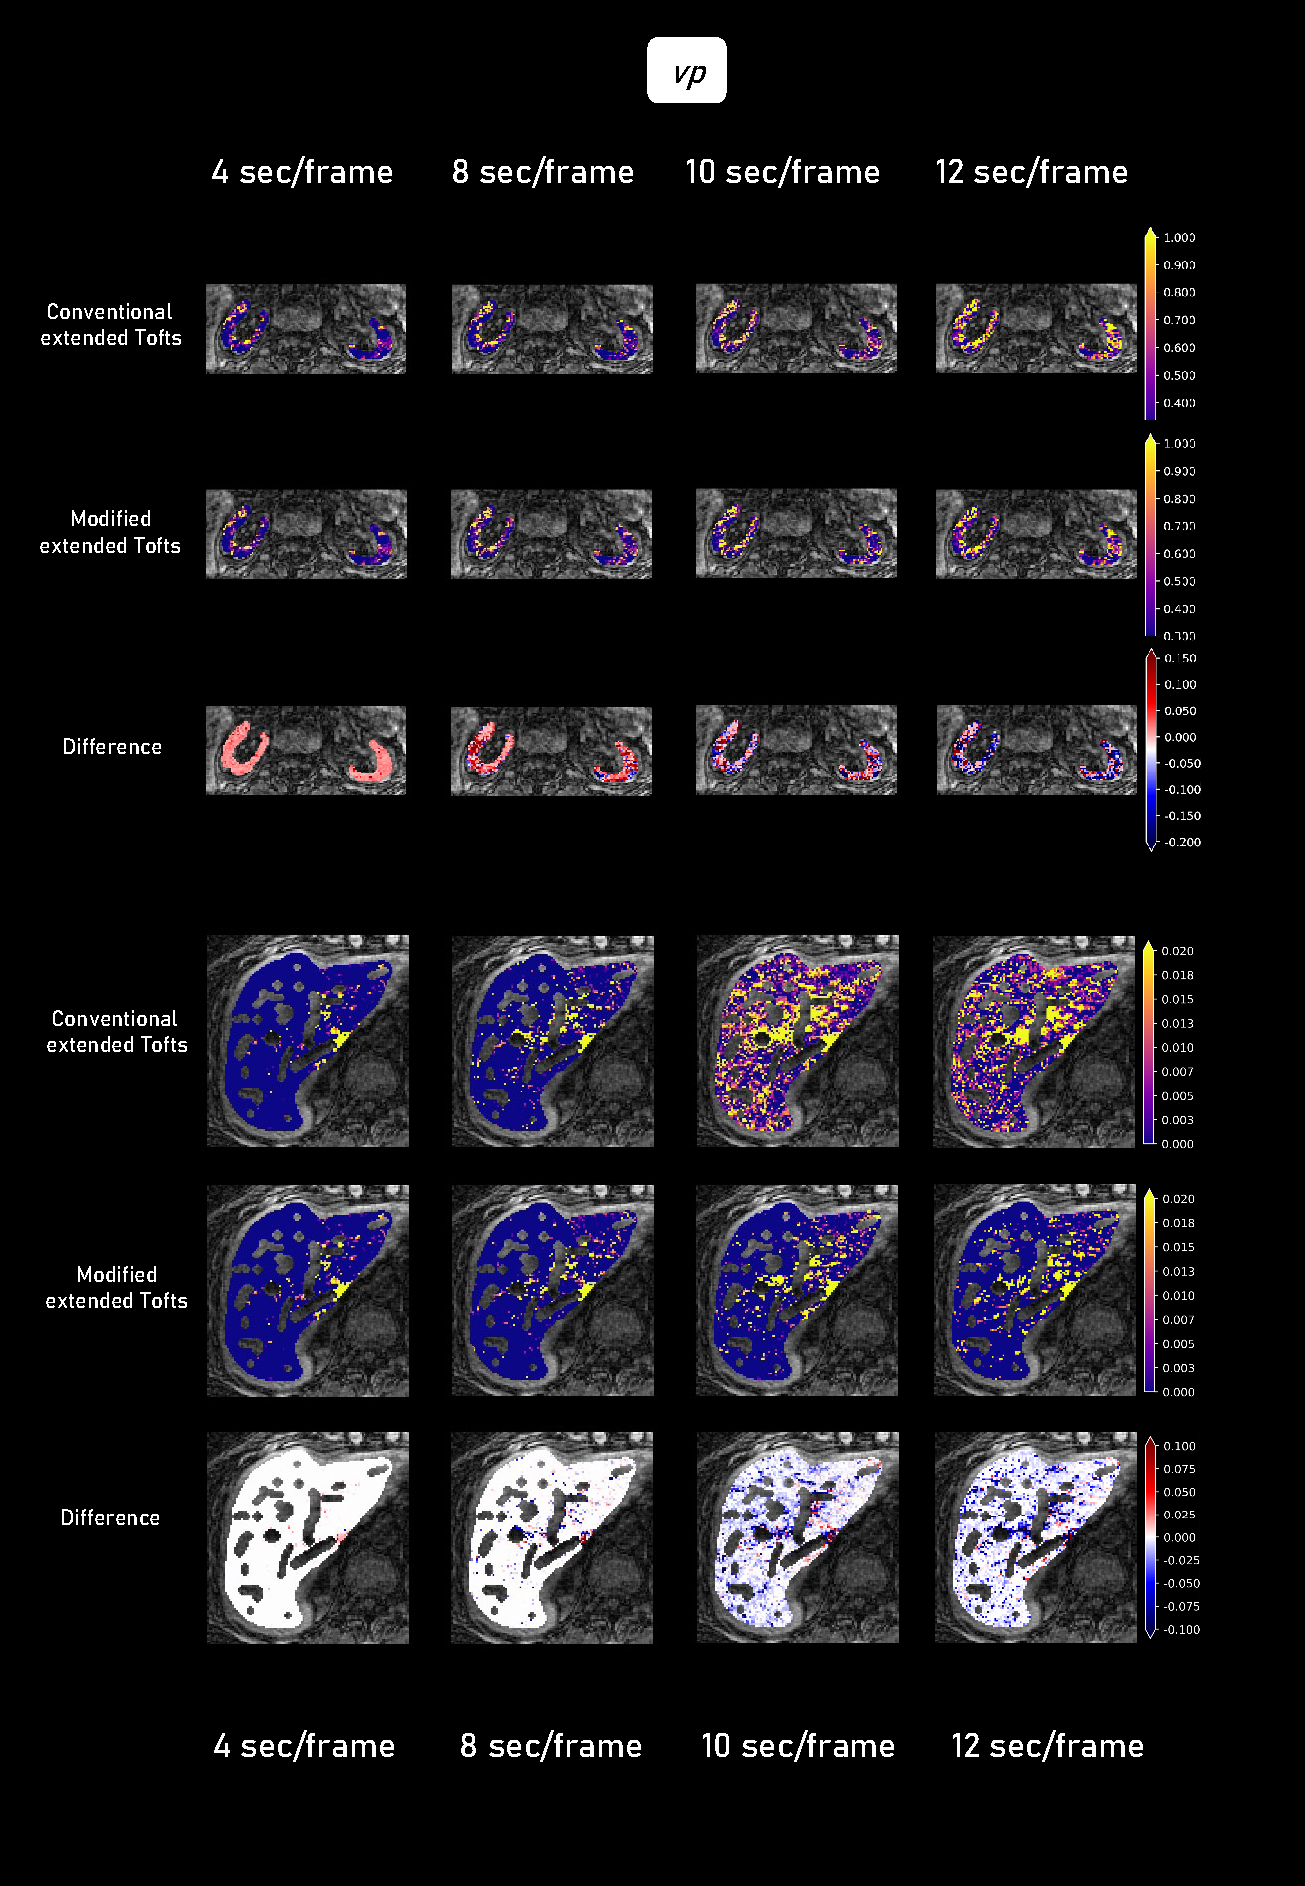
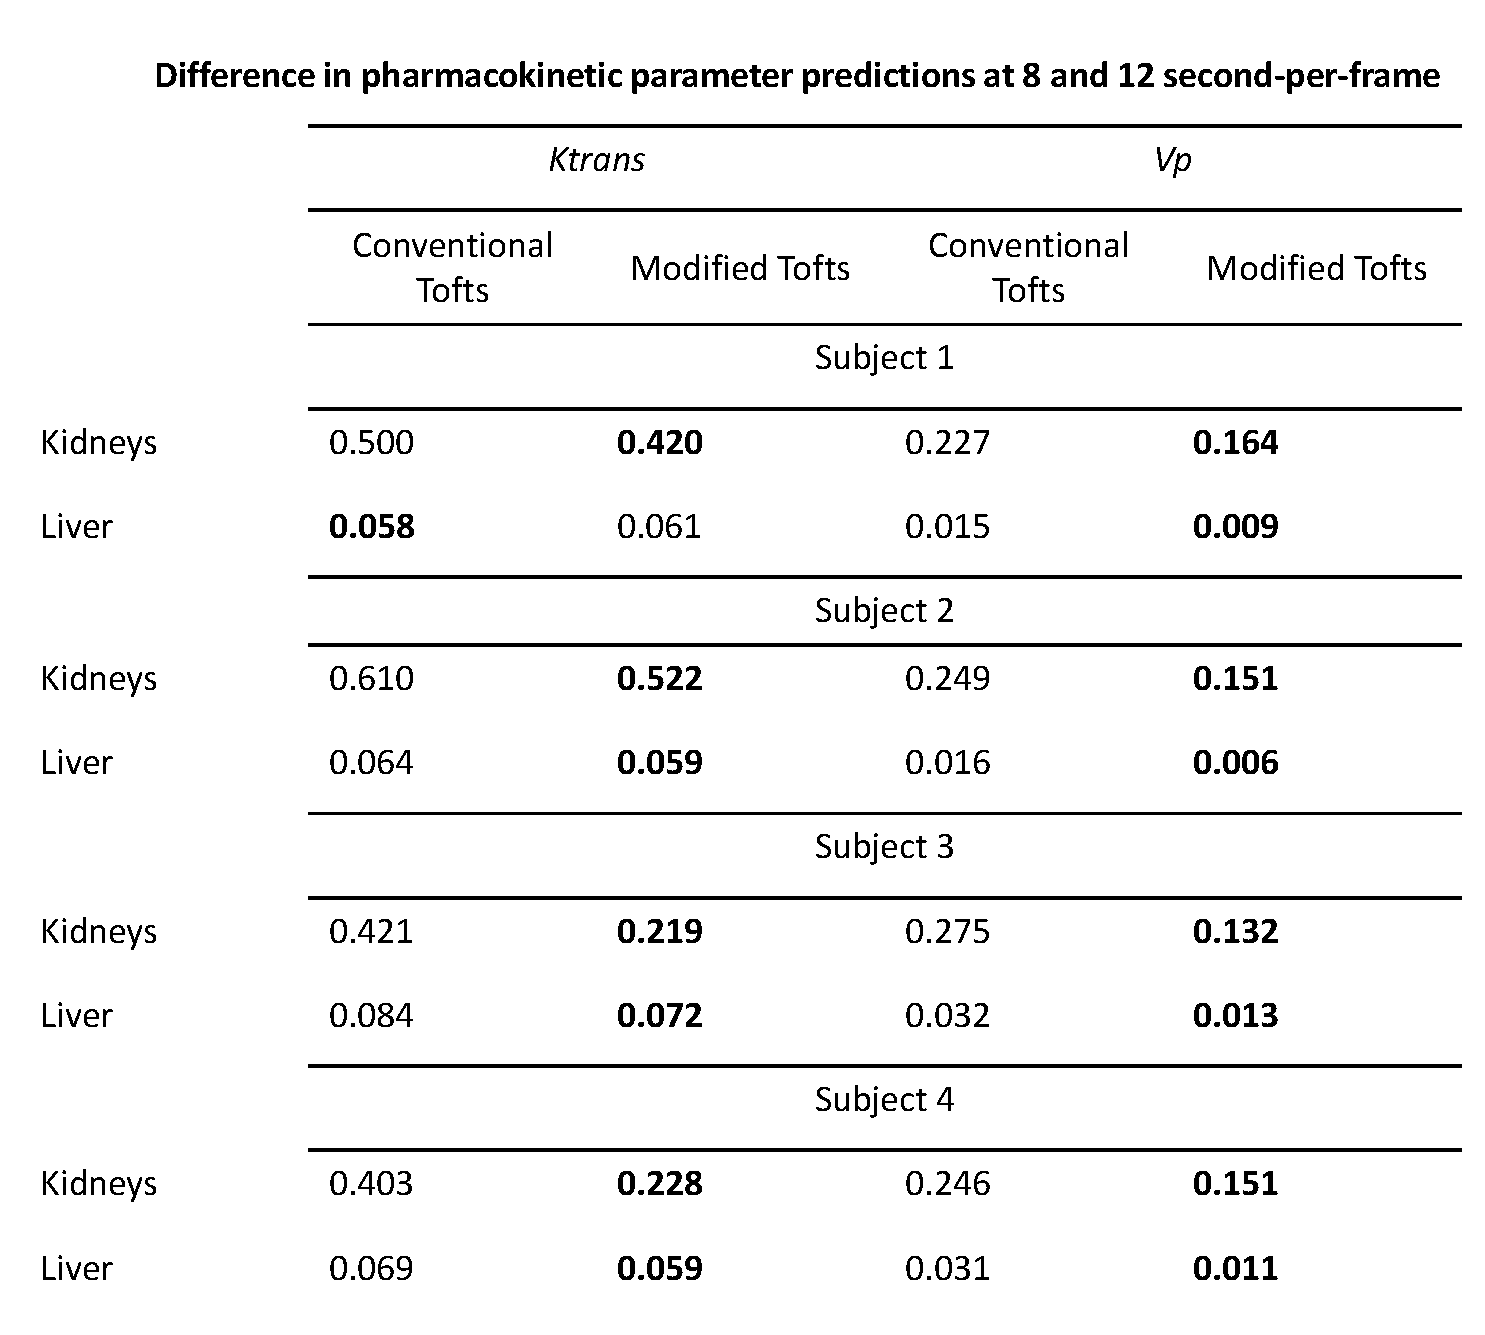
Table 1: Comparison of predictions of Ktrans and vp at different temporal resolutions of 8 and 12 second-per-frame using conventional and time-averaged extended Tofts model. Lower differences (in bold) demonstrate the more robust performance of a model.