1044
A novel mathematical model to quantify tumor fluid properties on longitudinal breast DCE-MRI for neoadjuvant chemotherapy response assessment1Medical Physics, Memorial Sloan Kettering Cancer Center, New York, NY, United States, 2Advanced Imaging Research Center, Oregon Health & Science University, Portland, OR, United States, 3Radiology, Memorial Sloan Kettering Cancer Center, New York, NY, United States, 4Applied Mathematics & Statistics and Computer Science, Stony Brook University, Stony Brook, NY, United States
Synopsis
Keywords: Contrast Agents, Perfusion, Modelling, Tumors, Biomarkers, Quantitative Imaging
Motivation: To advance the field of pharmacokinetic analysis of breast DCE-MRI by developing a model accounting for inter-fluid transport within tumor tissue
Goal(s): To develop a novel DCE-MRI pharmacokinetic method to quantify and visualize fluid flows in tumors and identify predictive imaging biomarkers of therapeutic response to neoadjuvant chemotherapy (NACT) in breast cancer.
Approach: We developed a mathematical model in computational fluid dynamics termed the unbalanced regularized optimal mass transport (urOMT)
Results: Our urOMT model provides fluid transport properties of the tumor using breast DCE-MRI; the urOMT-derived quantitative metrics may be future predictive imaging biomarkers to measure treatment effectiveness in patients treated with NACT.
Impact: We developed a novel mathematical model to quantify, track, and visualize fluid flows in tumors with breast DCE-MRI data. The proposed quantitative metrics after validation may serve as predictive imaging biomarkers for breast cancer patients treated with neoadjuvant chemotherapy.
Introduction
Breast cancer patients are commonly treated with neoadjuvant chemotherapy (NACT). Only a few patients can achieve a pathological complete response (pCR) to NACT. There is an unmet need for precise imaging biomarkers to predict a patient as a pCR or non-pCR1. In a dynamic contrast-enhanced magnetic resonance imaging (DCE-MRI) experiment on tumors, contrast agents are injected into the patient. They first enter the extracellular tumor tissue through the vasculature/blood vessels, which is called influx. Then they move within tissue via two transport motions: advection (directional bulk flows) and diffusion (Brownian motion). At last, contrast agents exit the tissue back to the vasculature, which we call efflux. The most used pharmacokinetic DCE analysis model is based on the two-compartment of fluid exchange2. There is an urgent need to investigate the transport within the tumor tissue governed by advection and diffusion reflecting tumor physiology.Methods
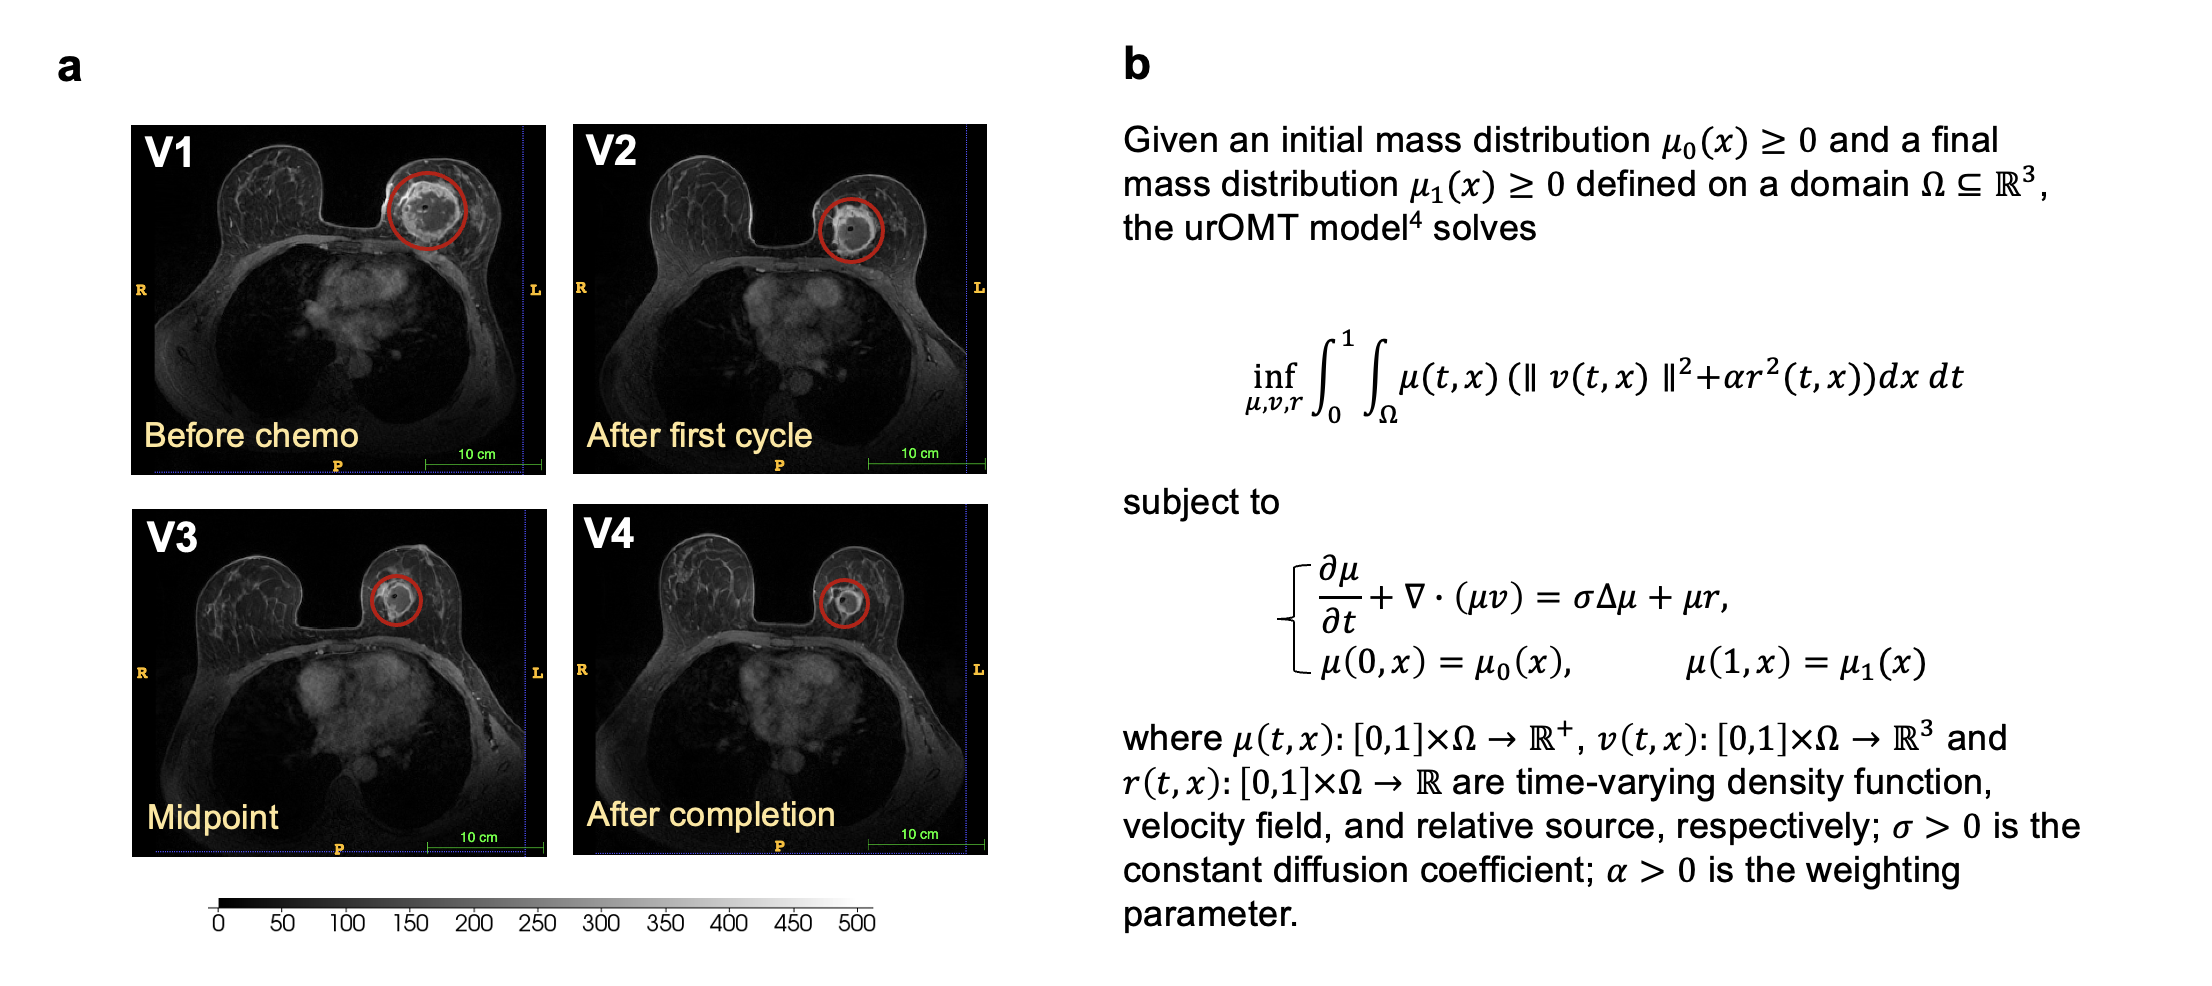
Patients: There are 132 longitudinal DCE-MRI studies across 33 breast cancer patients treated with NACT. Each patient underwent 4 DCE-MRI scans: before-NACT (Visit 1, V1, the baseline), after one cycle of NACT (V2), at the mid-point of NACT (V3) and after the completion of NACT (V4, Figure 1a)3. It took about one month between two adjacent visits.MRI Method: About 30 3D images were collected in each IRB-approved DCE-MRI study lasting ~10min3. Details can be found in manuscript3.
Pathological Response: After NACT and a tumor-removal surgery, response was assessed at pathology as either a pCR (N=6) or a non-pCR (N=27).
Novel Mathematical Model: We developed a model called the unbalanced regularized optimal mass transport (urOMT)4, which is an extension of the regularized optimal mass transport model (rOMT)5,6 by adding a source term into the advection-diffusion equation to account for influx and efflux. Both rOMT and urOMT have been applied to studying fluid flows in rat brains with DCE-MRI4-7. The mathematical formulation of urOMT is given in Figure 1b.
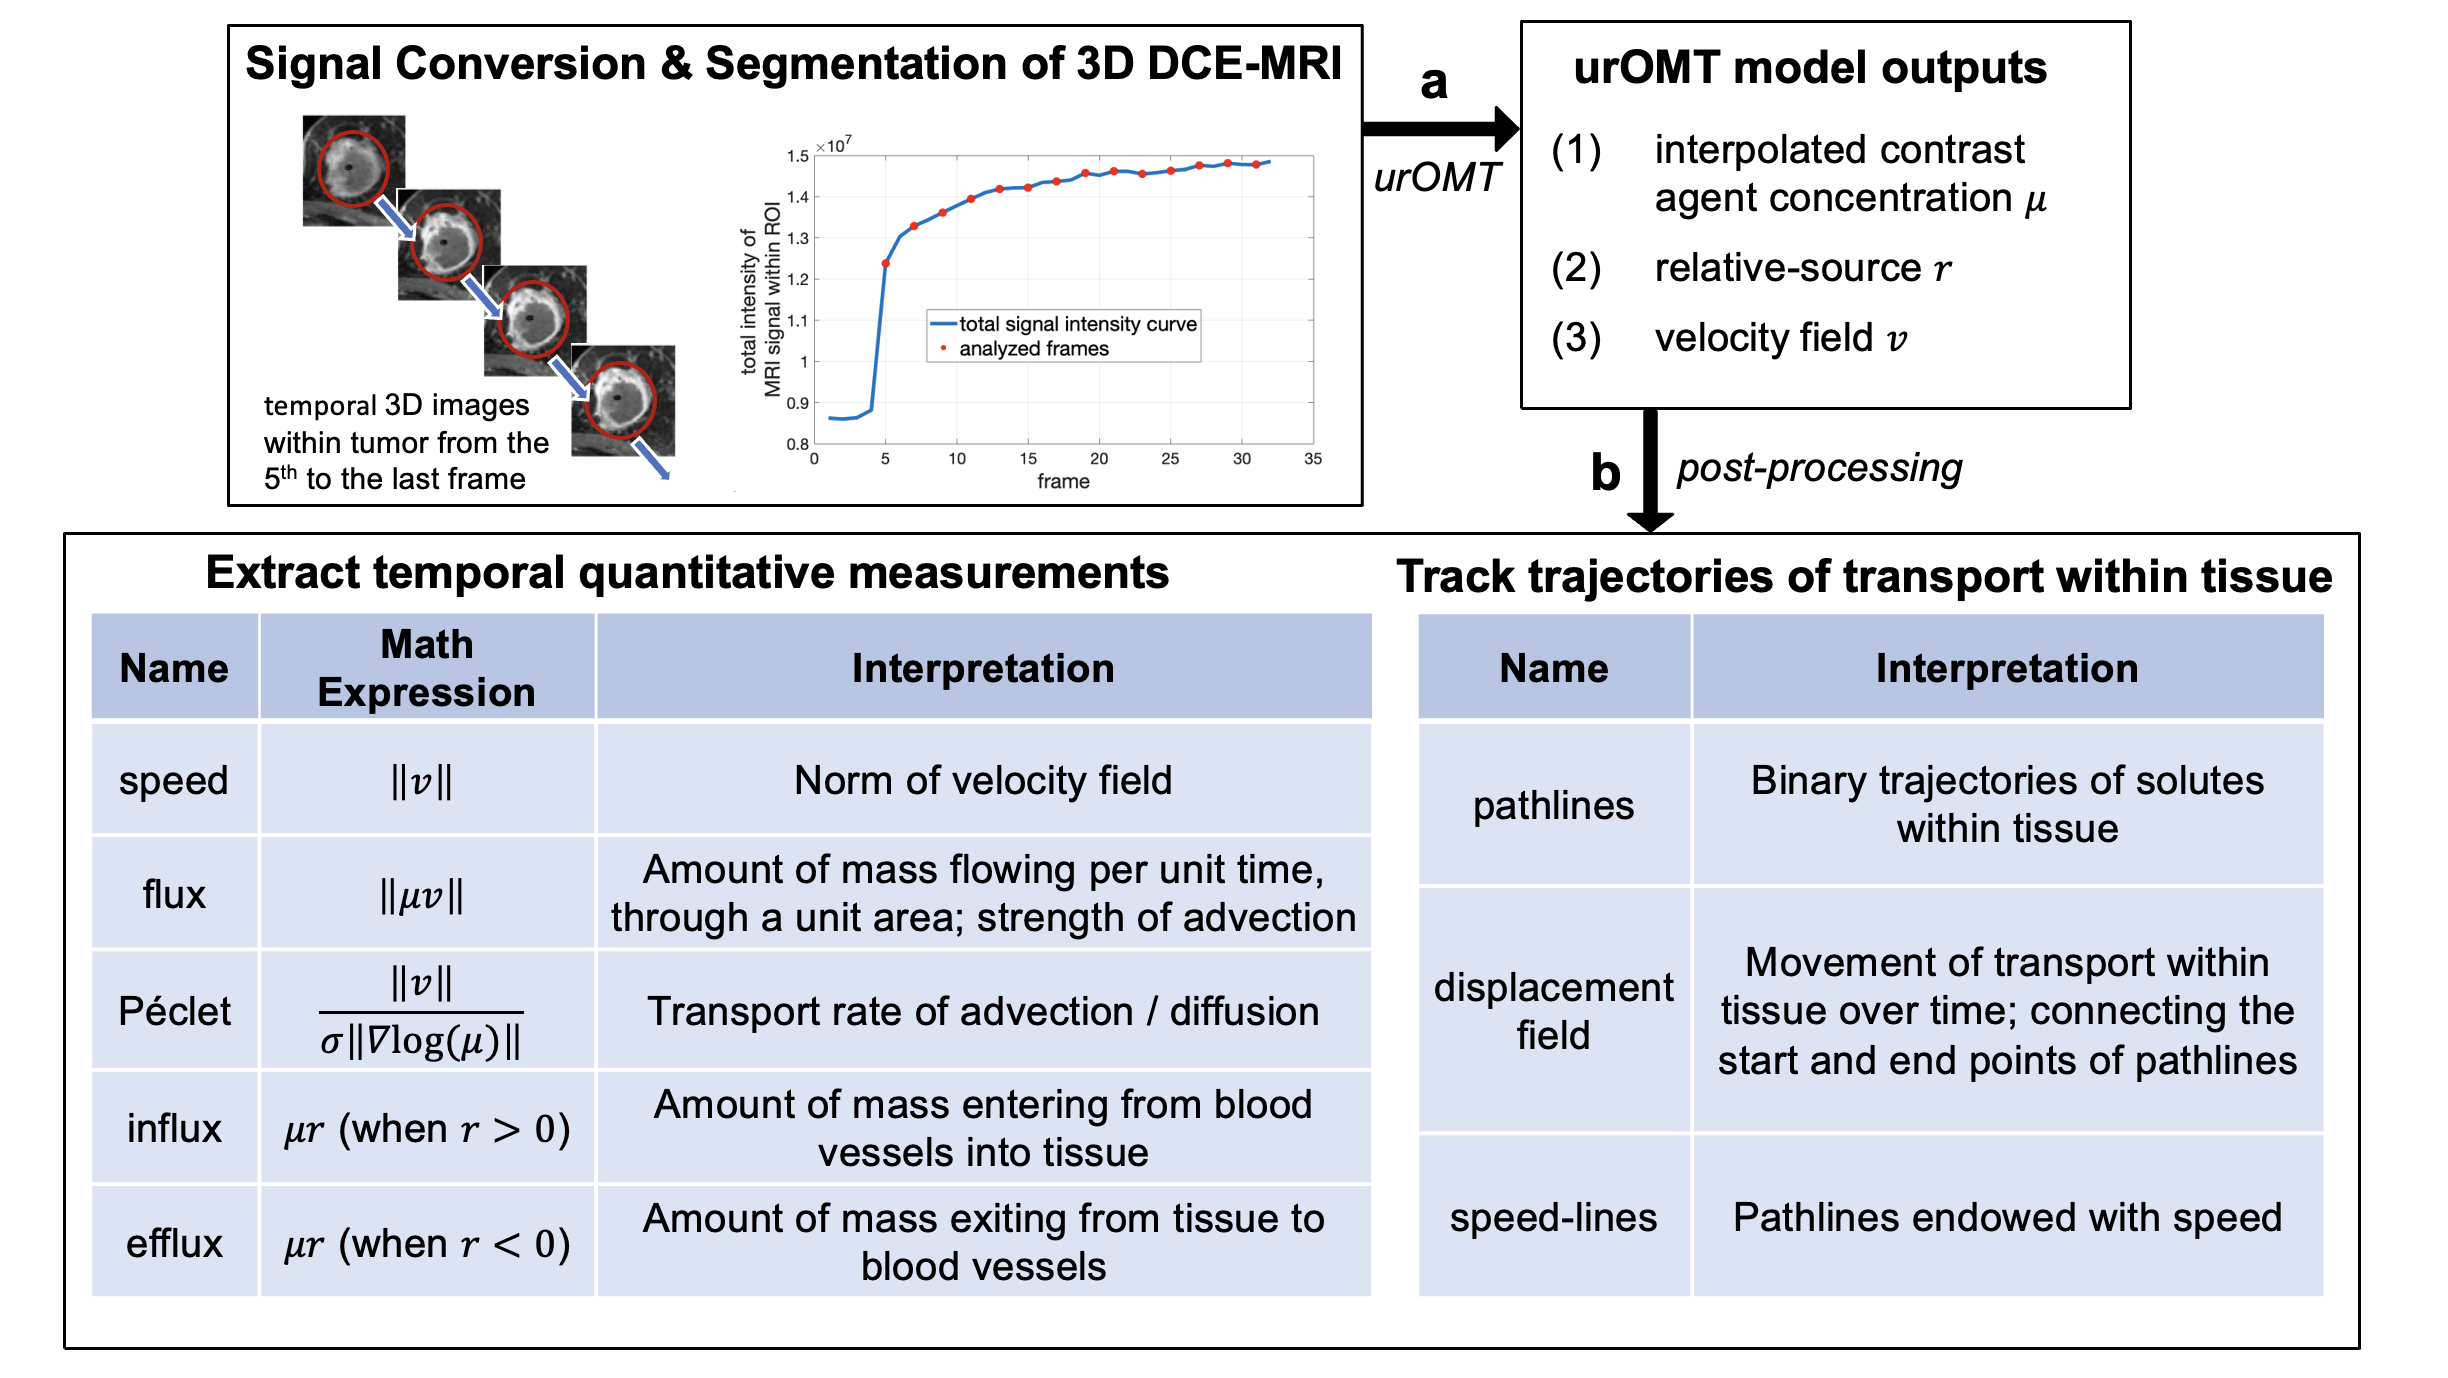
Data Analysis: We first converted MRI signals into concentration images of contrast agents and segmented the tumor as a region of interest (ROI) drawn by experienced breast radiologists. For each DCE-MRI study, we put temporal images from the 5th to the last frame within ROI into the urOMT algorithm8 (Figure 2a). In post-processing, we extracted dynamic quantitative measurements which reflect the local fluid properties and tracked the trajectories of the transport within tissue to visualize the direction of flows (Figure 2b).
Results
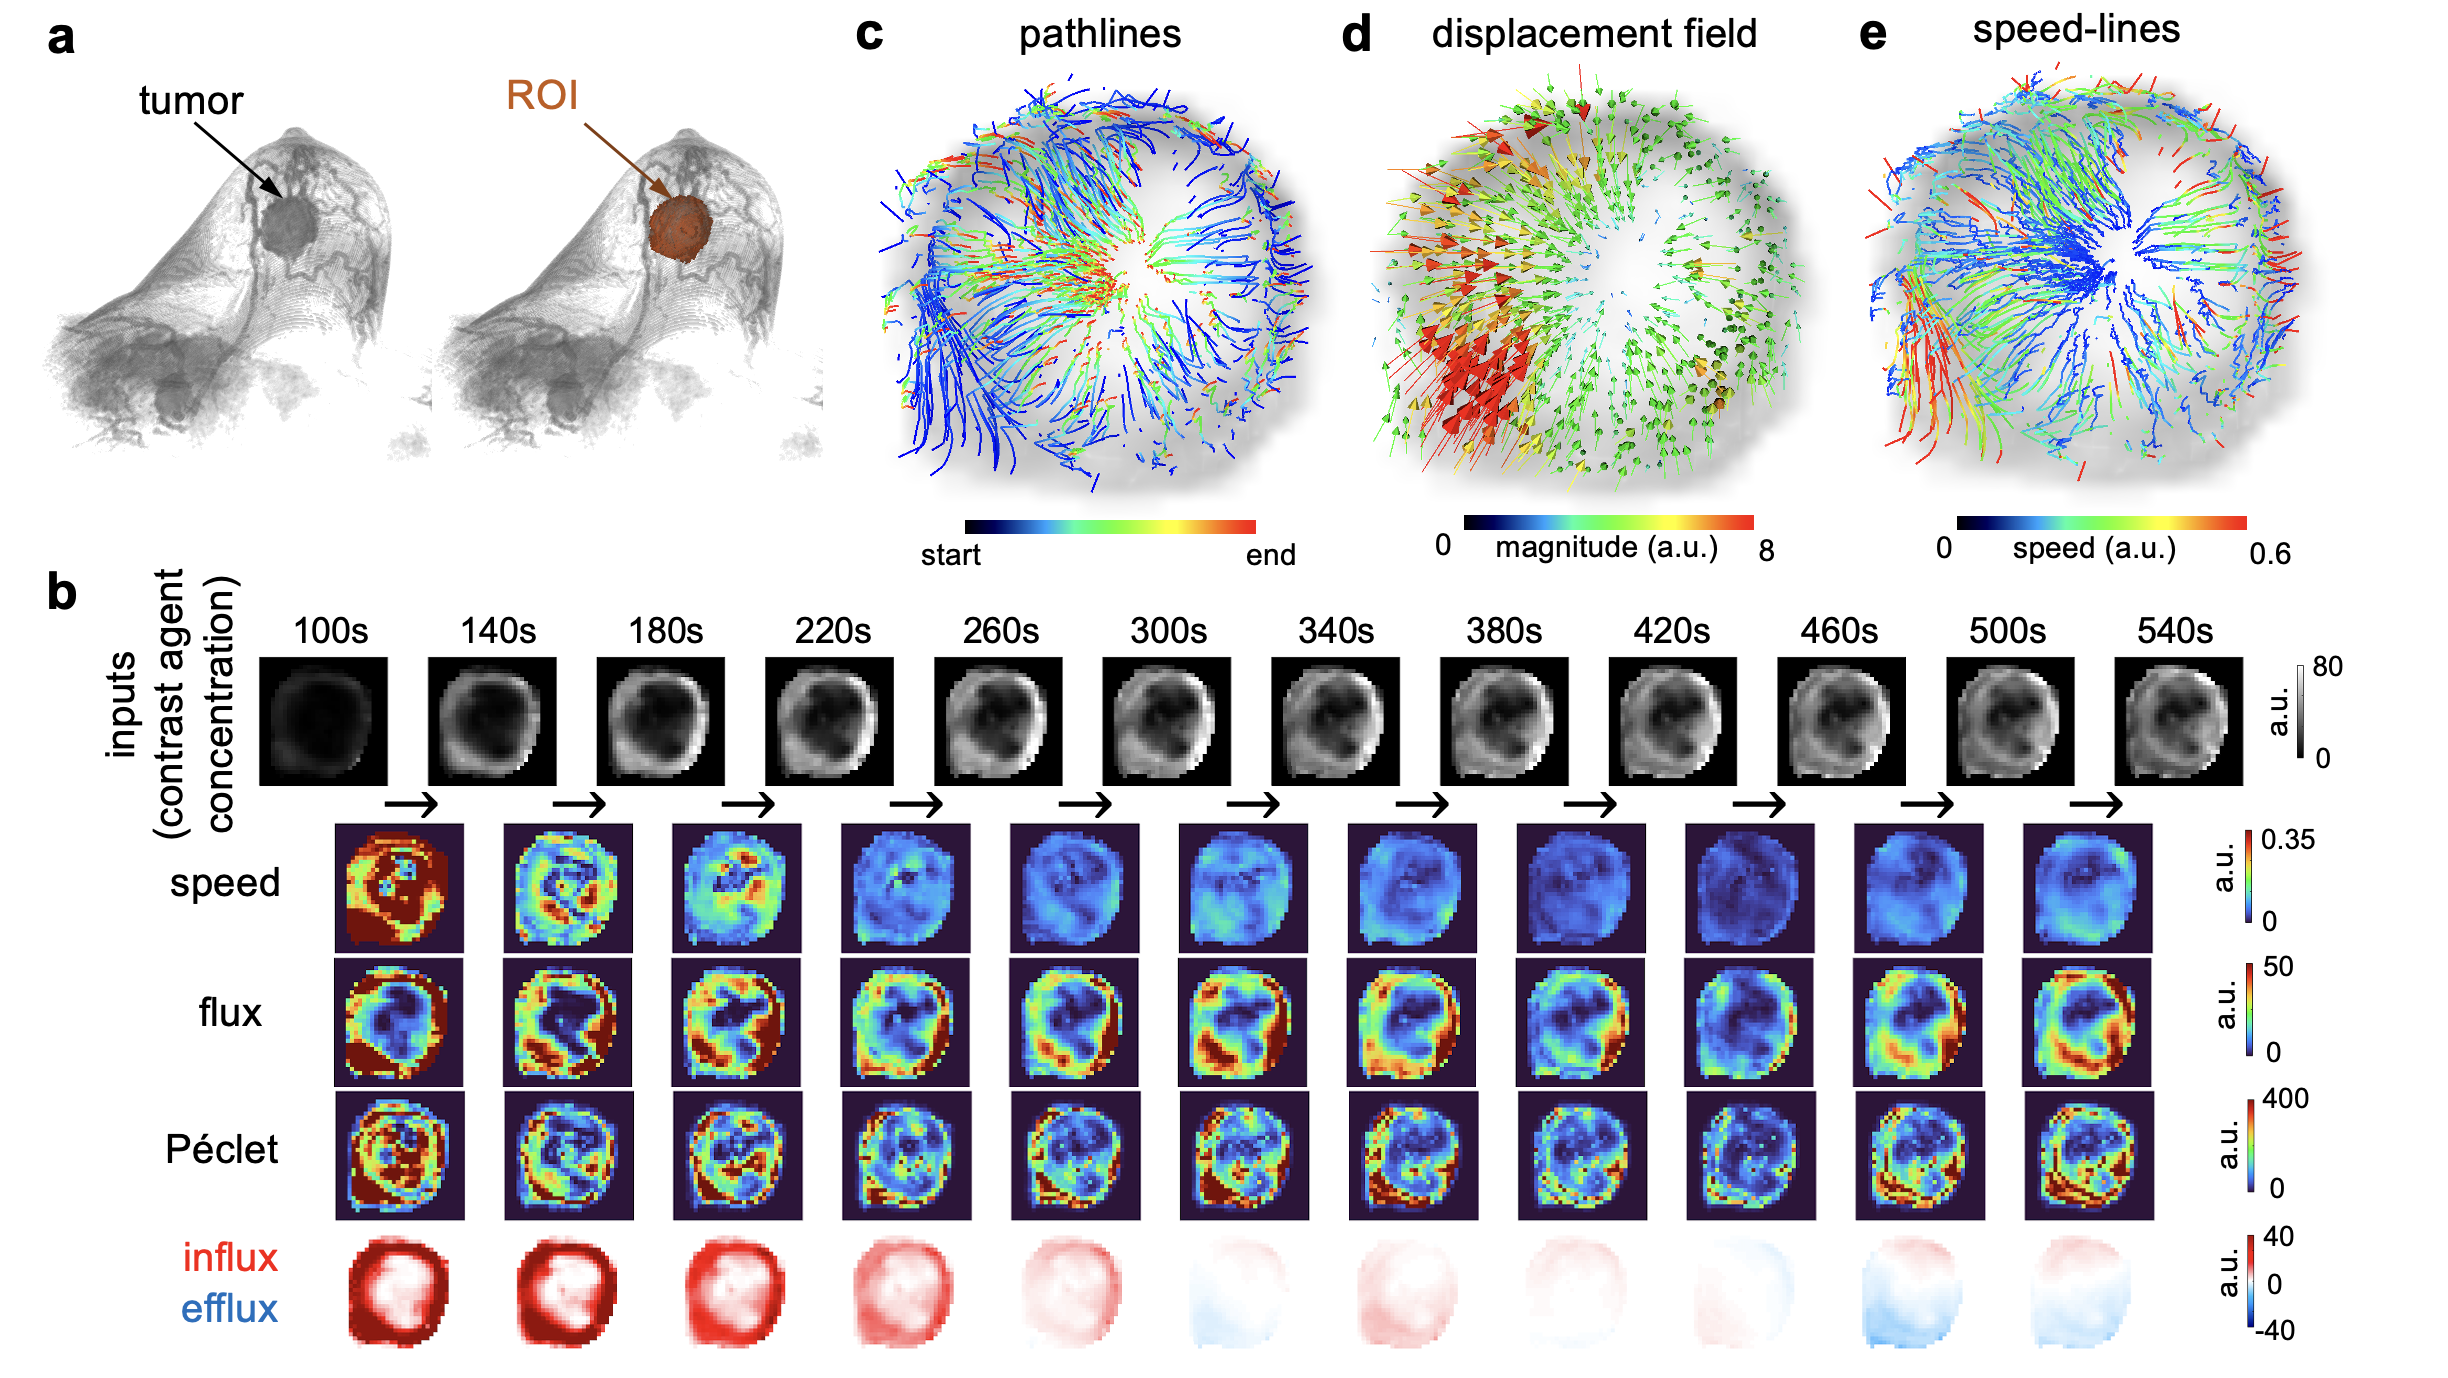
urOMT generates dynamic transport measurements and shows directional trend of flowsWe demonstrate results of one representative study on a tumor at baseline (Figure 3a). The dynamic measurements (Figure 3b) illustrate the changes of the tumor fluid properties over time. For example, from flux and Péclet, the flows in the tissue were stronger around the boundary than inside of the tumor for the entire time. The influx was intense at first and later efflux slowly occurred. The tracking method shows that the flows moved from the boundary towards the center of the tumor, whose speed turned slower when they reached the tumor center (Figure 3c-d).
urOMT reveals differences in the longitudinal transport properties between pCR and non-pCR
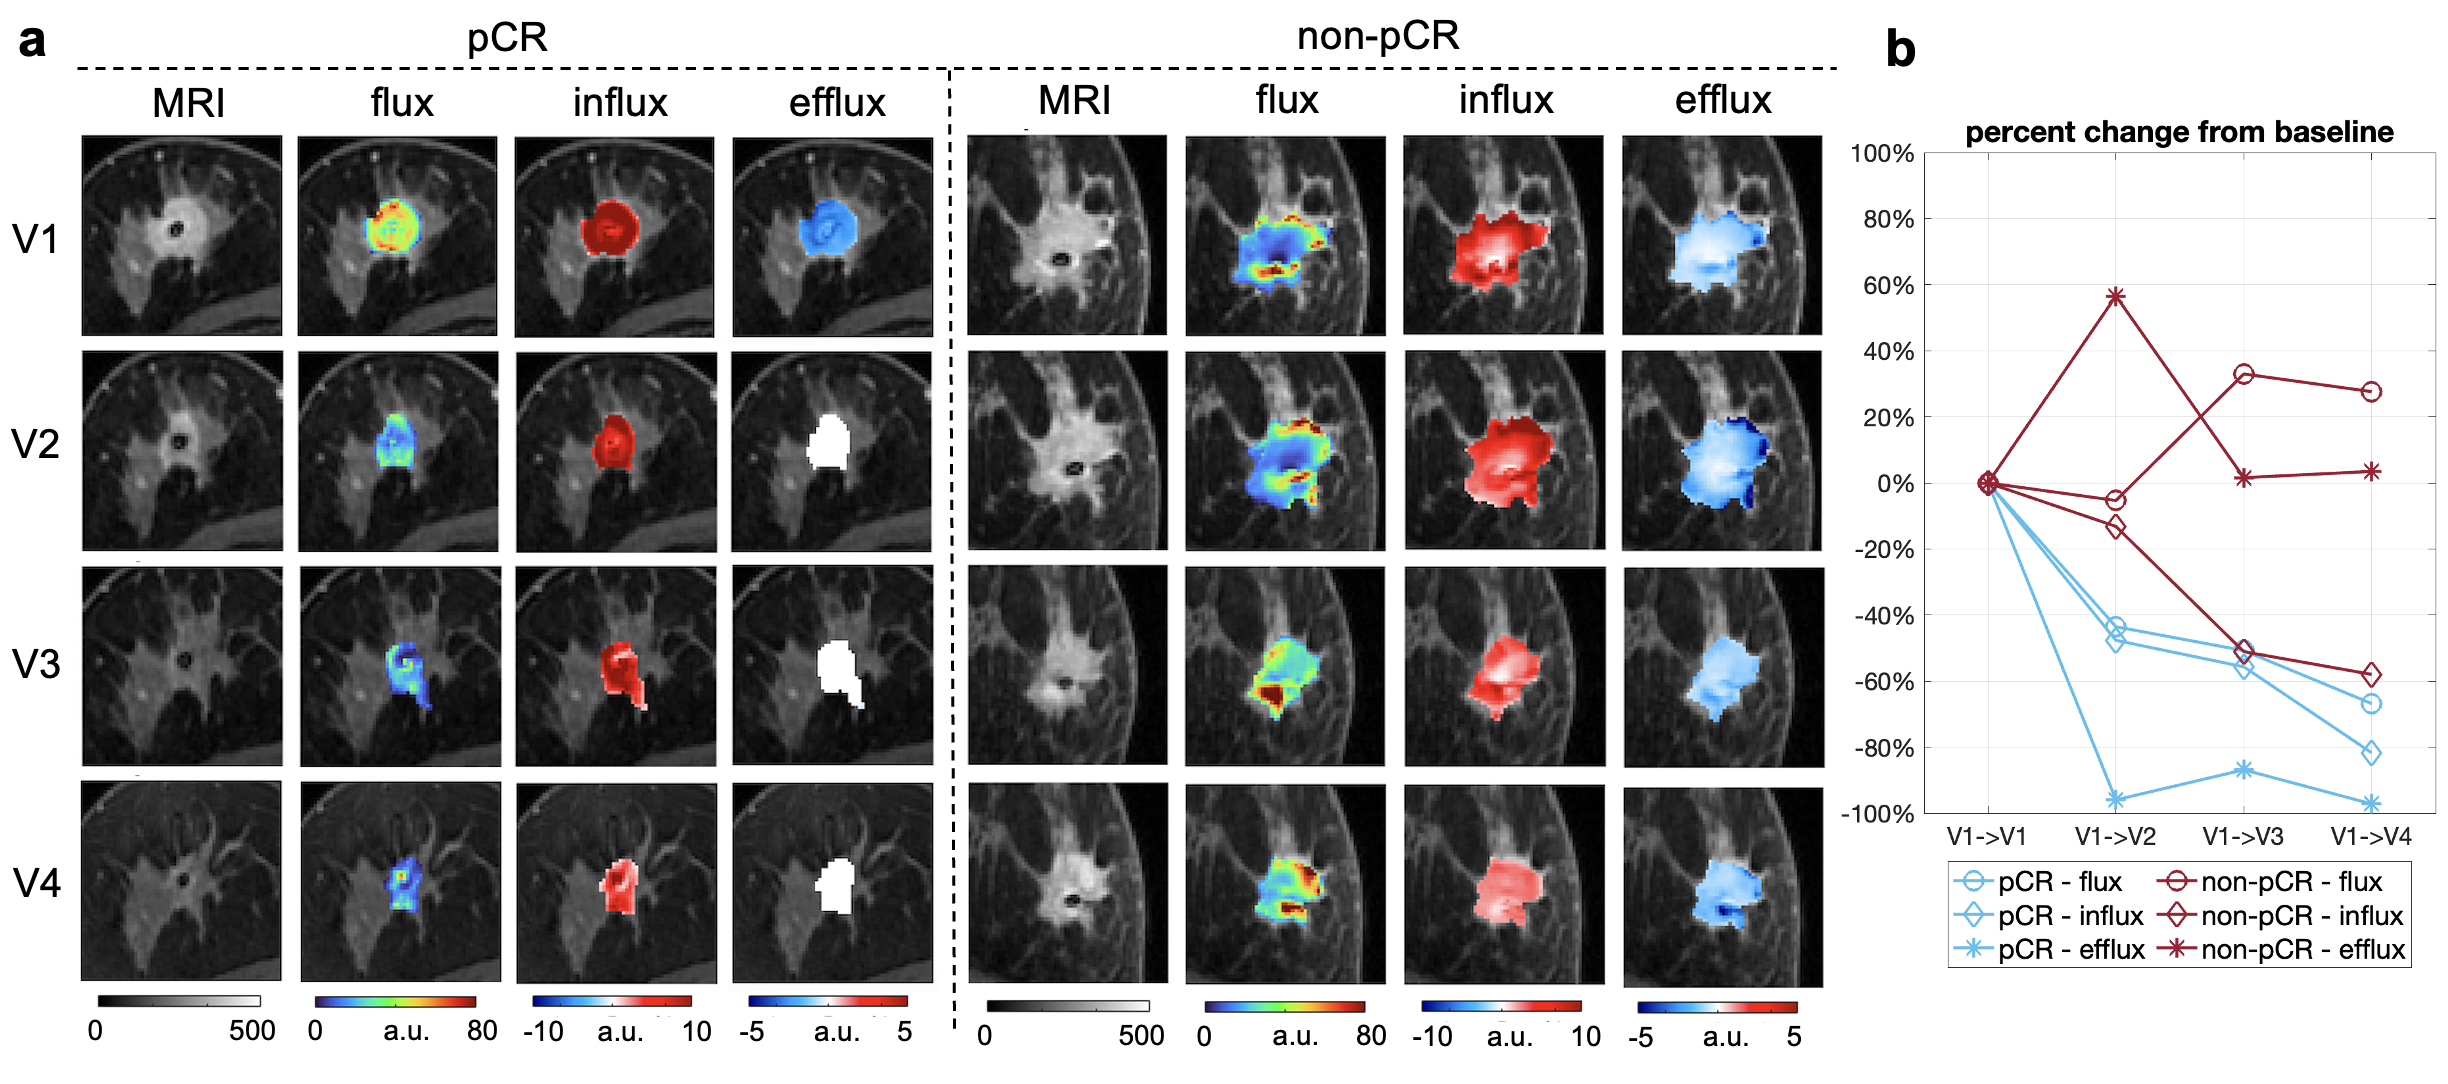
In Figure 4, we longitudinally show time-averaged measurements for one pCR and non-pCR. Typically for a pCR, the average flux, influx and efflux all went down compared to the baseline which hints the effective destruction of the vasculature functionality and the interior activities of the tumor by NACT. In contrast, a non-pCR may experience increases in some measurements during NACT, indicating a partial response to the treatment.
urOMT-derived metrics may serve as useful biomarkers to predict therapeutic responses
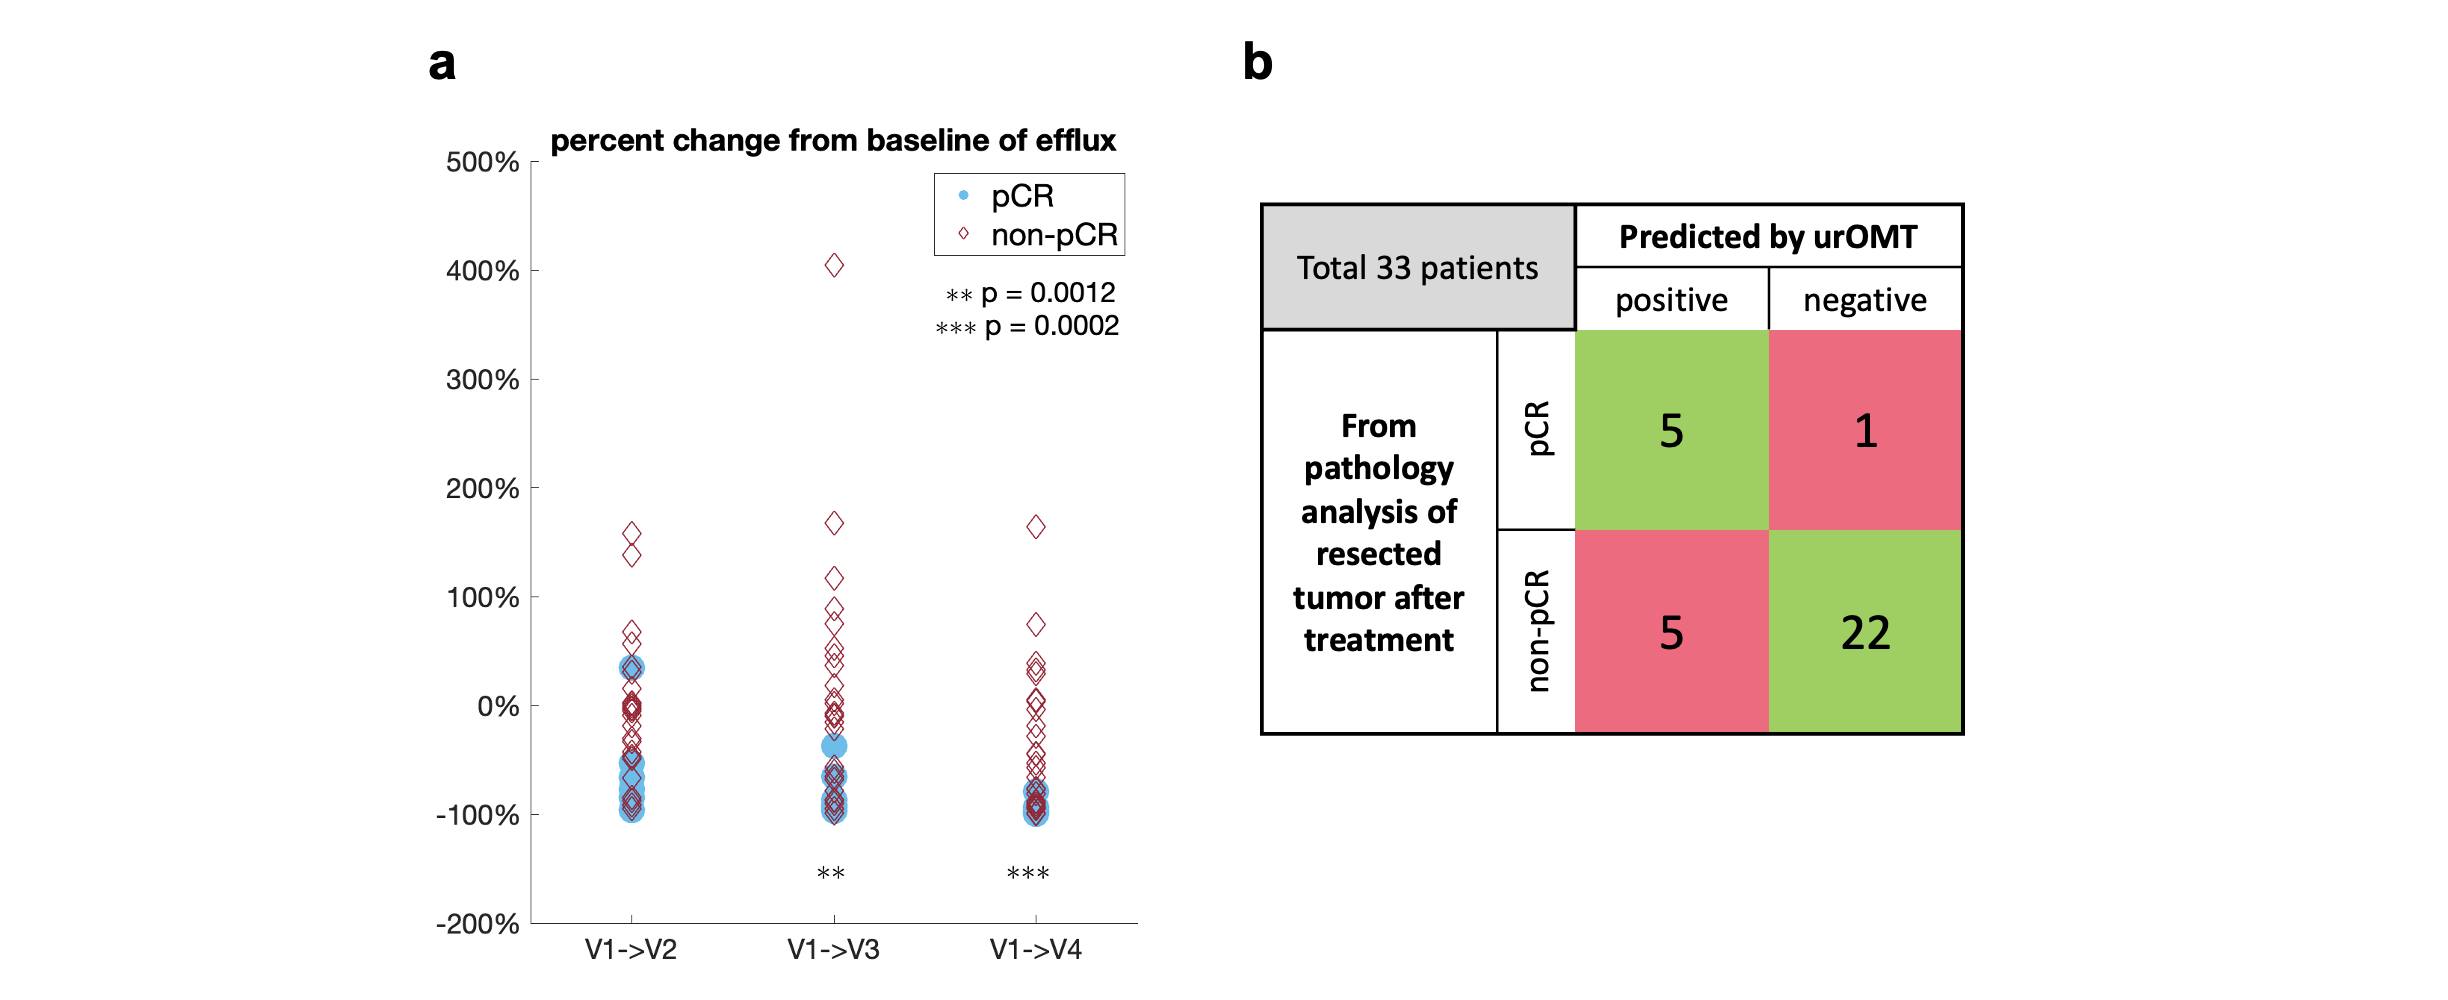
Analyzing all 132 DCE-MRI scans, we noticed a statistical significance in the %change of efflux between the pCRs and non-pCRs at V3 and V4 (Figure 5a). If we define patients whose average flux, influx and efflux all decreased from V1 at all three follow-up visits as urOMT-response-positive, we found the consistency of the response prediction is 81.85% when compared to the pathologic response outcome (Figure 5b).
Conclusion
As a method in computational fluid dynamics, our urOMT model accounts for fluid exchange between the tumor tissue and the vasculature as well as advection and diffusion within tumor tissue. The urOMT model sheds light on the physiology of tumors by measuring the fluid transport properties of the tumor in a dynamic manner and by tracking fluid trajectories to provide directional information of the flows. As shown by the results from the DCE-MRI of breast cancer patients treated with NACT, the urOMT-derived metrics may potentially serve as imaging biomarkers to quantify and predict therapeutic responses.Acknowledgements
This work is funded by AFOSR grants FA9550-20-1-0029 and FA9550-23-1-0096; NIH grant R01-AG048769, U01 CA154602 and R01 CA248192; a grant from Breast Cancer Research Foundation BCRF-17-193; Army Research Office grant W911NF2210292; and a grant from the Cure Alzheimer's Foundation.References
1. Thawani R, Gao L, Mohinani A, et al. Quantitative DCE-MRI prediction of breast cancer recurrence following neoadjuvant chemotherapy: a preliminary study. BMC Medical Imaging. 2022 Dec;22(1):1-1.
2. Tofts PS, Brix G, Buckley DL, et al. Estimating kinetic parameters from dynamic contrast‐enhanced T1‐weighted MRI of a diffusable tracer: standardized quantities and symbols. Journal of Magnetic Resonance Imaging: An Official Journal of the International Society for Magnetic Resonance in Medicine. 1999 Sep;10(3):223-32.
3. Tudorica A, Oh KY, Chui SY, et al. Early prediction and evaluation of breast cancer response to neoadjuvant chemotherapy using quantitative DCE-MRI. Translational oncology. 2016 Feb 1;9(1):8-17.
4. Chen X, Benveniste H, Tannenbaum A. Unbalanced Regularized Optimal Mass Transport with Applications to Fluid Flows in the Brain. arXiv preprint arXiv:2301.11228. 2023 Jan 26.
5. Chen X, Tran AP, Elkin R, et al. Visualizing fluid flows via regularized optimal mass transport with applications to neuroscience. Journal of Scientific Computing. 2023 Nov;97(2):26.
6. Chen X, Liu X, Koundal S, et al. Cerebral amyloid angiopathy is associated with glymphatic transport reduction and time-delayed solute drainage along the neck arteries. Nature aging. 2022 Mar;2(3):214-23.
7. Koundal S, Elkin R, Nadeem S, et al. Optimal mass transport with Lagrangian workflow reveals advective and diffusion driven solute transport in the glymphatic system. Scientific reports. 2020 Feb 6;10(1):1990.
8. Chen X. https://github.com/xinan-nancy-chen/urOMT. April 17, 2023.
Figures