1043
Validating DCE-MRI estimates of leakage volumes associated with subtle blood-brain barrier dysfunction using two-photon microscopy.1Division of Informatics, Imaging, and Data Sciences, School of Health Sciences, Faculty of Biology, Medicine and Health, The University of Manchester, Manchester, United Kingdom, 2Geoffrey Jefferson Brain Research Center, Manchester Academic Health Science Center, The University of Manchester, Manchester, United Kingdom, 3University College London, London, United Kingdom, 4Division of Psychology, Communication and Human Neuroscience, School of Health Sciences, Faculty of Biology, Medicine and Health, The University of Manchester, Manchester, United Kingdom, 5UMR 1253, iBrain, Inserm, Bat Planiol, UFR de Médecine, Université de Tours, Tours, France, 6Division of Neuroscience, School of Biological Sciences, Faculty of Biology, Medicine and Health, Manchester Academic Health Science Centre, The University of Manchester, Manchester, United Kingdom
Synopsis
Keywords: Contrast Agents, DSC & DCE Perfusion
Motivation: DCE-MRI can be used to quantify subtle blood-brain barrier disruption. In this setting, it is generally assumed that contrast agent has access to the entire interstitial space. Prior work from our group indicates that contrast agent has access to a leakage volume much smaller than the interstitial space.
Goal(s): To provide independent validation of DCE-MRI leakage-to-vessel volume ratios (ve/vb) in the case of subtle BBB impairment.
Approach: The ve/vb ratio of Sulphorhodamine-101 (MW = 606.7g/mol) was measured in mouse brain using two-photon microscopy and compared to DCE-MRI estimates.
Results: The ve/vb ratio of sulphorhodamine-101 agrees well with DCE-MRI estimates.
Impact: Our results indicate that DCE-MRI kinetic models that assume infinite leakage volume (e.g. Patlak model) do not accurately reflect how Gd-DOTA distributes within the brain when BBB impairment is subtle.
Introduction
DCE-MRI can measure blood-brain barrier (BBB) disruption. At ISMRM 2021, we presented DCE-MRI data1 in cohorts with subtle BBB impairment and showed that kinetic models with finite interstitial volume fraction, ve, (extended Tofts, two-compartment exchange) provide a superior fit to those that assume ve is infinite (Patlak, two-compartment uptake). Interestingly, we found the ve predicted by the best fitting models was much lower than the known interstitial volume fraction (~4% vs ~20%, see Figure 1). These results indicate the available leakage volume of Gd-DOTA is much smaller than the interstitial space. In this study, we sought to validate our DCE-MRI findings using intravital 2-photon microscopy measurements of tracer leakage.Methods
DCE-MRI: Quantities, models, and processes are compliant with OSIPI CAPLEX2. Brain DCE-MRI data was acquired as described previously in healthy control, stroke, and Parkinson’s patients1. DCE-MRI data was segmented into gray matter ROIs and modelled using Patlak, extended Tofts, two-compartment uptake and 2-compartment exchange models. The best fitting model was assessed using the Akaike information Criterion. For models that assume a finite ve, the ve/vb ratio was calculated.2-photon: A cranial window was implanted in an 8-month-old EC-GCaMP mouse and the cortex imaged with intravital two-photon microscopy (Leica DM6 B). A cortical region of interest with high density capillaries was identified prior to injection of dye using the GCaMP florescence. Once the ROI was defined, sulforhodamine 101 (Thermo Scientific Chemicals, MW = 625.15g/mol) was injected i.v. (5mg/ml) as a bolus and its distribution imaged using a 20-minute dynamic scan with 10-second temporal resolution, matched to our DCE-MRI protocol1. Field of view: ~420µm2, 0.146 µm2 pixel. Data were analysed in two separate ways in ImageJ (v1.54f): 1) rectangular profiles were drawn on 4 vessels with varying diameter and the FWHM calculated over time and 2) blood vessel widths were estimated on a pixel-by-pixel basis by skeletonising the vessels, then calculating the distance from the skeleton to the edge of the vessels. The vessel width at T = 0 was assumed to be equal to the actual width of the blood vessel, and the vessel width at T = 20 min equal to the vessel plus leakage space. Estimations of vessel volume (vb) and leakage volume (ve) were made assuming a concentric cylinder model. The leakage-to-vessel ratio ve/vb was calculated to inform on the expected leakage volume in relation to vessel diameter.
Results
Estimates of ve, vb, and ve/vb obtained by DCE-MRI (extended Tofts model) are shown in Figure 1. The ve estimate (3.3%, Figure 1a) was lower than the expected volume of interstitial space in humans (~20%) 3. ve and vb values obtained from DCE-MRI were uncorrelated (p = 0.35, r = -0.1, Figure 1d). In gray matter of the control group the ratio was 0.76±0.32 (Figure 1c). Ktrans estimates from healthy gray matter were significantly higher when modelling finite ve compared to infinite ve (Figure 2). Figure 3 shows the vessel width over time as observed by imaging SR101 and analysed using first approach. Figure 4 shows the leakage-to-vessel volume ratio (ve/vb) analysed using pixelwise approach and plotted as function of vessel diameter. The ve/vb ratio estimated was lower than the value expected assuming interstitial volume ~ 20% and was closer to the estimates from DCE-MRI.Discussion & Conclusion
Intravital two-photon microscopy was used to validate leakage volumes of Gd-DOTA measured by DCE-MRI in subjects with subtle BBB impairment. 2-photon microscopy enables us to directly measure leakage of tracers at the microscopic scale which in case of DCE-MRI can only be inferred via mathematical modelling of the measured signal. Our data suggests that the leakage of small tracers such as Gd-DOTA and SR101 leak by a similar degree and become confined to a compartment much smaller than the known interstitial volume fraction (~3-4% rather than ~20%), possibly the perivascular space. If correct, these findings have far-reaching implications for DCE-MRI studies of subtle BBB breakdown. For example, the assumption that ve is infinite leads to an underestimation of BBB leakage rate Ktrans by a factor of 5-13 (Figure 2).This study has the following limitations: only one mouse was scanned. During the scan, some vessels within the FOV moved out of plane, leading to a reduction in vessel diameter over time (negative ve/vb). Despite having similar MW to Gd-DOTA, SR 101 kinetics may not be relatable to those of Gd-DOTA. We plan to repeat this study using more mice, multiple slices to capture through plane movement, and a wider range of small MW fluorophores.
Acknowledgements
MK's studies are funded by the Medical Research Council, United Kingdom.
For controls and ischaemic stroke data, work was funded by Lancaster University, Sydney Driscoll Neuroscience Foundation, The University of Manchester and Medical Research Council Studentship, Lancashire Teaching Hospitals NHS Foundation Trust, and the Engineering and Physical Sciences Research Council (EP/M005909/1).
References
1. Kozár M, Al-Bachari S, Parker G, Parkes L, Dickie B. DCE-MRI kinetic models for measuring subtle blood-brain barrier leakage– the importance of modelling finite interstitial volume fraction. Proc. Intl. Soc. Mag. Reson. Med. 30. 2022; DOI: https://doi.org/10.58530/2022/1580
2. Dickie B R, et al. A community-endorsed open-source lexicon for contrast agent–based perfusion MRI: A consensus guidelines report from the ISMRM Open Science Initiative for Perfusion Imaging (OSIPI). Magn. Reson. Med. 2023; DOI: https://doi.org/10.1002/mrm.29840
3. Syková E, and Nicholson C. Diffusion in brain extracellular space. Physiol. rev. 2008; 88(4): 1277–1340, DOI: https://doi.org/10.1152/physrev.00027.2007
4. Lulu X, et al. Sleep Drives Metabolite Clearance from the Adult Brain. Science. 2013; 342(6156), DOI: https://doi.org/10.1126/science.1241224
Figures
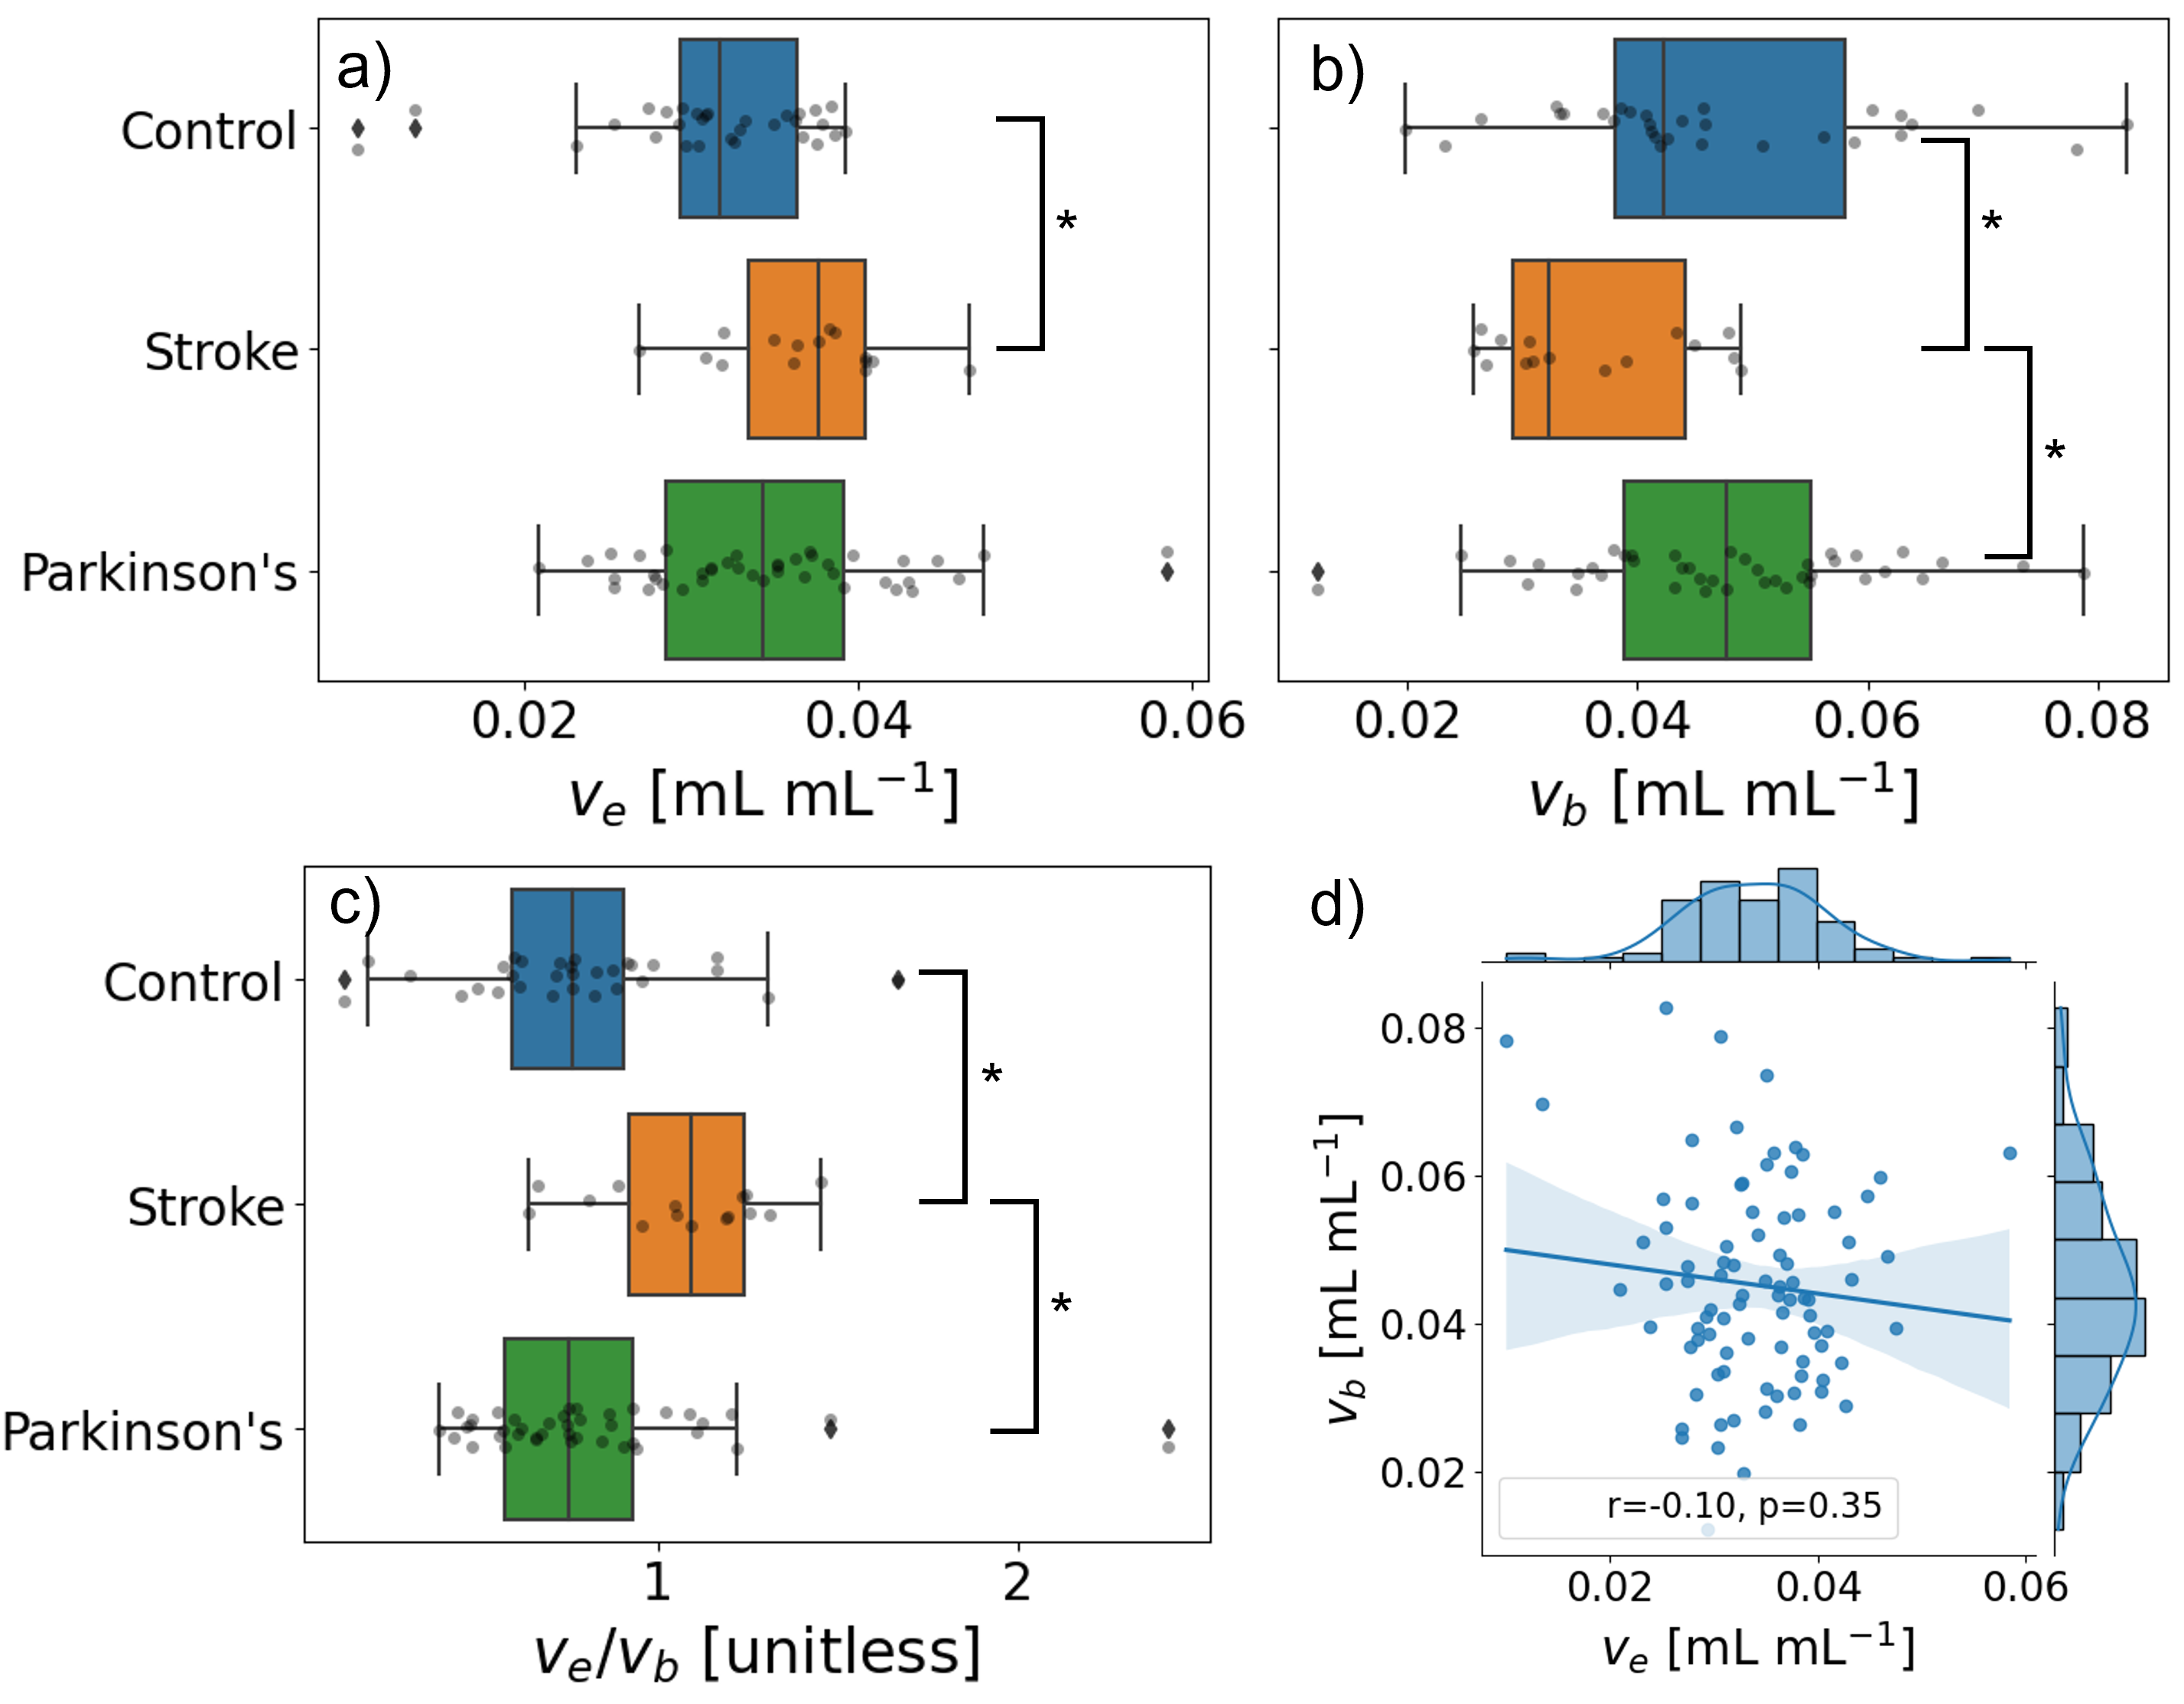
Figure 1: Boxplots of a) interstitial volume fraction (ve) and b) blood volume fraction (vb) obtained from human gray matter using extended Tofts model1. c) the ratio of the interstitial and blood volume fractions. d) bivariate (middle) and univariate (top and right) graphs of ve against vb including a linear regression fit and the statistic (r) and p-value (p) using Pearson’s correlation. * p < 5x10⁻².
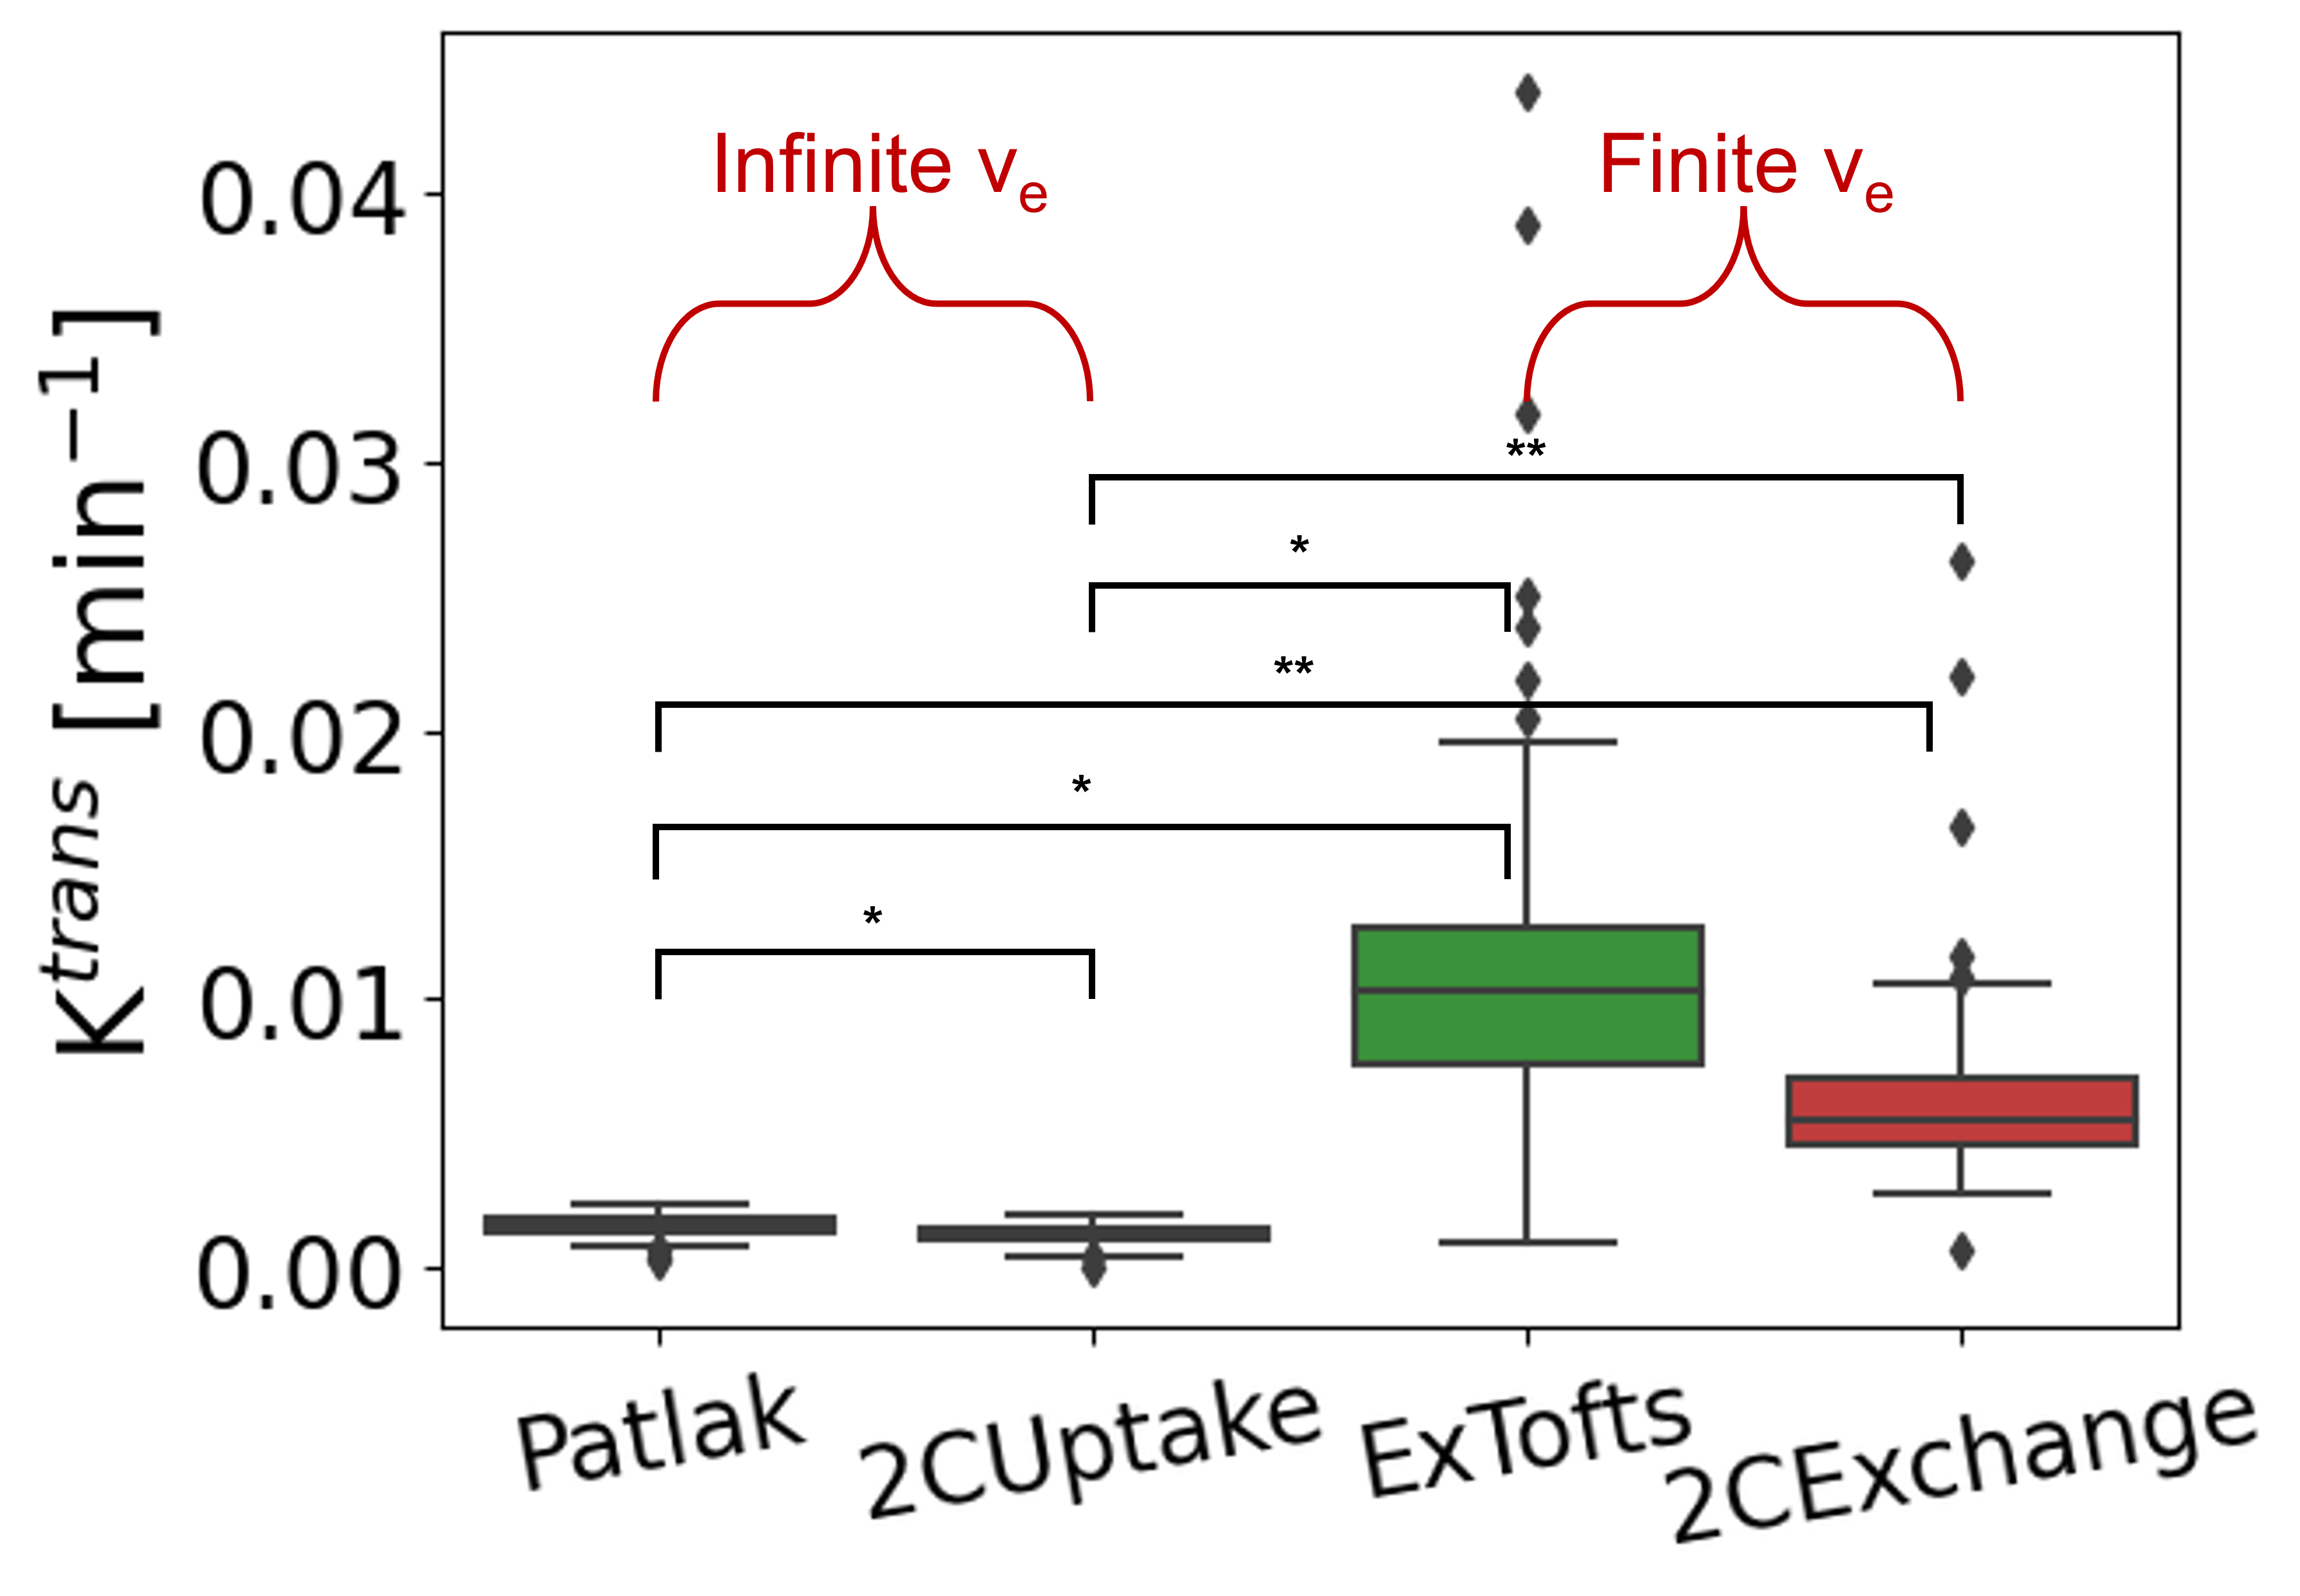
Figure 2: Ktrans estimates in gray matter of control patients1. Mean Ktrans values for Patlak and two-compartment uptake are (1.4±0.4)x10-3 and (1.0±0.4)x10-3 min-1 and for extended Tofts and two-compartment exchange are (1.8±4.2)x10-2 and (6.1±5.3)x10-3 min-1, respectively. * p < 5x10⁻² ** p < 5x10⁻⁵.
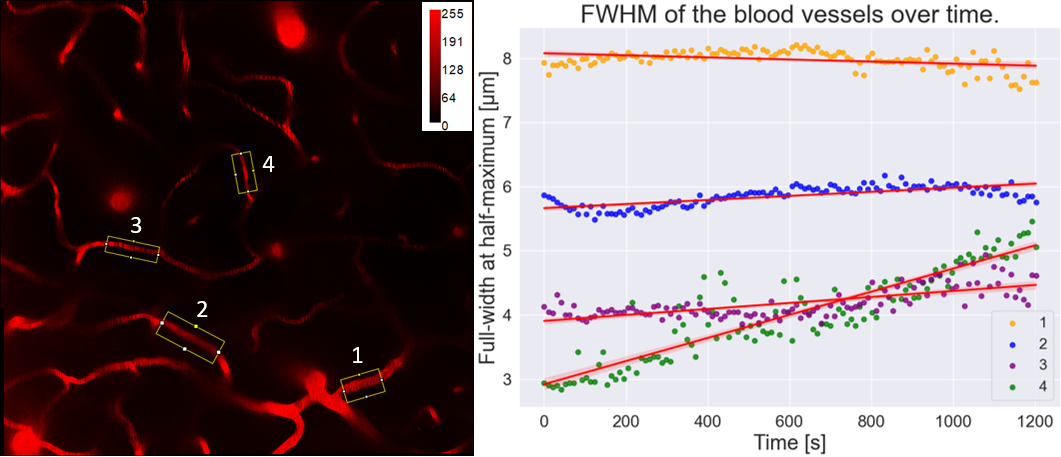
Figure 3: Blood vessel widths over time from a selection of four blood vessels. On the left: image with the ROIs highlighted. On the right: measured widths over time corresponding to the 4 regions of interest on the left. Linear regression was applied to the data and plotted as a red line together with a shaded area representing 95% confidence interval.
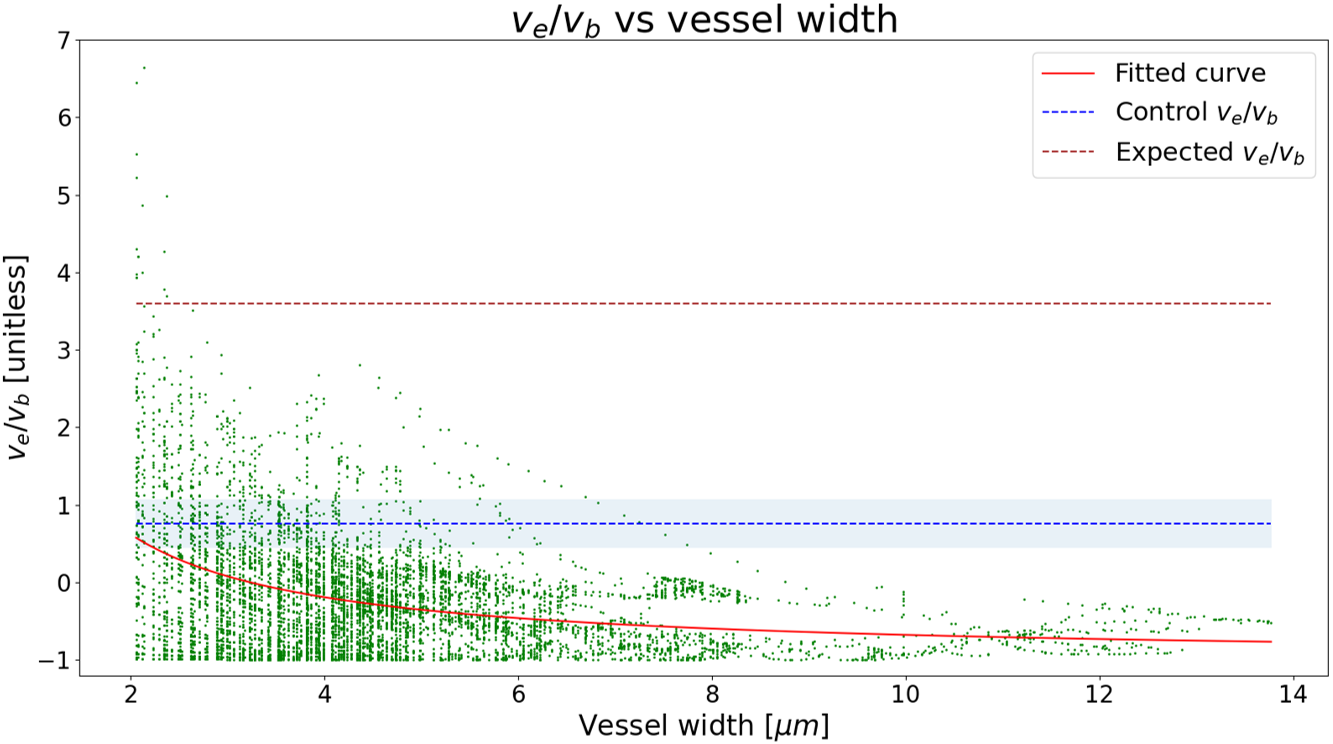
Figure 4: Scatter plot of the ve over vb ratio obtained from the 2-photon microscopy scan. A 1/x polynomial was fitted to the data and plotted in red. The ve over vb ratio obtained from the DCE-MRI control group was plotted as a blue dashed line for reference (shaded area showing within-group standard deviation). Assuming an interstitial volume of 22% in mice4, the brown dashed line shows the expected ve/vb ratio had the interstitial space been fully perfused. ve = interstitial space volume, vb = blood space volume.