1015
Unprecedented SNR Efficiency in Prostate DWI By Combining Ultra-Strong Gradients and Spiral Readouts1Cardiff University Brain Research Imaging Centre, Cardiff University, Cardiff, United Kingdom, 2Medical Radiation Physics, Lund University, Lund, Sweden, 3Leeds Institute of Cardiovascular and Metabolic Medicine, University of Leeds, Leeds, United Kingdom, 4Siemens Healthcare Ltd, Camberly, United Kingdom, 5Siemens Healthcare GmbH, Erlangen, Germany, 6Image Sciences Institute, University Medical Center Utrecht, Utrecht, Netherlands
Synopsis
Keywords: Diffusion Acquisition, Prostate, Field monitoring
Motivation: Prostate DWI with high b-values holds promise for microstructural tissue characterization but is notoriously SNR-deprived.
Goal(s): (i) To boost the SNR of prostate DWI; (ii) to reduce artefacts resulting from scanner imperfections that are exacerbated by the methods used to increase the SNR.
Approach: Spirals and strong gradients (≤300mT/m) are used to attain short TEs and thus high SNR. An expanded encoding model including measured static and dynamic fields is deployed to obtain high image quality.
Results: The approach is demonstrated in a healthy subject and a patient diagnosed with prostate cancer. It delivers higher SNR and improved cancerous lesion conspicuity.
Impact: We provide the demonstration of prostate DWI with ultra-strong gradients and spiral readouts. Using high b-values and short echo times enhances lesion conspicuity and holds potential for early and non-invasive disease detection.
Introduction
Ultra-high b-value DWI offers exceptional MRI contrast for in-depth characterization of tissue microstructure, holding promise for advancing the early detection of prostate cancer (PCa)1,2 and, in turn, reduction of biopsies3. Unfortunately, clinical DWI currently only allows for low b-values due to limited gradient amplitudes leading to prolonged echo times (TE) and thus low signal-to-noise ratio (SNR), - all of which limit diagnostic efficacy. Advancements in gradient hardware4–9 enabled probing brain tissue properties at different diffusion time scales at higher SNR10–12, resulting in robust characterisation of key brain tissue properties13–17. Besides, spiral trajectories18 allow for shorter TE than conventional EPI19, resulting in additional SNR increase20. This work demonstrates considerable improvement of prostate DWI by combining 300mT/m gradients for diffusion-encoding21 with spiral readouts for spatial encoding and accounting for field perturbations in the image reconstruction22.Methods
Participants: Ethical approval for the study was obtained. One healthy control (51 yo) and one patient (53 yo, GS 3+3 PCa) were scanned with written consent.Data acquisition: Images were acquired on a 3T Connectom research-only scanner (Siemens Healthcare, Erlangen, Germany).
Multi-echo GRE images were acquired for the estimation of static B0 maps and receive coil sensitivities (voxel size = 3.07 x 3.07 x 5mm3).
A PGSE sequence with the flexibility of using arbitrary readouts ("research sequence") (Fig. 1A) was used to acquire DWI along 15 non-collinear directions distributed on a sphere at b = [0, 0.05, 0.5, 1.5, 2, 3]ms/μm2 (Gmax = 273mT/m, SRmax = 110T/m/s, δ = 5ms, ∆ = 25ms) and TEs of 53 and 35ms for EPI and spiral, respectively, TR = 3s, voxel volume = 1.3 x 1.3 x 5mm3, and 18 slices. EPI and spiral readouts were matched in length and k-space coverage (Fig. 1B.; for both: Gmax = 39.11mT/m, SRmax=186.24T/m/s, for EPI: undersampling factor R = 2, partial Fourier factor = 6/8, phase-encoding = anterior-posterior, and for spiral: R = 2.24). In addition, DWI with the vendor’s PGSE EPI sequence were acquired. Due to limits in the number of samples per segment across sequence implementations, dwell times were: 2.80µs (EPI), 2.70µs (spiral), and 1.6µs (vendor’s EPI). Each DWI protocol took 4 minutes, 45sec.
Structural MRI scans were acquired using a 2D T2-weighted TSE sequence in the axial plane (voxel-size = 0.625 x 0.625 x 3mm3). The magnetic field dynamics were monitored using an NMR field-camera (Skope Magnetic Resonance Technologies)23.
Data reconstruction: The DW EPI data acquired with the vendor’s PGSE sequence were reconstructed using a GRAPPA-based reconstruction (vendor). The data acquired with the research sequence were reconstructed using an expanded encoding model 22,24 (SENSE-based approach)25 including higher order field dynamics (up to 3rd-order spherical harmonics and 2nd-order concomitant fields26,27) and static B0-inhomogeneities (skope-i).
Data processing: Correction of gradient-non-uniformity in images28,29 and B-matrices30.
Analysis: SNR and SNR gain of spiral over EPI was calculated using the 'pseudo multiple replica method'20,31. Mean diffusivity (MD), fractional anisotropy (FA), mean, axial and radial kurtosis (MK,AK and RK) were computed32.
Results
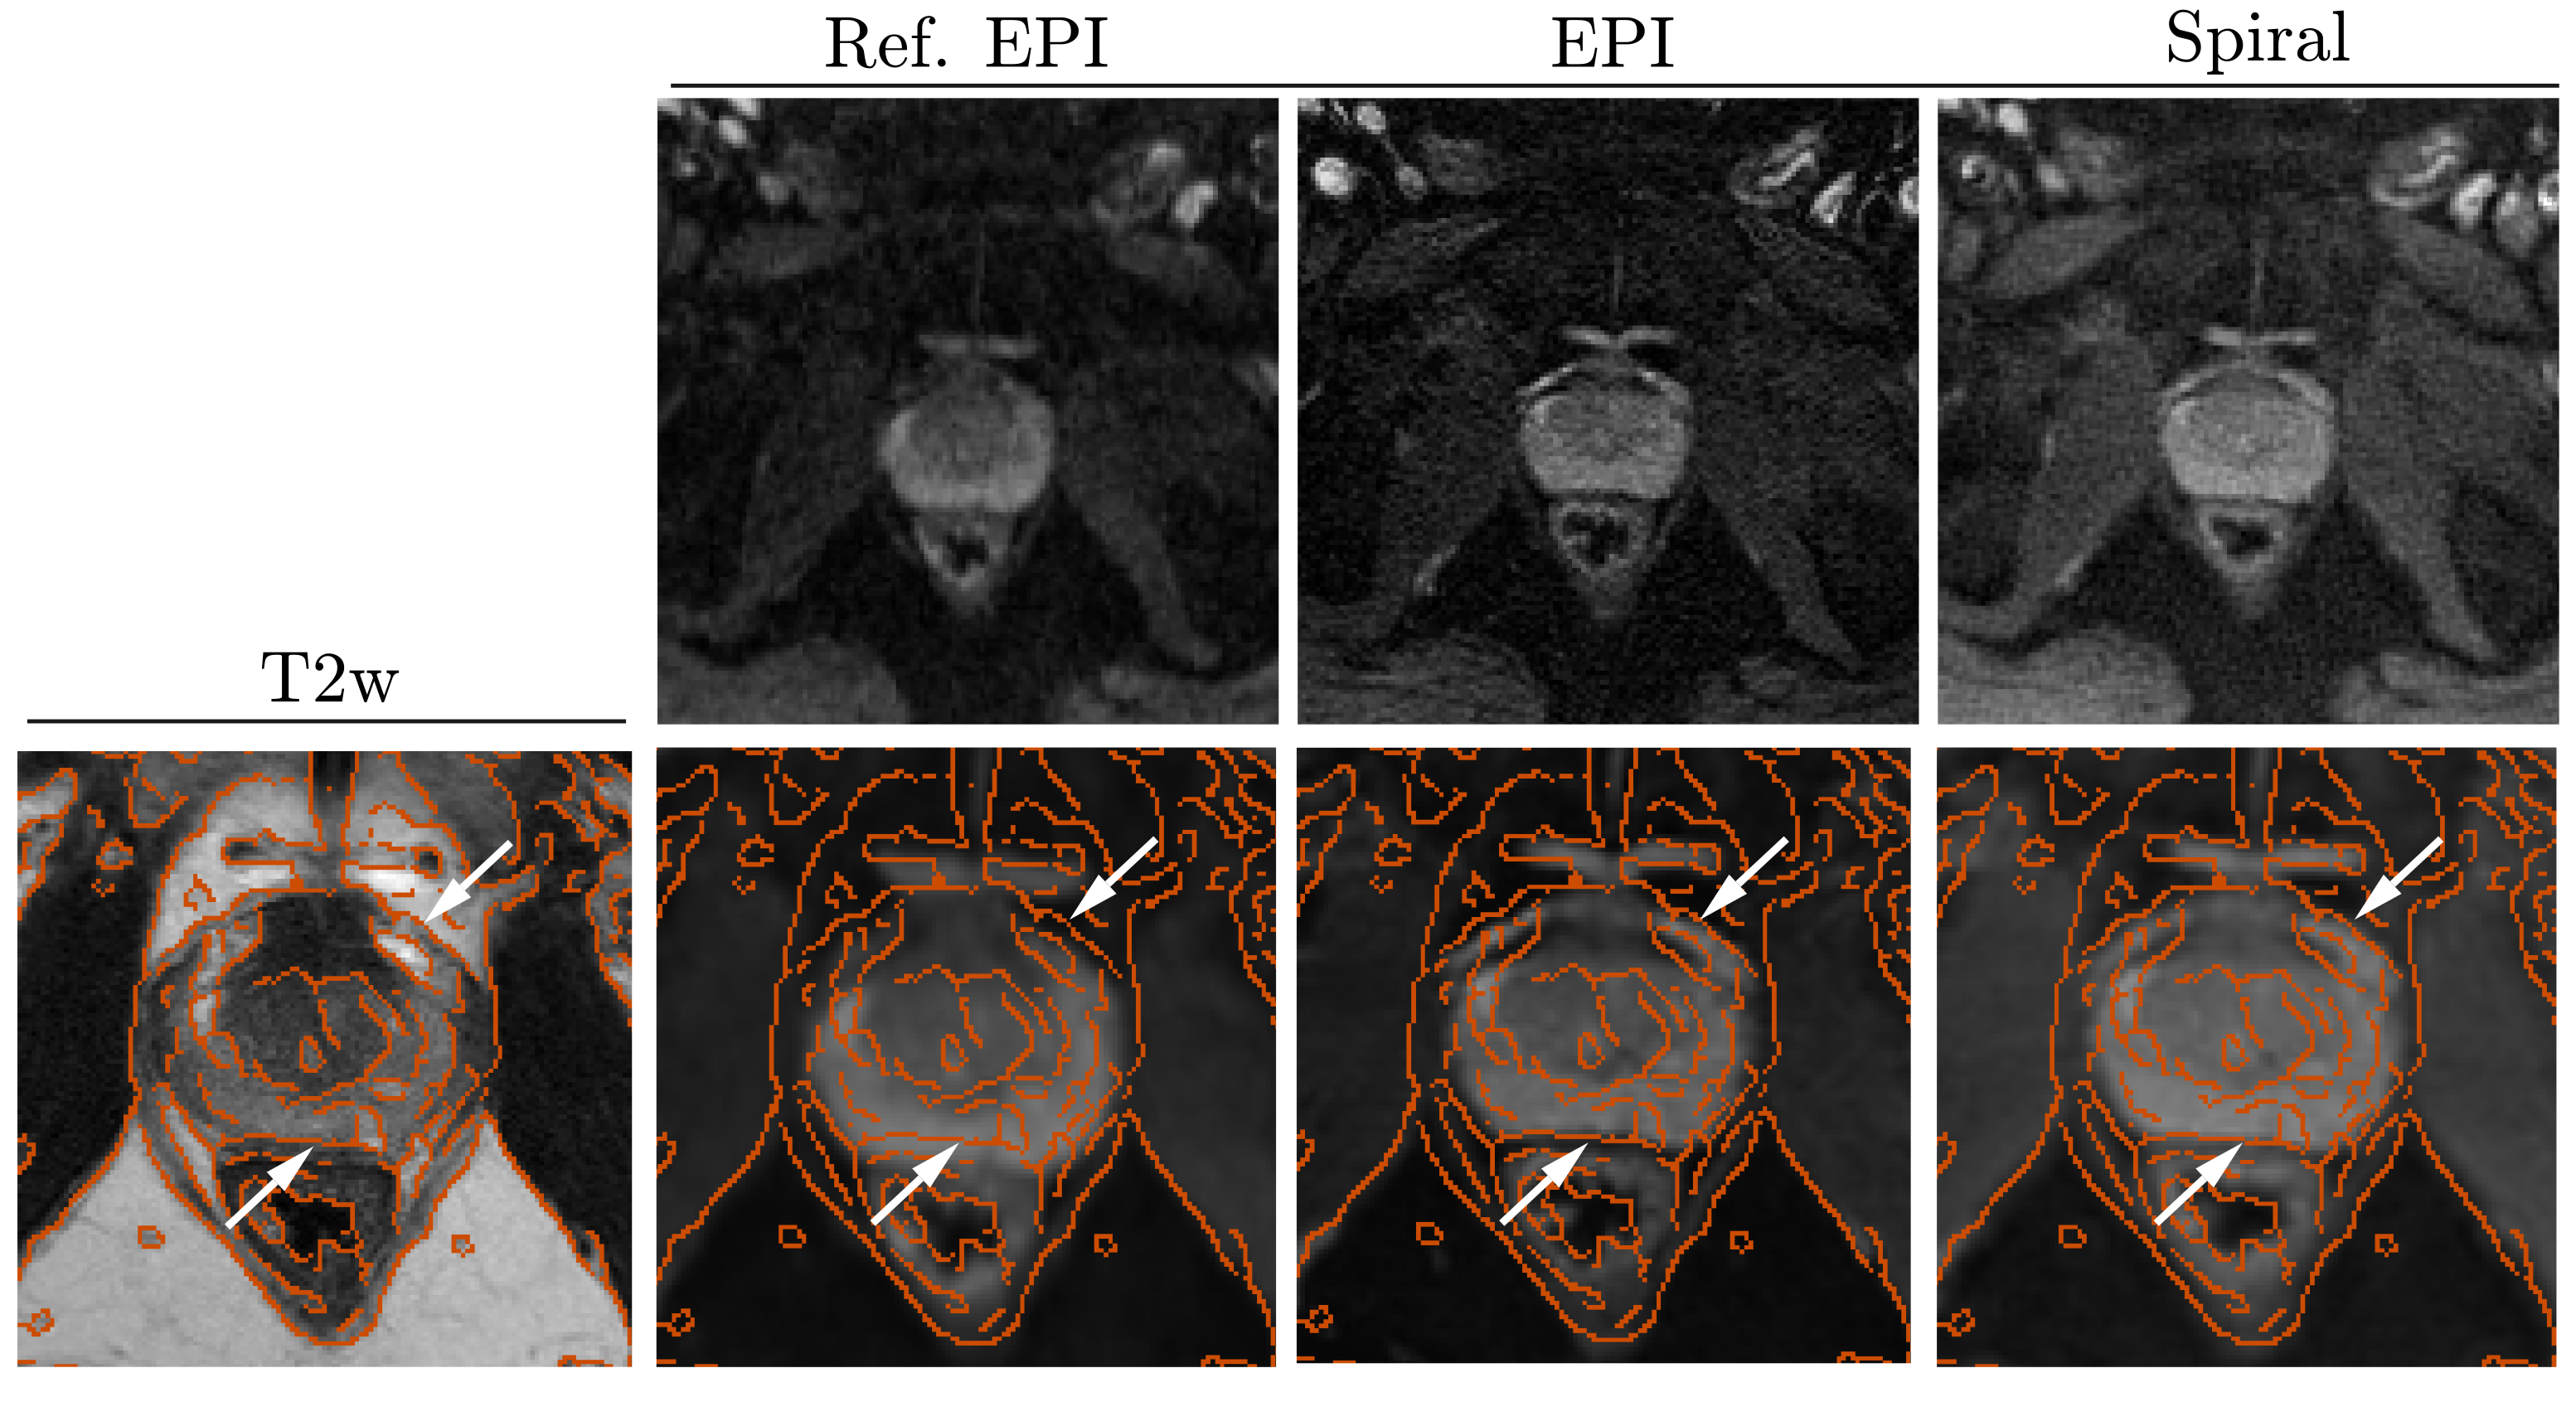
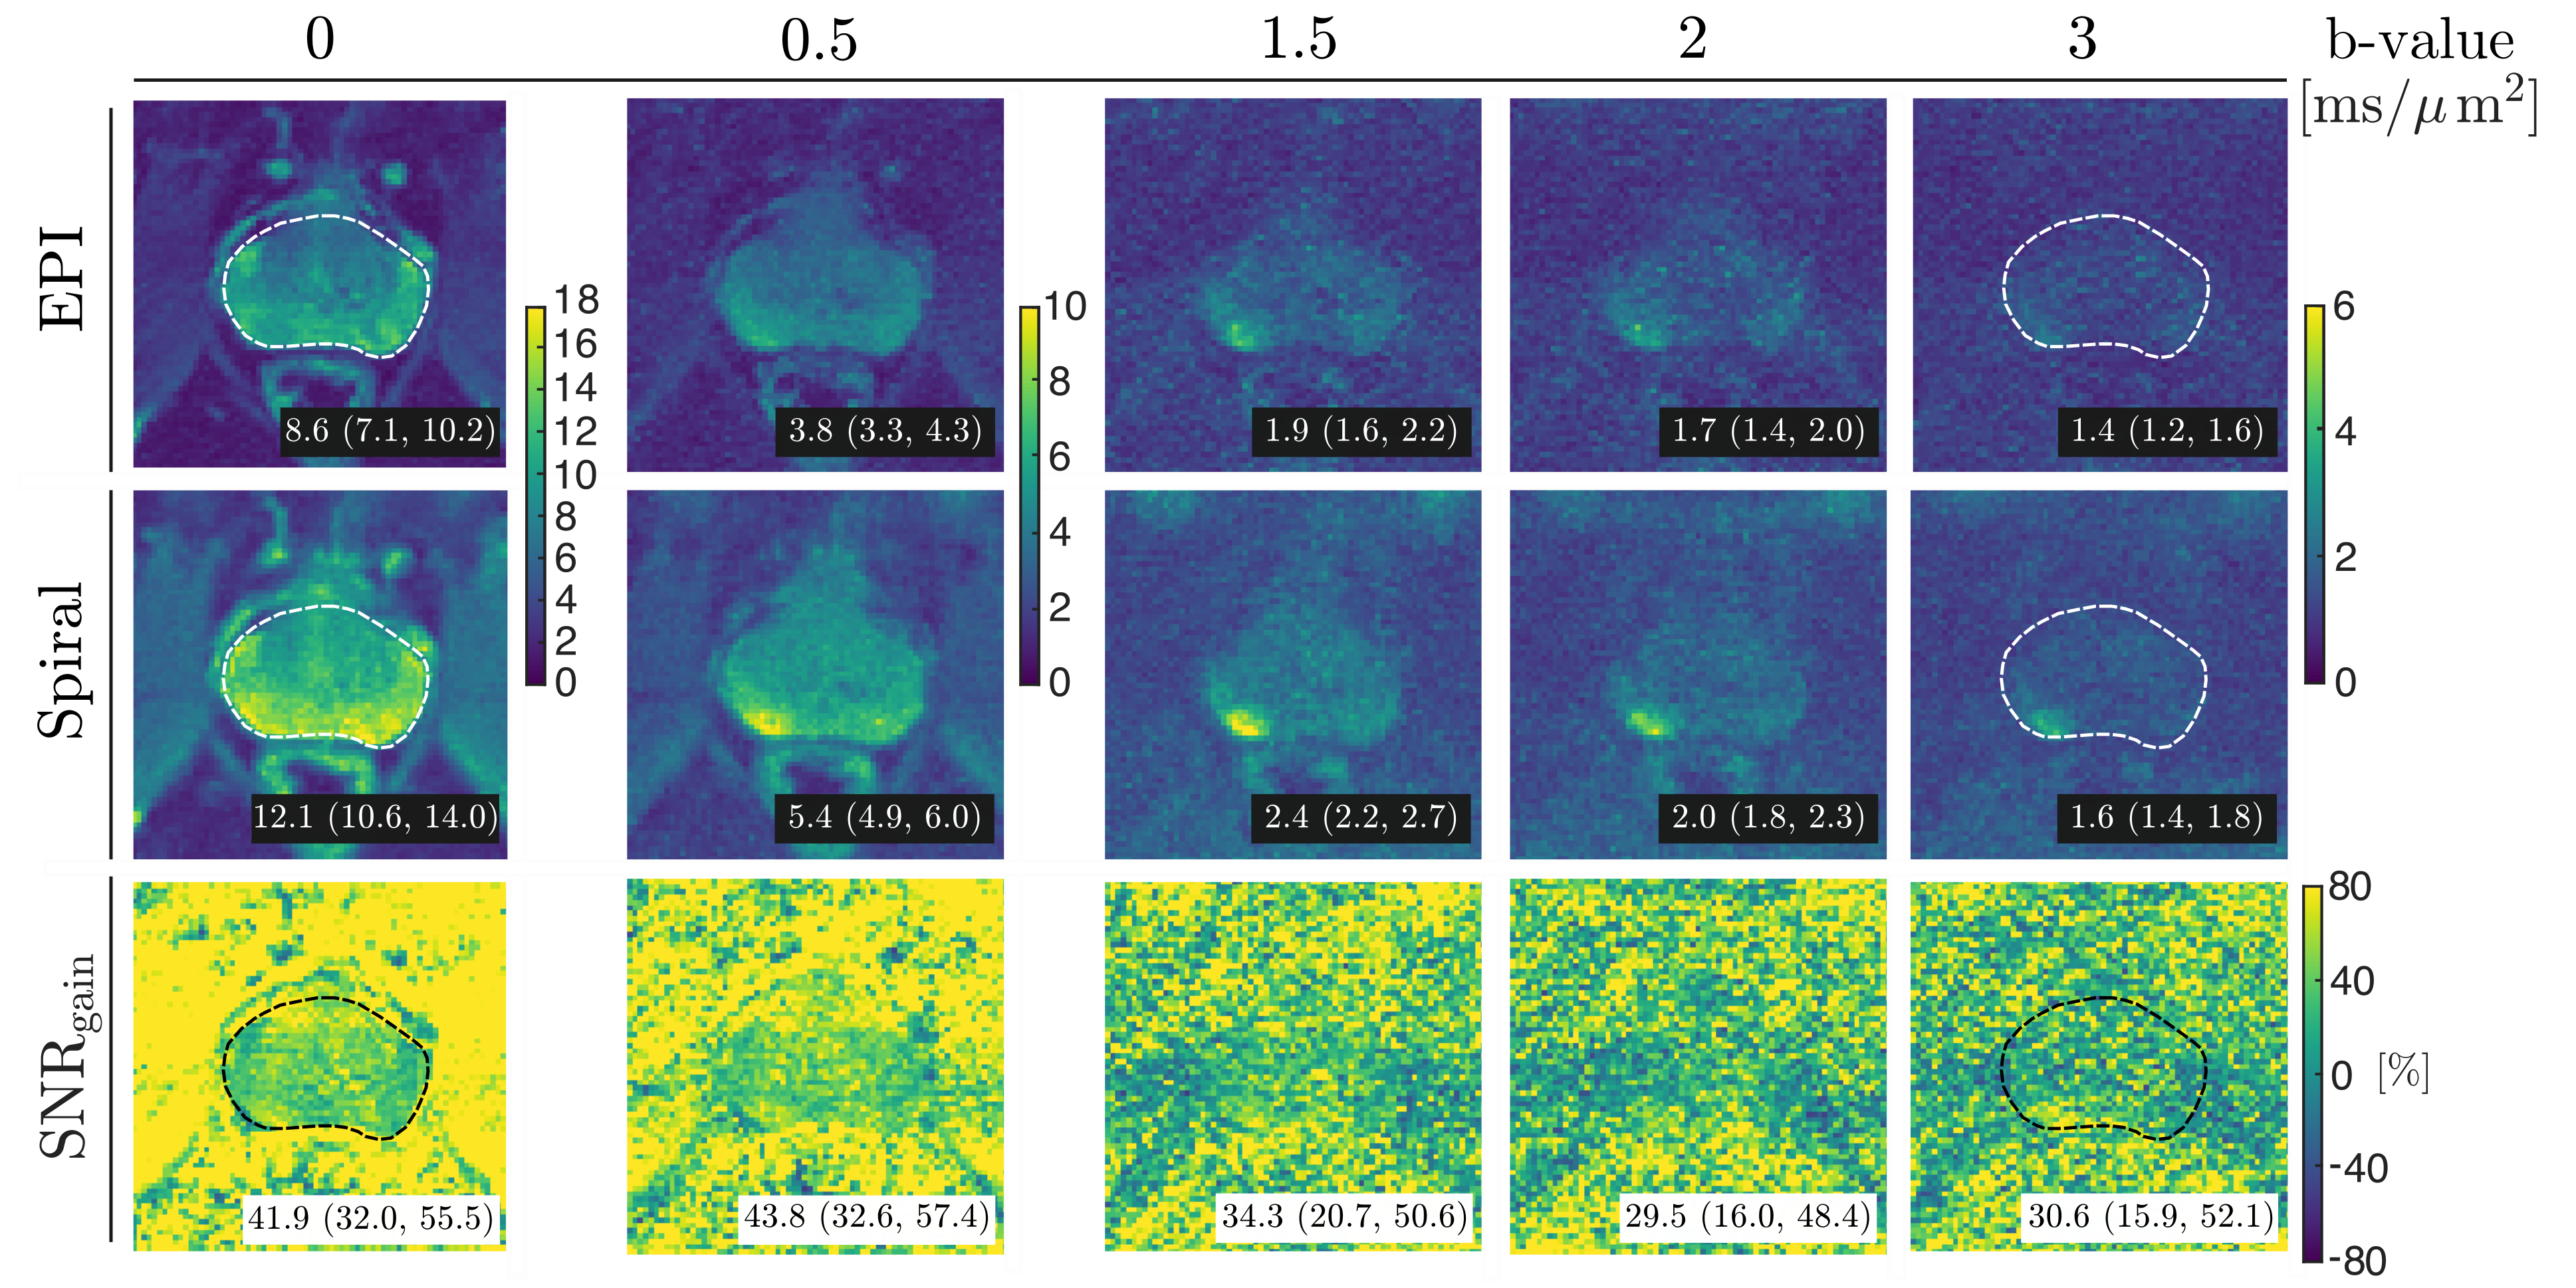
Fig. 2. shows mean b = 0ms/µm2 images. Fine anatomical features are sharper when accounting for measured field perturbations in the reconstruction (2nd and 3rd column) and align better with the morphology in the T2-weighted image.The SNR maps (Fig. 3) confirm that employing the spiral readout as an alternative to EPI results in higher SNR. The median SNRgain ranges between 30% and 44%, depending on the b-value. The SNR gain was even higher in the PCa lesion.
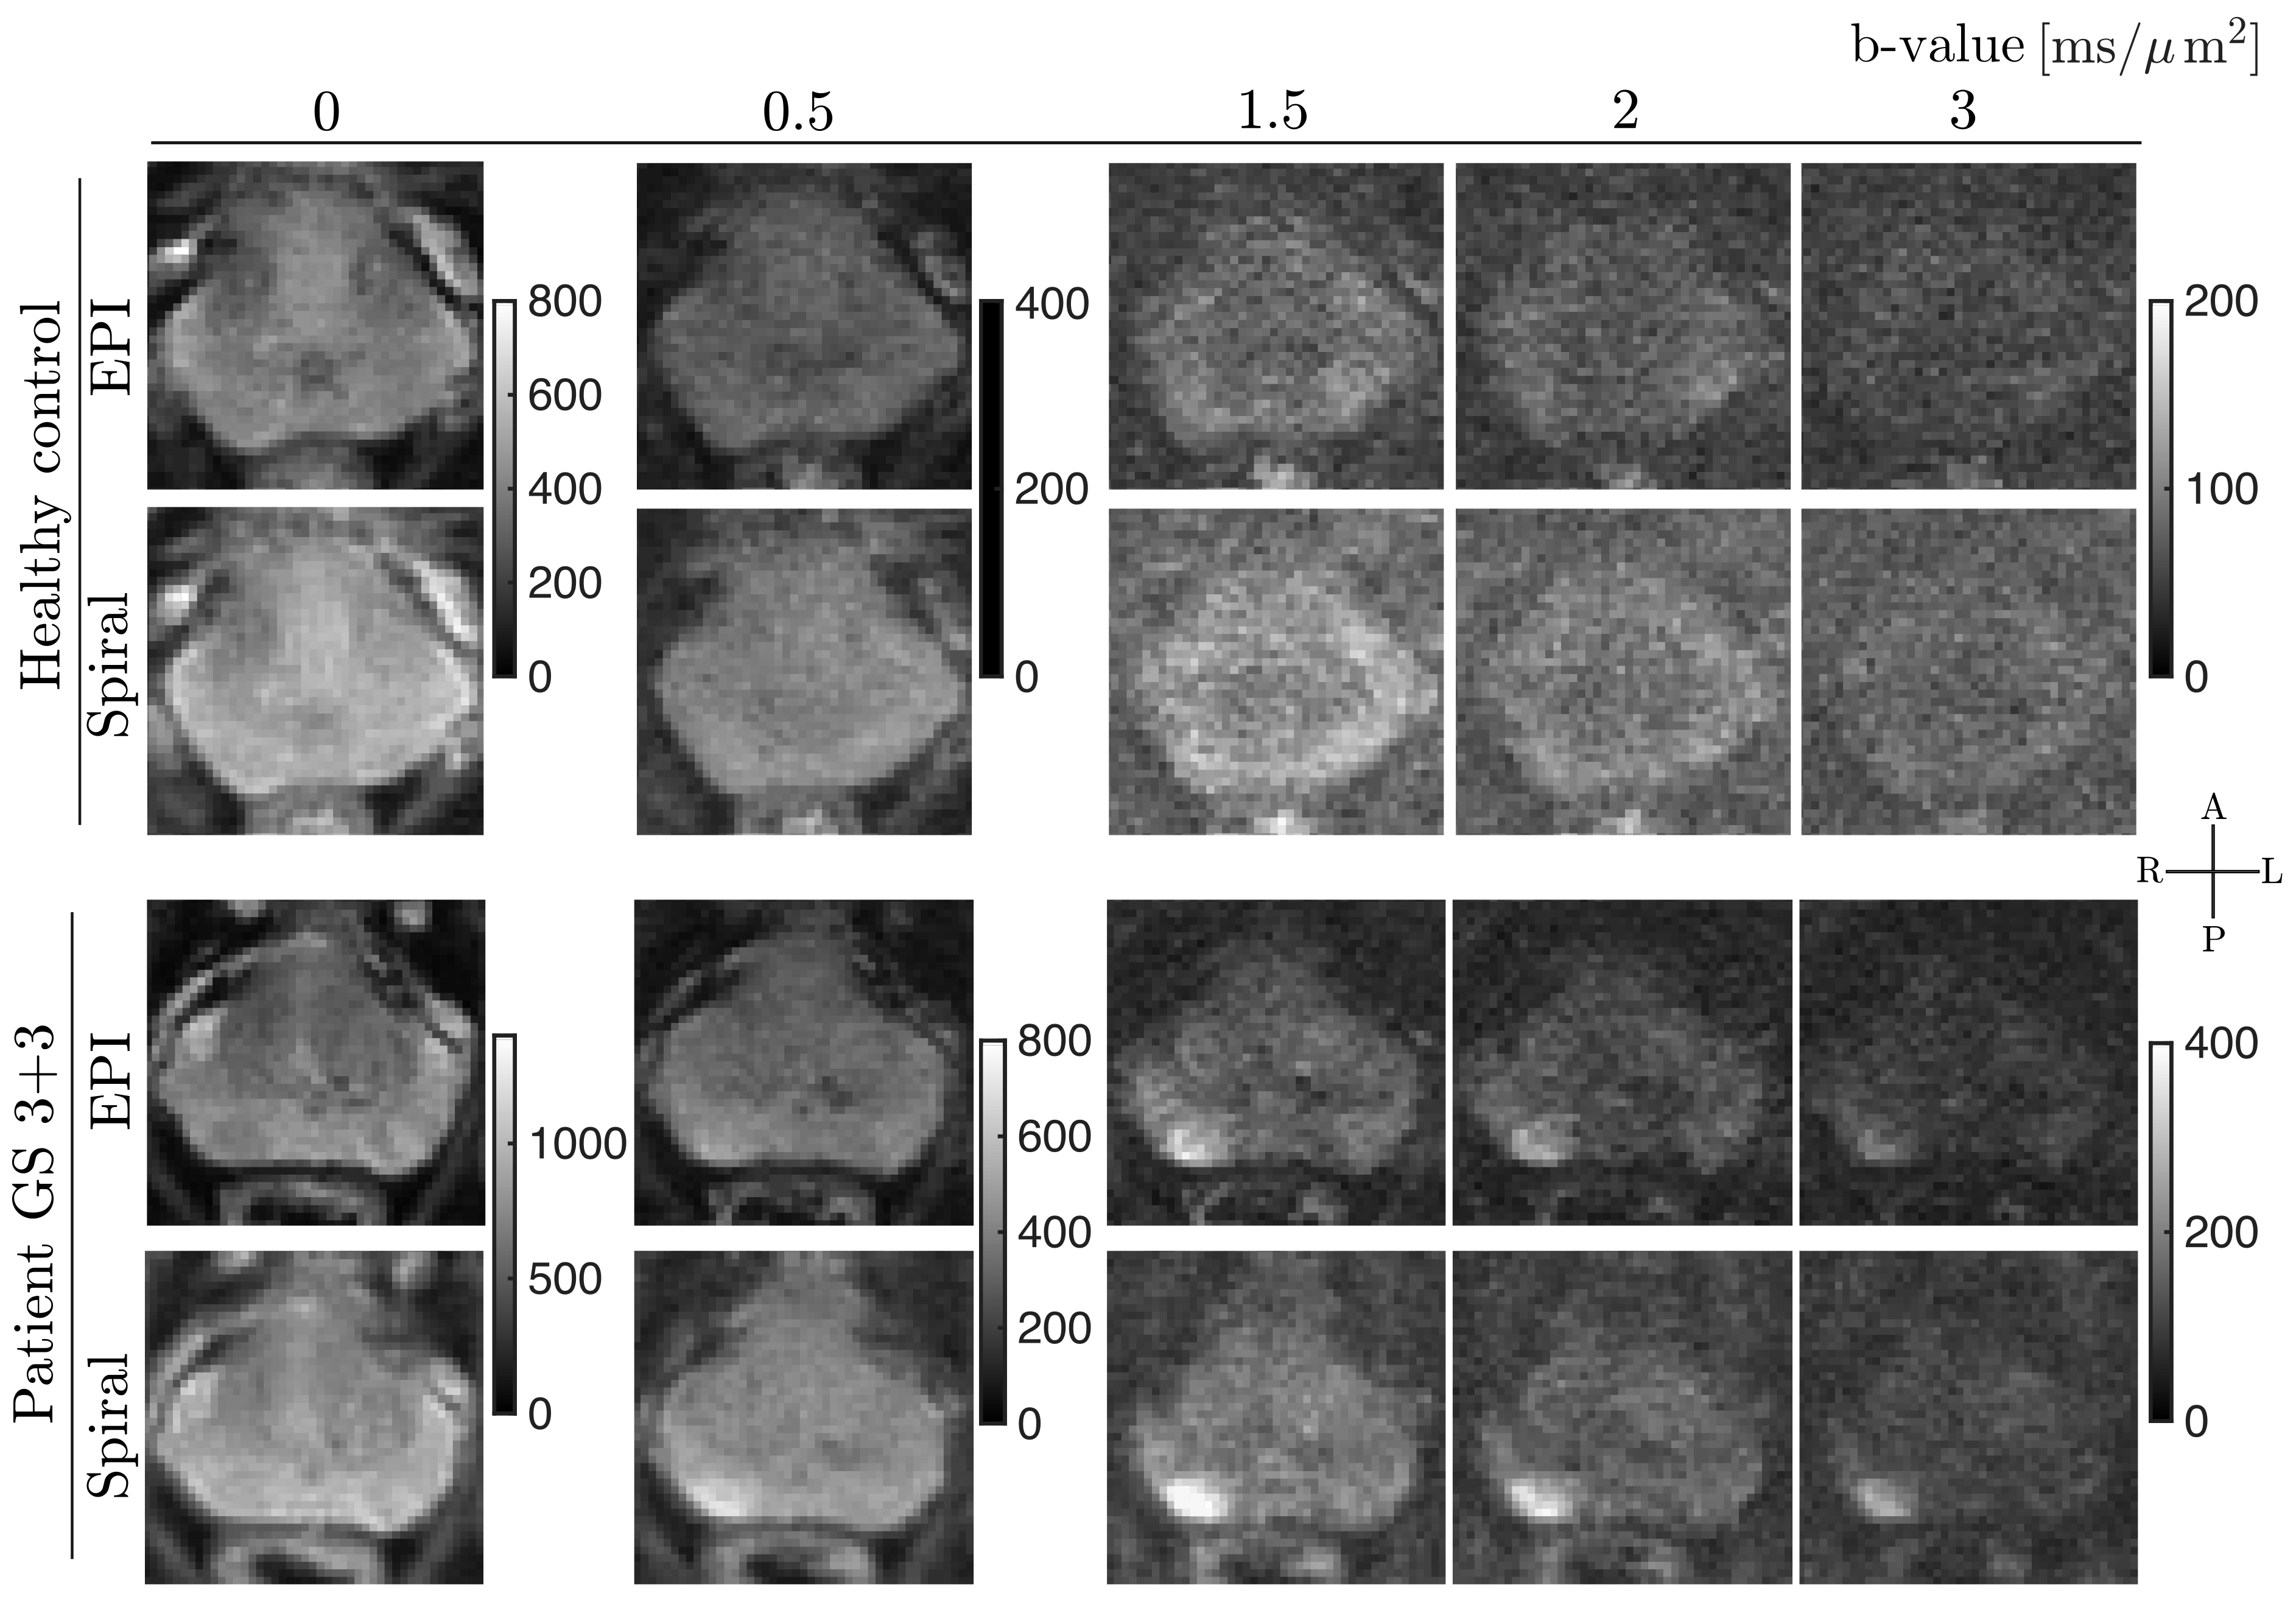
The powder-averaged DW-images for both subjects (Fig. 4) show enhanced tissue-to-background contrast across all b-values in spiral compared to EPI. The conspicuity of cancerous lesions in the PCa patient is improved on high b-value images (4th to 6th column).
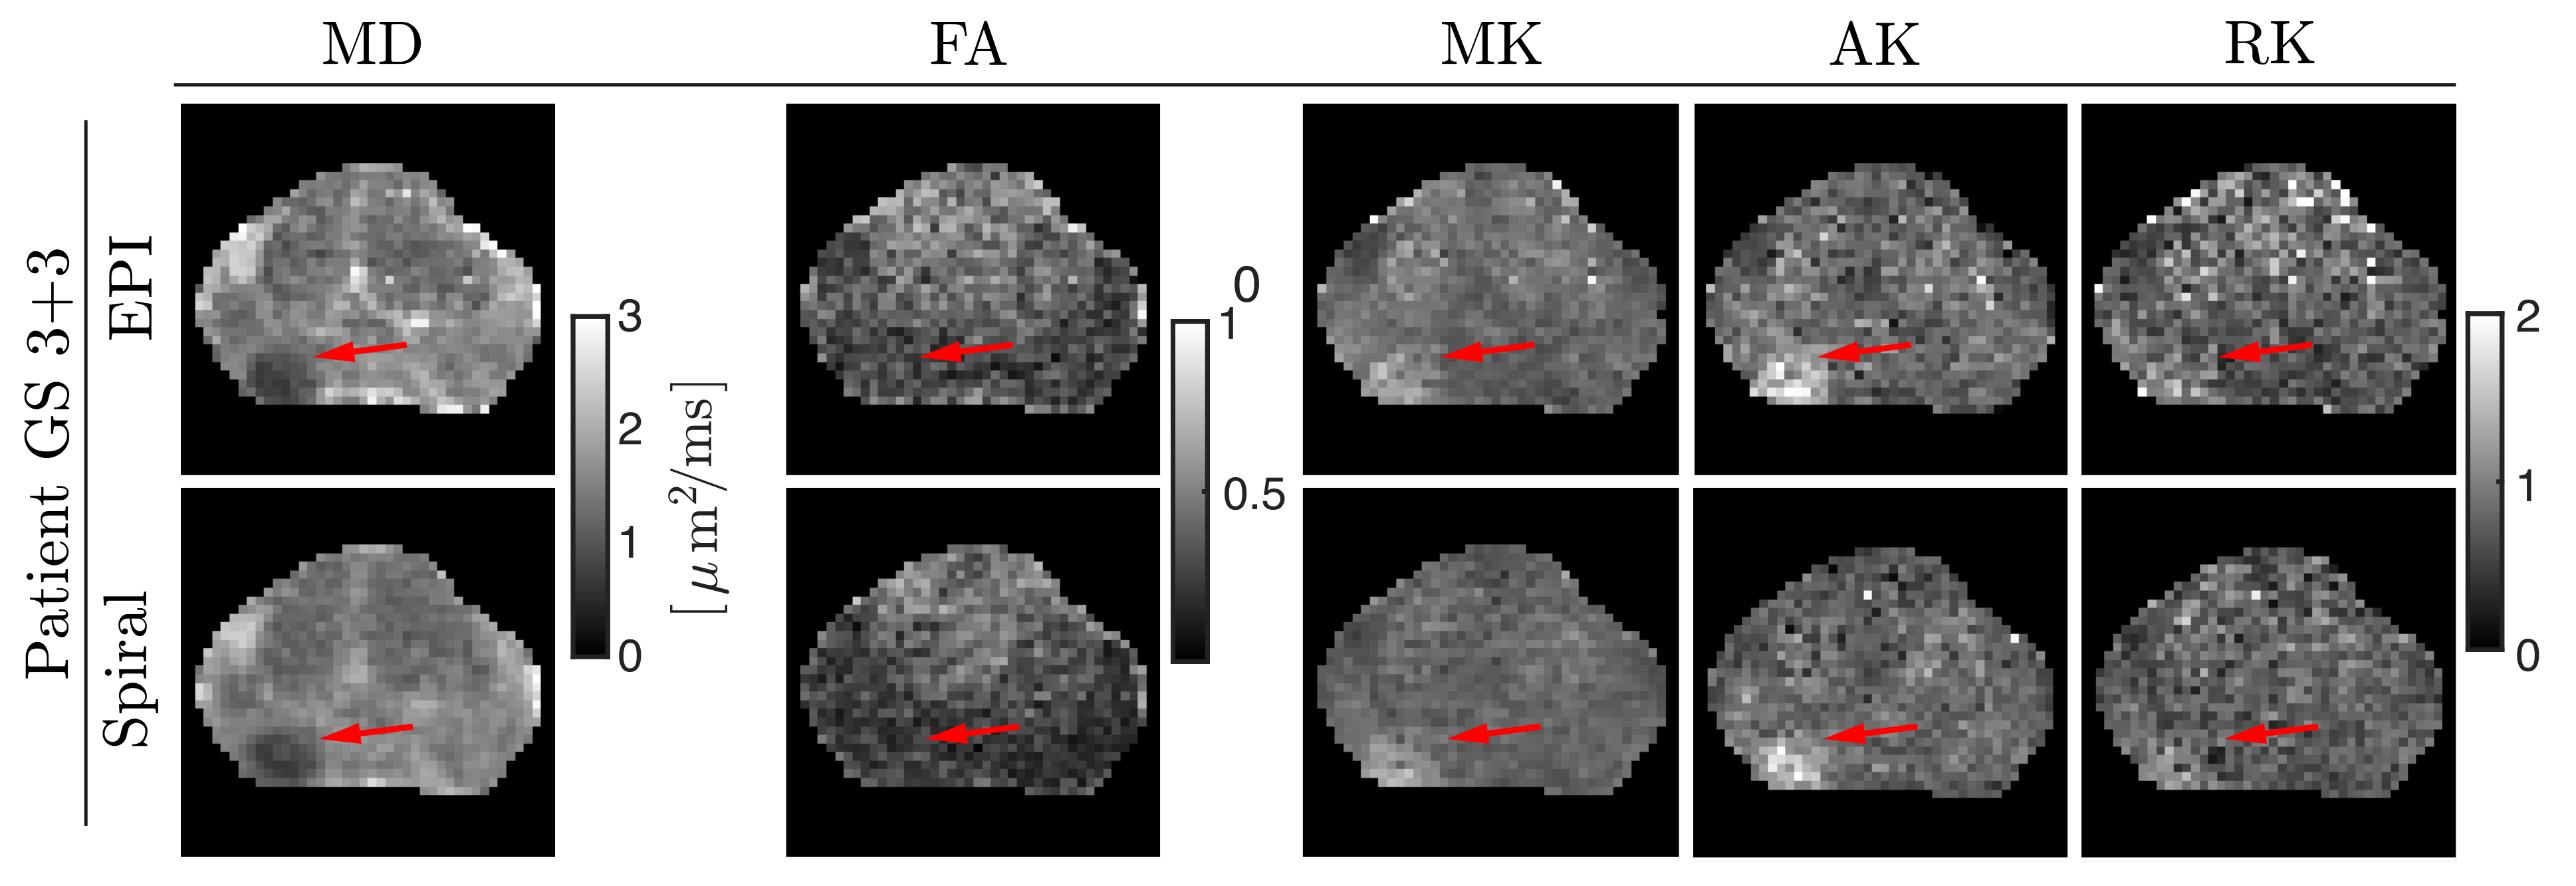
Quantitative maps obtained from DKI (Fig. 5.) show more noise-bias when obtained from dMRI with EPI than with spirals (e.g., elevated MD, higher FA in the transitional zone), but nevertheless excellent conspicuity of the cancerous lesion regardless of the readout employed (lower MD, and higher MK, AK, and, minorly, RK).
Discussion & Conclusions
We devised advanced field sensing and image reconstruction techniques for the prostate. Thereby, we achieved high DWI quality even at high b-values. We deployed these methods for spiral readouts, which provide shorter TEs and thus higher SNR20,33. The combination of strong gradients and spiral readouts unlocks sampling at short diffusion times and short TEs and can potentially lead to improved differentiation between low GS cancer and healthy tissue34,35 and to accurate characterisation of short T2 compartments (e.g., stroma)36. As stronger gradients and alternative readouts become more readily available, they can enable comprehensive characterization of the prostate in multidimensional space36–39.Acknowledgements
This work was supported by a Wellcome Trust Investigator Award (096646/Z/11/Z), a Wellcome Trust Strategic Award (104943/Z/14/Z), an EPSRC equipment grant (EP/M029778/1), and Siemens Healthcare Limited grant to DKJ. CMWT is supported by a Sir Henry Wellcome Fellowship (215944/Z/19/Z) and a Veni grant (17331) from the Dutch Research Council (NWO).
The authors thank Ralph Kimmlingen, Radhouene Neji, Andrew Dewdney, Eva Eberlein and Ludwig Eberler (Siemens Healthineers), Christian Mirkes and Bertram Wilm (Skope Magnetic Resonance Technologies), Filip Szczepankiewicz (Medical Radiation Physics, Lund University), and Kieran Foley MD (School of Medicine, Cardiff University) for technical and scientific support.
References
1. Panagiotaki E, Chan RW, Dikaios N, et al. Microstructural characterization of normal and malignant human prostate tissue with vascular, extracellular, and restricted diffusion for cytometry in tumours magnetic resonance imaging. Invest Radiol. 2015;50(4):218-227. doi:10.1097/RLI.0000000000000115
2. Johnston EW, Bonet-Carne E, Ferizi U, et al. VERDICT MRI for prostate cancer: Intracellular volume fraction versus apparent diffusion coefficient. Radiology. 2019;291(2):391-397. doi:10.1148/RADIOL.2019181749/ASSET/IMAGES/LARGE/RADIOL.2019181749.FIG5.JPEG
3. Singh S, Rogers H, Kanber B, et al. Avoiding Unnecessary Biopsy after Multiparametric Prostate MRI with VERDICT Analysis: The INNOVATE Study. Radiology. 2022;305(3). doi:10.1148/radiol.212536
4. Setsompop K, Kimmlingen R, Eberlein E, et al. Pushing the limits of in vivo diffusion MRI for the Human Connectome Project. Neuroimage. 2013;80:220-233. doi:10.1016/J.NEUROIMAGE.2013.05.078
5. Kimmlingen R. Pioneers of Connectome gradients. MAGENTOM Flash. 2017;68(2):122-136.
6. Foo TKF, Tan ET, Vermilyea ME, et al. Highly efficient head-only magnetic field insert gradient coil for achieving simultaneous high gradient amplitude and slew rate at 3.0T (MAGNUS) for brain microstructure imaging. Magn Reson Med. 2020;83(6):2356-2369. doi:10.1002/MRM.28087
7. Weiger M, Overweg J, Rösler MB, et al. A high-performance gradient insert for rapid and short-T2 imaging at full duty cycle. Magn Reson Med. 2018;79(6):3256-3266. doi:10.1002/MRM.26954/ASSET/SUPINFO/MRM26954-SUP-0001-SUPPINFO.DOCX
8. Versteeg E, van der Velden TA, van Leeuwen CC, et al. A plug-and-play, lightweight, single-axis gradient insert design for increasing spatiotemporal resolution in echo planar imaging-based brain imaging. NMR Biomed. 2021;34(6):e4499. doi:10.1002/NBM.4499
9. Webb AG. Magnetic Resonance Technology: Hardware and System Component Design. Royal Society of Chemistry; 2016.
10. McNab JA, Edlow BL, Witzel T, et al. The Human Connectome Project and beyond: Initial applications of 300 mT/m gradients. Neuroimage. 2013;80:234-245. doi:10.1016/J.NEUROIMAGE.2013.05.074
11. Jones DK, Alexander DC, Bowtell R, et al. Microstructural imaging of the human brain with a ‘super-scanner’: 10 key advantages of ultra-strong gradients for diffusion MRI. Neuroimage. 2018;182:8-38. doi:10.1016/J.NEUROIMAGE.2018.05.047
12. Fan Q, Eichner C, Afzali M, et al. Mapping the human connectome using diffusion MRI at 300 mT/m gradient strength: Methodological advances and scientific impact. Neuroimage. 2022;254:118958. doi:10.1016/J.NEUROIMAGE.2022.118958
13. Tax CMW, Szczepankiewicz F, Nilsson M, Jones DK. The dot-compartment revealed? Diffusion MRI with ultra-strong gradients and spherical tensor encoding in the living human brain. Neuroimage. 2020;210:116534. doi:10.1016/J.NEUROIMAGE.2020.116534
14. Nilsson M, Lasič S, Drobnjak I, Topgaard D, Westin CF. Resolution limit of cylinder diameter estimation by diffusion MRI: The impact of gradient waveform and orientation dispersion. NMR Biomed. 2017;30(7):e3711. doi:10.1002/NBM.3711
15. Veraart J, Nunes D, Rudrapatna U, et al. Noninvasive quantification of axon radii using diffusion MRI. Elife. 2020;9. doi:10.7554/ELIFE.49855
16. Palombo M, Ianus A, Guerreri M, et al. SANDI: A compartment-based model for non-invasive apparent soma and neurite imaging by diffusion MRI. Neuroimage. 2020;215:116835. doi:10.1016/J.NEUROIMAGE.2020.116835
17. Mueller L, Rudrapatna SU, Tax CMW, Wise RG, Jones DK. Diffusion MRI with b=1000 s/mm2 at TE < 22 ms using single-shot spiral readout and ultra-strong gradients: Implications for microstructure imaging. In: ; 2019.
18. Meyer CH, Hu BS, Nishimura DG, Macovski A. Fast Spiral Coronary Artery Imaging. Magn Reson Med. 1992;28(2). doi:10.1002/mrm.1910280204
19. Wilm BJ, Hennel F, Roesler MB, Weiger M, Pruessmann KP. Minimizing the echo time in diffusion imaging using spiral readouts and a head gradient system. Magn Reson Med. 2020;84(6). doi:10.1002/mrm.28346
20. Lee Y, Wilm BJ, Brunner DO, et al. On the signal-to-noise ratio benefit of spiral acquisition in diffusion MRI. Magn Reson Med. 2021;85(4):1924-1937. doi:10.1002/MRM.28554
21. Molendowska M. Diffusion MRI of the Prostate at 300 MT/M. Cardiff University; 2023.
22. Wilm BJ, Nagy Z, Barmet C, et al. Diffusion MRI with concurrent magnetic field monitoring. Magn Reson Med. 2015;74(4):925-933. doi:10.1002/MRM.25827
23. Dietrich BE, Brunner DO, Wilm BJ, et al. A field camera for MR sequence monitoring and system analysis. Magn Reson Med. 2016;75(4):1831-1840. doi:10.1002/MRM.25770
24. Wilm BJ, Barmet C, Pavan M, Pruessmann KP. Higher order reconstruction for MRI in the presence of spatiotemporal field perturbations. Magn Reson Med. 2011;65(6):1690-1701. doi:10.1002/mrm.22767
25. Pruessmann KP, Weiger M, Börnert P, Boesiger P. Advances in sensitivity encoding with arbitrary k-space trajectories. Magn Reson Med. 2001;46(4):638-651. doi:10.1002/MRM.1241
26. Vannesjo SJ, Graedel NN, Kasper L, et al. Image reconstruction using a gradient impulse response model for trajectory prediction. Magn Reson Med. 2016;76(1):45-58. doi:10.1002/MRM.25841/ASSET/SUPINFO/MRM25841-SUP-0001-SUPPINFO01.DOCX
27. Bernstein MA, Zhou XJ, Polzin JA, et al. Concomitant gradient terms in phase contrast MR: Analysis and correction. Magn Reson Med. 1998;39(2):300-308. doi:10.1002/MRM.1910390218
28. Jovicich J, Czanner S, Greve D, et al. Reliability in multi-site structural MRI studies: Effects of gradient non-linearity correction on phantom and human data. Neuroimage. 2006;30(2):436-443. doi:10.1016/J.NEUROIMAGE.2005.09.046
29. Bammer R, Markl M, Barnett A, et al. Analysis and generalized correction of the effect of spatial gradient field distortions in diffusion-weighted imaging. Magn Reson Med. 2003;50(3):560-569. doi:10.1002/MRM.10545
30. Rudrapatna U, Parker GD, Roberts J, Jones DK. A comparative study of gradient nonlinearity correction strategies for processing diffusion data obtained with ultra-strong gradient MRI scanners. Magn Reson Med. 2021;85(2):1104-1113. doi:10.1002/MRM.28464
31. Robson PM, Grant AK, Madhuranthakam AJ, Lattanzi R, Sodickson DK, McKenzie CA. Comprehensive quantification of signal-to-noise ratio and g-factor for image-based and k-space-based parallel imaging reconstructions. Magn Reson Med. 2008;60(4). doi:10.1002/mrm.21728
32. Veraart J, Van Hecke W, Sijbers J. Constrained maximum likelihood estimation of the diffusion kurtosis tensor using a Rician noise model. Magn Reson Med. 2011;66(3):678-686. doi:10.1002/MRM.22835
33. Mueller L, Afzali M, Molendowska M, et al. Boosting the SNR-efficiency of Free Gradient Waveform Diffusion MRI using Spiral Readouts and Ultra-Strong Gradients. In: ; 2021.
34. Molendowska M, Foley K, Palombo M, et al. 300 mT/m diffusion MRI beyond the brain: Probing restricted diffusion in prostate cancer. Published online 2022.
35. Lemberskiy G, Rosenkrantz AB, Veraart J, Taneja SS, Novikov DS, Fieremans E. Time-dependent diffusion in prostate cancer. Invest Radiol. 2017;52(7):405-411. doi:10.1097/RLI.0000000000000356
36. Zhang Z, Wu HH, Priester A, et al. Prostate Microstructure in Prostate Cancer Using 3-T MRI with Diffusion-Relaxation Correlation Spectrum Imaging: Validation with Whole-Mount Digital Histopathology. Radiology. 2020;296(2):348-355. doi:10.1148/RADIOL.2020192330/ASSET/IMAGES/LARGE/RADIOL.2020192330.FIG5B.JPEG
37. Langbein BJ, Szczepankiewicz F, Westin CF, et al. A Pilot Study of Multidimensional Diffusion MRI for Assessment of Tissue Heterogeneity in Prostate Cancer. Invest Radiol. 2021;56(12):845-853. doi:10.1097/RLI.0000000000000796
38. Chatterjee A, Bourne RM, Wang S, et al. Diagnosis of prostate cancer with noninvasive estimation of prostate tissue composition by using hybrid multidimensional MR imaging: A feasibility study. Radiology. 2018;287(3):863-873. doi:10.1148/radiol.2018171130
39. Lemberskiy G, Fieremans E, Veraart J, Deng FM, Rosenkrantz AB, Novikov DS. Characterization of prostate microstructure using water diffusion and NMR relaxation. Front Phys. 2018;6(SEP):91. doi:10.3389/FPHY.2018.00091/BIBTEX
40. Heid O. Robust EPI phase correction. Proc 5th Annu Meet ISMRM. 1997;(November).
Figures
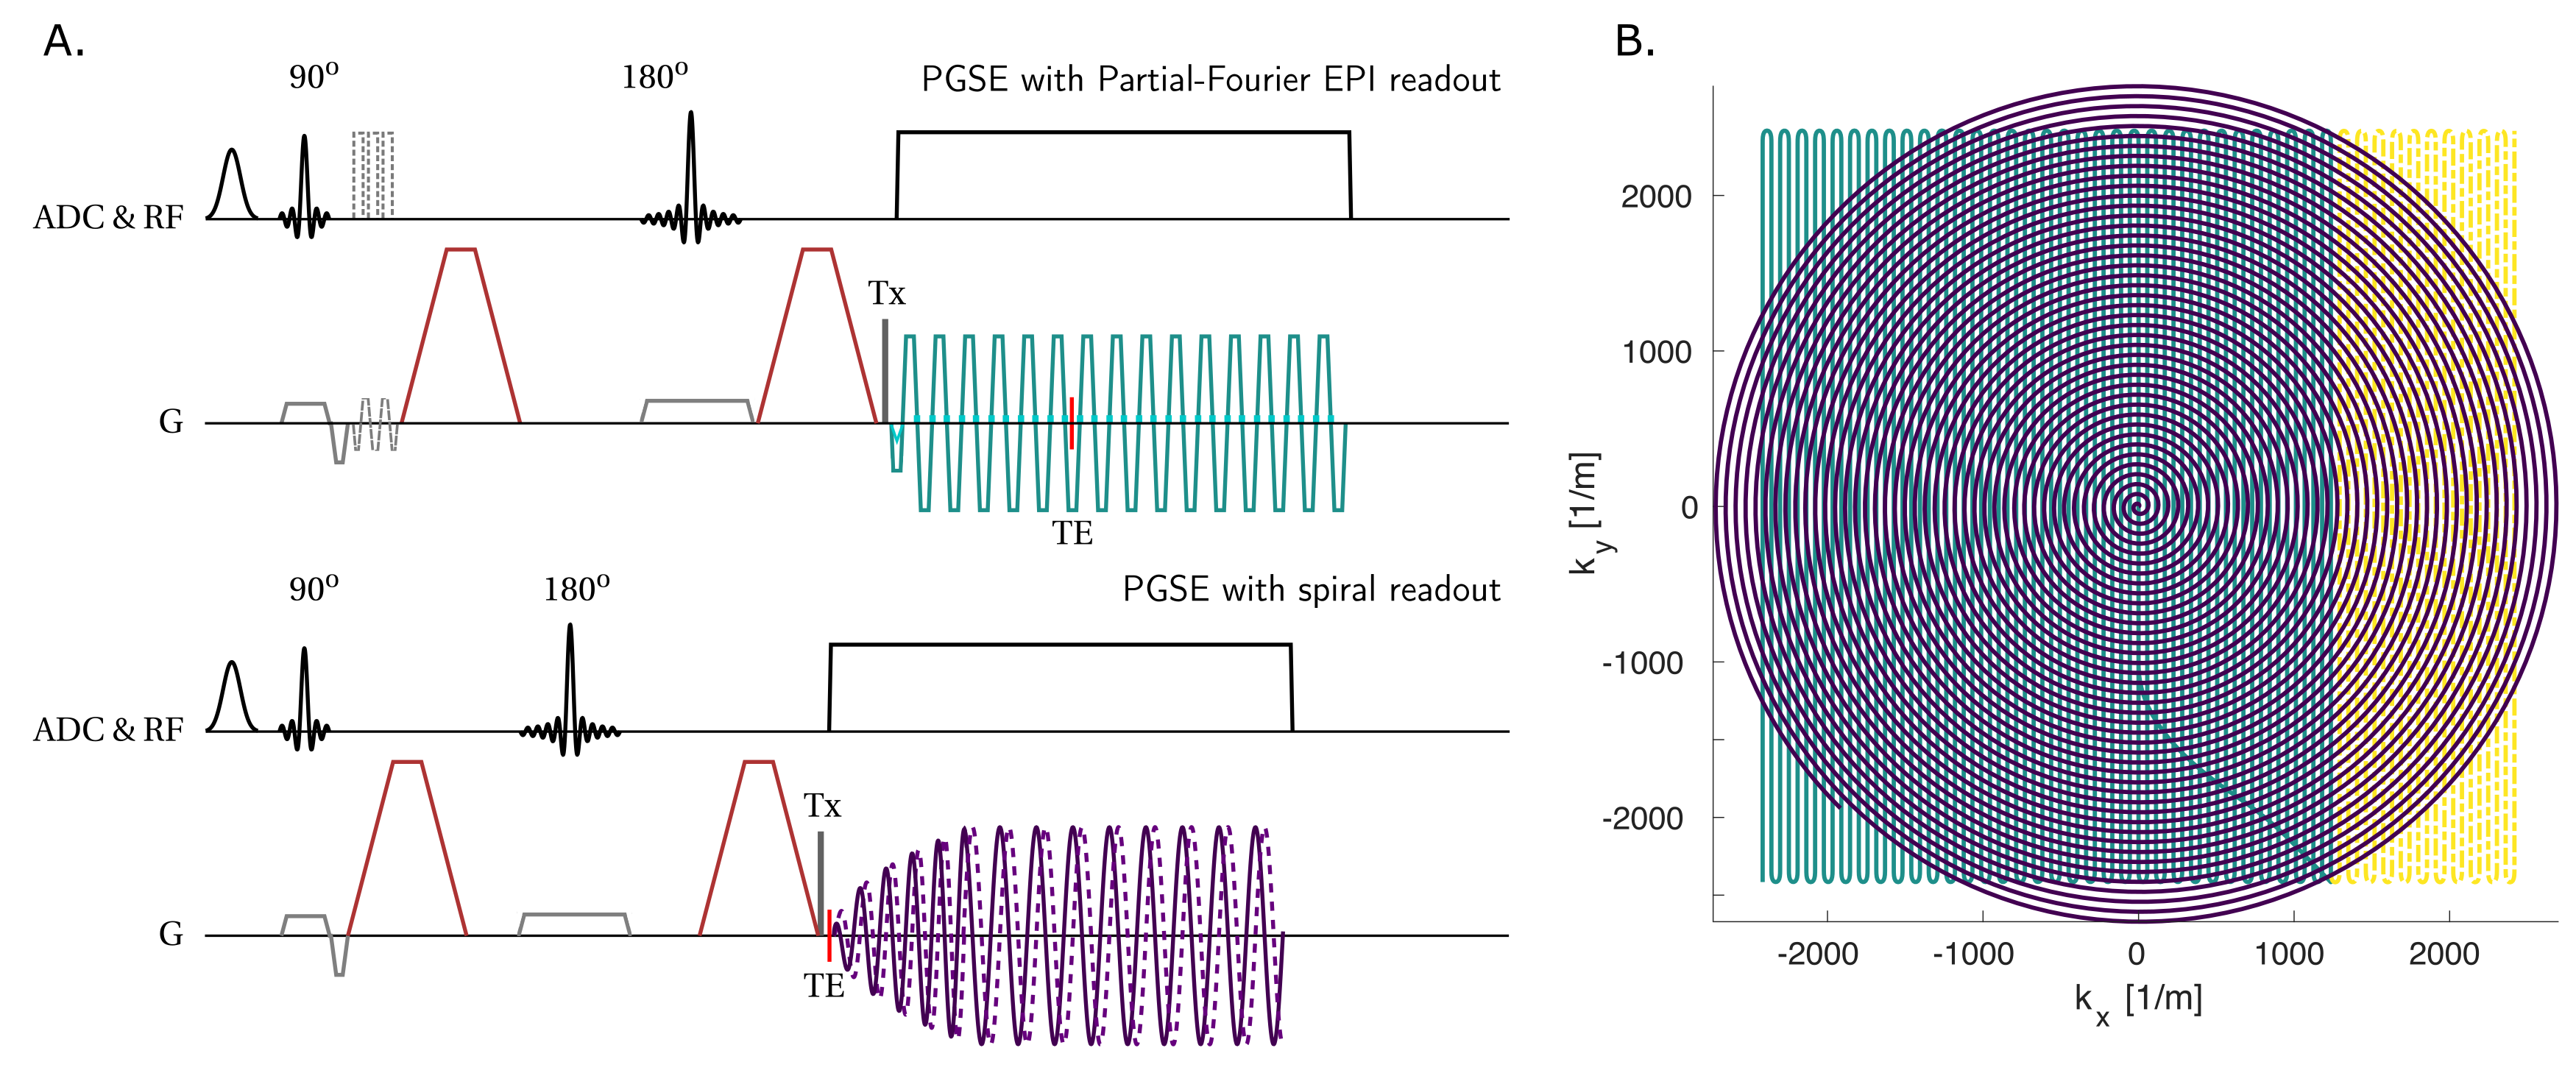
Figure 1:
A) Sketch of the research-purpose PGSE sequences: Single-shot PF EPI and single-shot spiral. The vendor’s sequence has additional navigators for phase correction40 (light grey dashed lines). ADC & RF: Spectral fat saturation, excitation and refocusing pulses and ADC. G: Slice selective and refocusing (light grey), diffusion (maroon), and readout gradients (EPI and spiral in teal and violet, respectively), trigger for dynamic field camera (Tx, dark grey).
B) Parametric view of readout trains with matched k-space area (teal + yellow areas = purple area).