1013
A Data-Driven Subspace Reconstruction for Distortion-Free Diffusion-Relaxometry Echo Planar Time-Resolved Imaging1Department of Radiology, Stanford University, Stanford, CA, United States
Synopsis
Keywords: Diffusion Reconstruction, Relaxometry
Motivation: The subspace-based reconstruction is an SNR-efficient approach for distortion-free diffusion-relaxometry MRI with highly under-sampled echo-planar time-resolved acquisition (EPTI), in which the needed bases can be estimated from simulations. However, the simulations may not be able to fully capture the signal evolution in complex human tissue.
Goal(s): To improve the subspace-based EPTI reconstruction by estimating the bases from acquired calibration data.
Approach: The efficacy of the new data-driven subspace reconstruction was evaluated with in vivo EPTI experiments.
Results: High-resolution, under-sampled EPTI images are reliably reconstructed using the data-driven subspace reconstruction.
Impact: Our study presents a new data-driven approach for estimating the bases for the subspace-based echo-planar time-resolved imaging (EPTI) reconstruction, which may better reflect the underlying microstructure than the numerical simulation and further facilitate studies with diffusion-relaxometry MRI.
Purpose
Echo-planar time-resolved imaging (EPTI) is a valuable tool for brain microstructure detection by generating a series of distortion-free diffusion and relaxometry images 1-6. Recently, subspace reconstructions have been developed as an SNR-efficient approach to reconstruct highly under-sampled EPTI data 4-8. A critical step in the subspace reconstruction is to generate the subspace bases, which can be estimated by simulating the relaxometry process with varying parameters (T2, T2*, ∆B0) and then extracting the bases from the simulated signal. However, the human tissue components and microstructures are very complex and may not be fully captured by the numerical simulation. In this study, we will explore a data-driven subspace-based EPTI reconstruction, by estimating bases from acquired calibration data.Methods
Data acquisition.Data were acquired on a GE 3.0T Premier MRI scanner, equipped with a 48-channel head coil. Low-resolution fully sampled EPTI scans without (b=0) and with (matched b-values as the to-be-reconstructed high-resolution EPTI scan and applied in x/y/z directions) diffusion encoding were conducted as a calibration scan to estimate the needed subspace bases (Fig.1A), similar to Ref. 8. A navigator was acquired at the end of each readout to record the physiological motion-induced phase (Pi) of each shot. The b=0 calibration scan was also used to estimate the coil sensitivity map (Sj) and the B0 inhomogeneity-induced phases at each TEk (PB0, k). The high-resolution diffusion-prepared EPTI was highly under-sampled with only 4 shots and denser sampling was deployed around ky=0 to generate the navigator to facilitate the inter-shot phase correction and subspace reconstruction (Fig.1B). The TE of the spin echo (TESE) was set at the 1st readout (Fig.1B and 1C). Detailed imaging parameters are shown in Table 1.
Experiment 1: A multi-shell acquisition was conducted to test the diffusion-dependent relaxometry estimation and the TE-dependent diffusion estimation.
Experiment 2: To test the universality of the data-driven bases, we reconstructed the high-resolution EPTI data of one subject with the bases estimated from calibration scans of the same and a different subject with matched scan parameters (TEs, TR, Nk, b-value).
Basis estimation.
The basis estimation pipeline is shown in Fig.2A-2C. The low-resolution b=0 and diffusion calibration data were reconstructed with Tikhonov and locally low-rank (LLR) constraints, which is reasonable given the low under-sampling factor or no under-sampling in the calibration scan (Rnet=1). The reconstructed b=0 and diffusion calibration images were decomposed by principal component analysis (PCA) to generate the needed magnitude subspace bases (Nm=4 bases were used here).
Subspace reconstruction.
The estimated bases were fed into the subspace reconstruction (Fig.2D-2F):
$$\underset{\mathbf{c}}{\mathrm{min}}\left|\left|\textbf{G}_{\mathit{i}}\textbf{F}\textbf{S}_{\mathit{j}}\textbf{P}_{\mathrm{B_{0}},\mathit{k}}\textbf{P}_{\mathrm{bias}}\textbf{P}_{\mathit{i}}\mathbf{\phi}\mathbf{c}-\textbf{d}_{\mathit{i,j,k}}\right|\right|^{2}+\lambda\left|\left|R\left(\mathbf{c}\right)\right|\right|_{*}$$
where the first term is data consistency and the second term is LLR regularization onc, λ is the regularization parameter, ϕ (Nk×Nm, with Nm≪Nk) is the bases, c (Nm×1) is the coefficients, di,j,k is the k-space data at TEk, Pbias is the phase bias from dynamic B0 drift and eddy current, Pi is the motion-induced phase, PB0,k is the B0 inhomogeneity induced phase at different TEk, Sj is the sensitivity map, F is Fourier transform, Gi is the under-sampling operator of each shot, i, j, k, and m are the indices for shot, coil, TE, and basis, respectively. The subspace reconstruction was implemented using the alternating direction method of multipliers (ADMM) algorithm 9 and Pbias was updated during the iterations.
Results
Fig.3 shows the high-quality reconstruction results of Experiment 1, including (A-C) mean images of b=0, 1, and 2 ms/μm2 at the shortest (TE=50 ms) and longest TEs (TE=103 ms), and the T2* maps.Fig.4 displays the directionally-encoded color (DEC) maps and the line representation of the principal and 2nd fiber orientations estimated from BedpostX10 in a selected ROI (red box) in 7 different TE groups. Gradual, consistent changes in the 2nd fiber orientations (red arrowheads) are observed over different TEs, which may be indicative of the presence of microstructural components with different T2*.
Fig.5 shows good agreement between the reconstruction with bases estimated from calibration data of the same subject, a different subject, and both subjects. Images reconstructed with the simulated bases show more discrepancy compared to those with bases from acquired data.
Discussion & Conclusion
As a proof-of-concept, we demonstrate the efficacy of a data-driven subspace reconstruction method for distortion-free diffusion-relaxometry EPTI. The data-driven subspace basis estimation does not make strong assumptions about the relaxometry process, which is particularly important for regions with complex components and microstructures and may allow more accurate estimation of microstructural information. This universality test indicates that bases can be estimated from a few pre-calibration scans and do not need to be repeated on each subject, which may further improve the scan efficiency.Acknowledgements
We thank the funding support from GE Healthcare, NIH R01NS095985, and NIH K99AG080076.
References
1. Wang F, Dong Z, Reese TG, et al. Echo planar time-resolved imaging (EPTI). Magn Reson Med 2019;81:3599-3615.
2. Fair MJ, Liao C, Manhard MK, et al. Diffusion-PEPTIDE: Distortion- and blurring-free diffusion imaging with self-navigated motion-correction and relaxometry capabilities. Magn Reson Med 2021;85:2417-2433.
3. Dai E, Lee PK, Dong Z, et al. Distortion-Free Diffusion Imaging Using Self-Navigated Cartesian Echo-Planar Time Resolved Acquisition and Joint Magnitude and Phase Constrained Reconstruction. IEEE Trans Med Imaging 2022;41:63-74.
4. Dong Z, Wang F, Reese TG, et al. Echo planar time-resolved imaging with subspace reconstruction and optimized spatiotemporal encoding. Magn Reson Med 2020;84:2442-2455.
5. Dong Z, Wang F, Chan KS, et al. Variable flip angle Echo Planar Time-Resolved Imaging (vFA-EPTI) for fast high-resolution gradient echo myelin water imaging. Neuroimage 2021117897.
6. Dong Z, Wang F, Wald L, et al. SNR-efficient distortion-free diffusion relaxometry imaging using accelerated echo-train shifted echo-planar time-resolving imaging (ACE-EPTI). Magn Reson Med 2022.
7. Tamir JI, Uecker M, Chen W, et al. T2 shuffling: Sharp, multicontrast, volumetric fast spin-echo imaging. Magn Reson Med 2017;77:180-195.
8. Lam F, Liang ZP. A subspace approach to high-resolution spectroscopic imaging. Magn Reson Med 2014;71:1349-1357.
9. Boyd S. Distributed Optimization and Statistical Learning via the Alternating Direction Method of Multipliers. Foundations and Trends® in Machine Learning 2010;3:1-122.
10. Jbabdi S, Sotiropoulos SN, Savio AM, et al. Model-based analysis of multishell diffusion MR data for tractography: How to get over fitting problems. Magnetic Resonance in Medicine 2012;68:1846-1855.
Figures
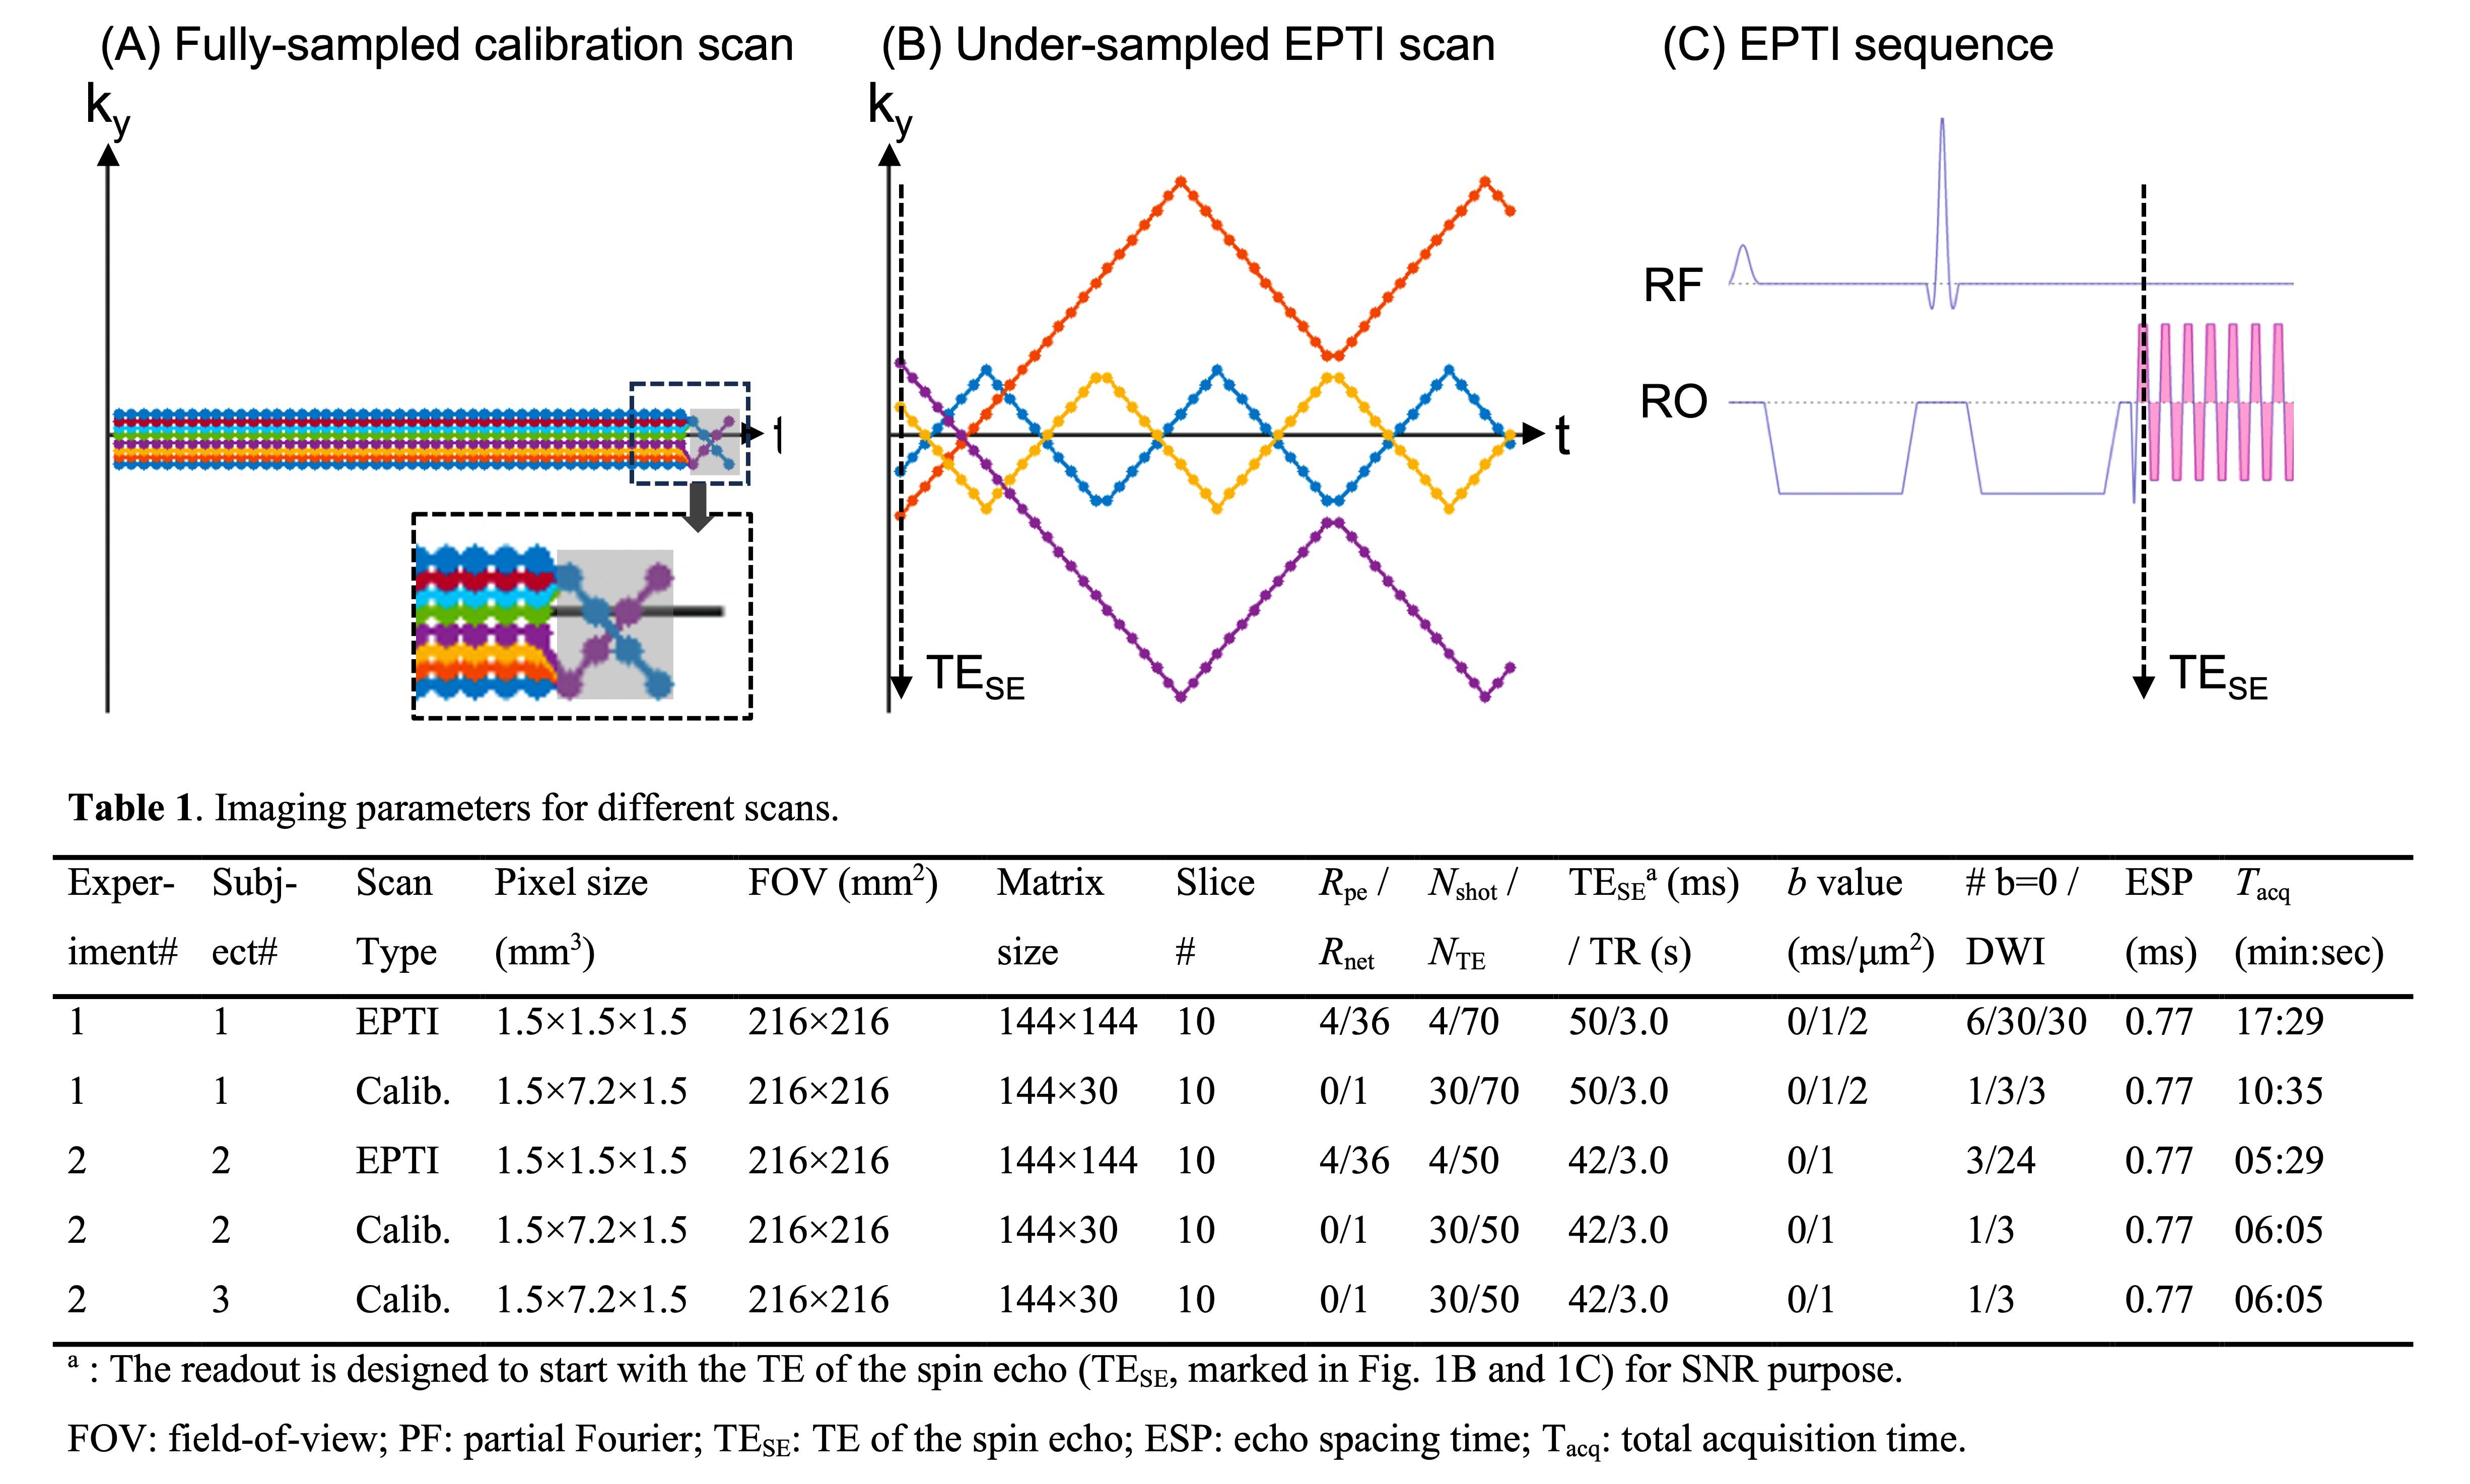
Figure 1. (A) The sampling trajectory of the fully sampled low-resolution calibration scan. A navigator is acquired at the end of the readout (in gray). The phase encoding polarity of the navigator is dependent on the ky location of the last image-echo. (B) The sampling trajectory and (C) sequence of the under-sampled high-resolution EPTI scan. The sampling is denser at ky~0 for the inter-shot phase correction and subspace reconstruction. TESE is marked in (B) and (C). Table 1. Detailed scan parameters.
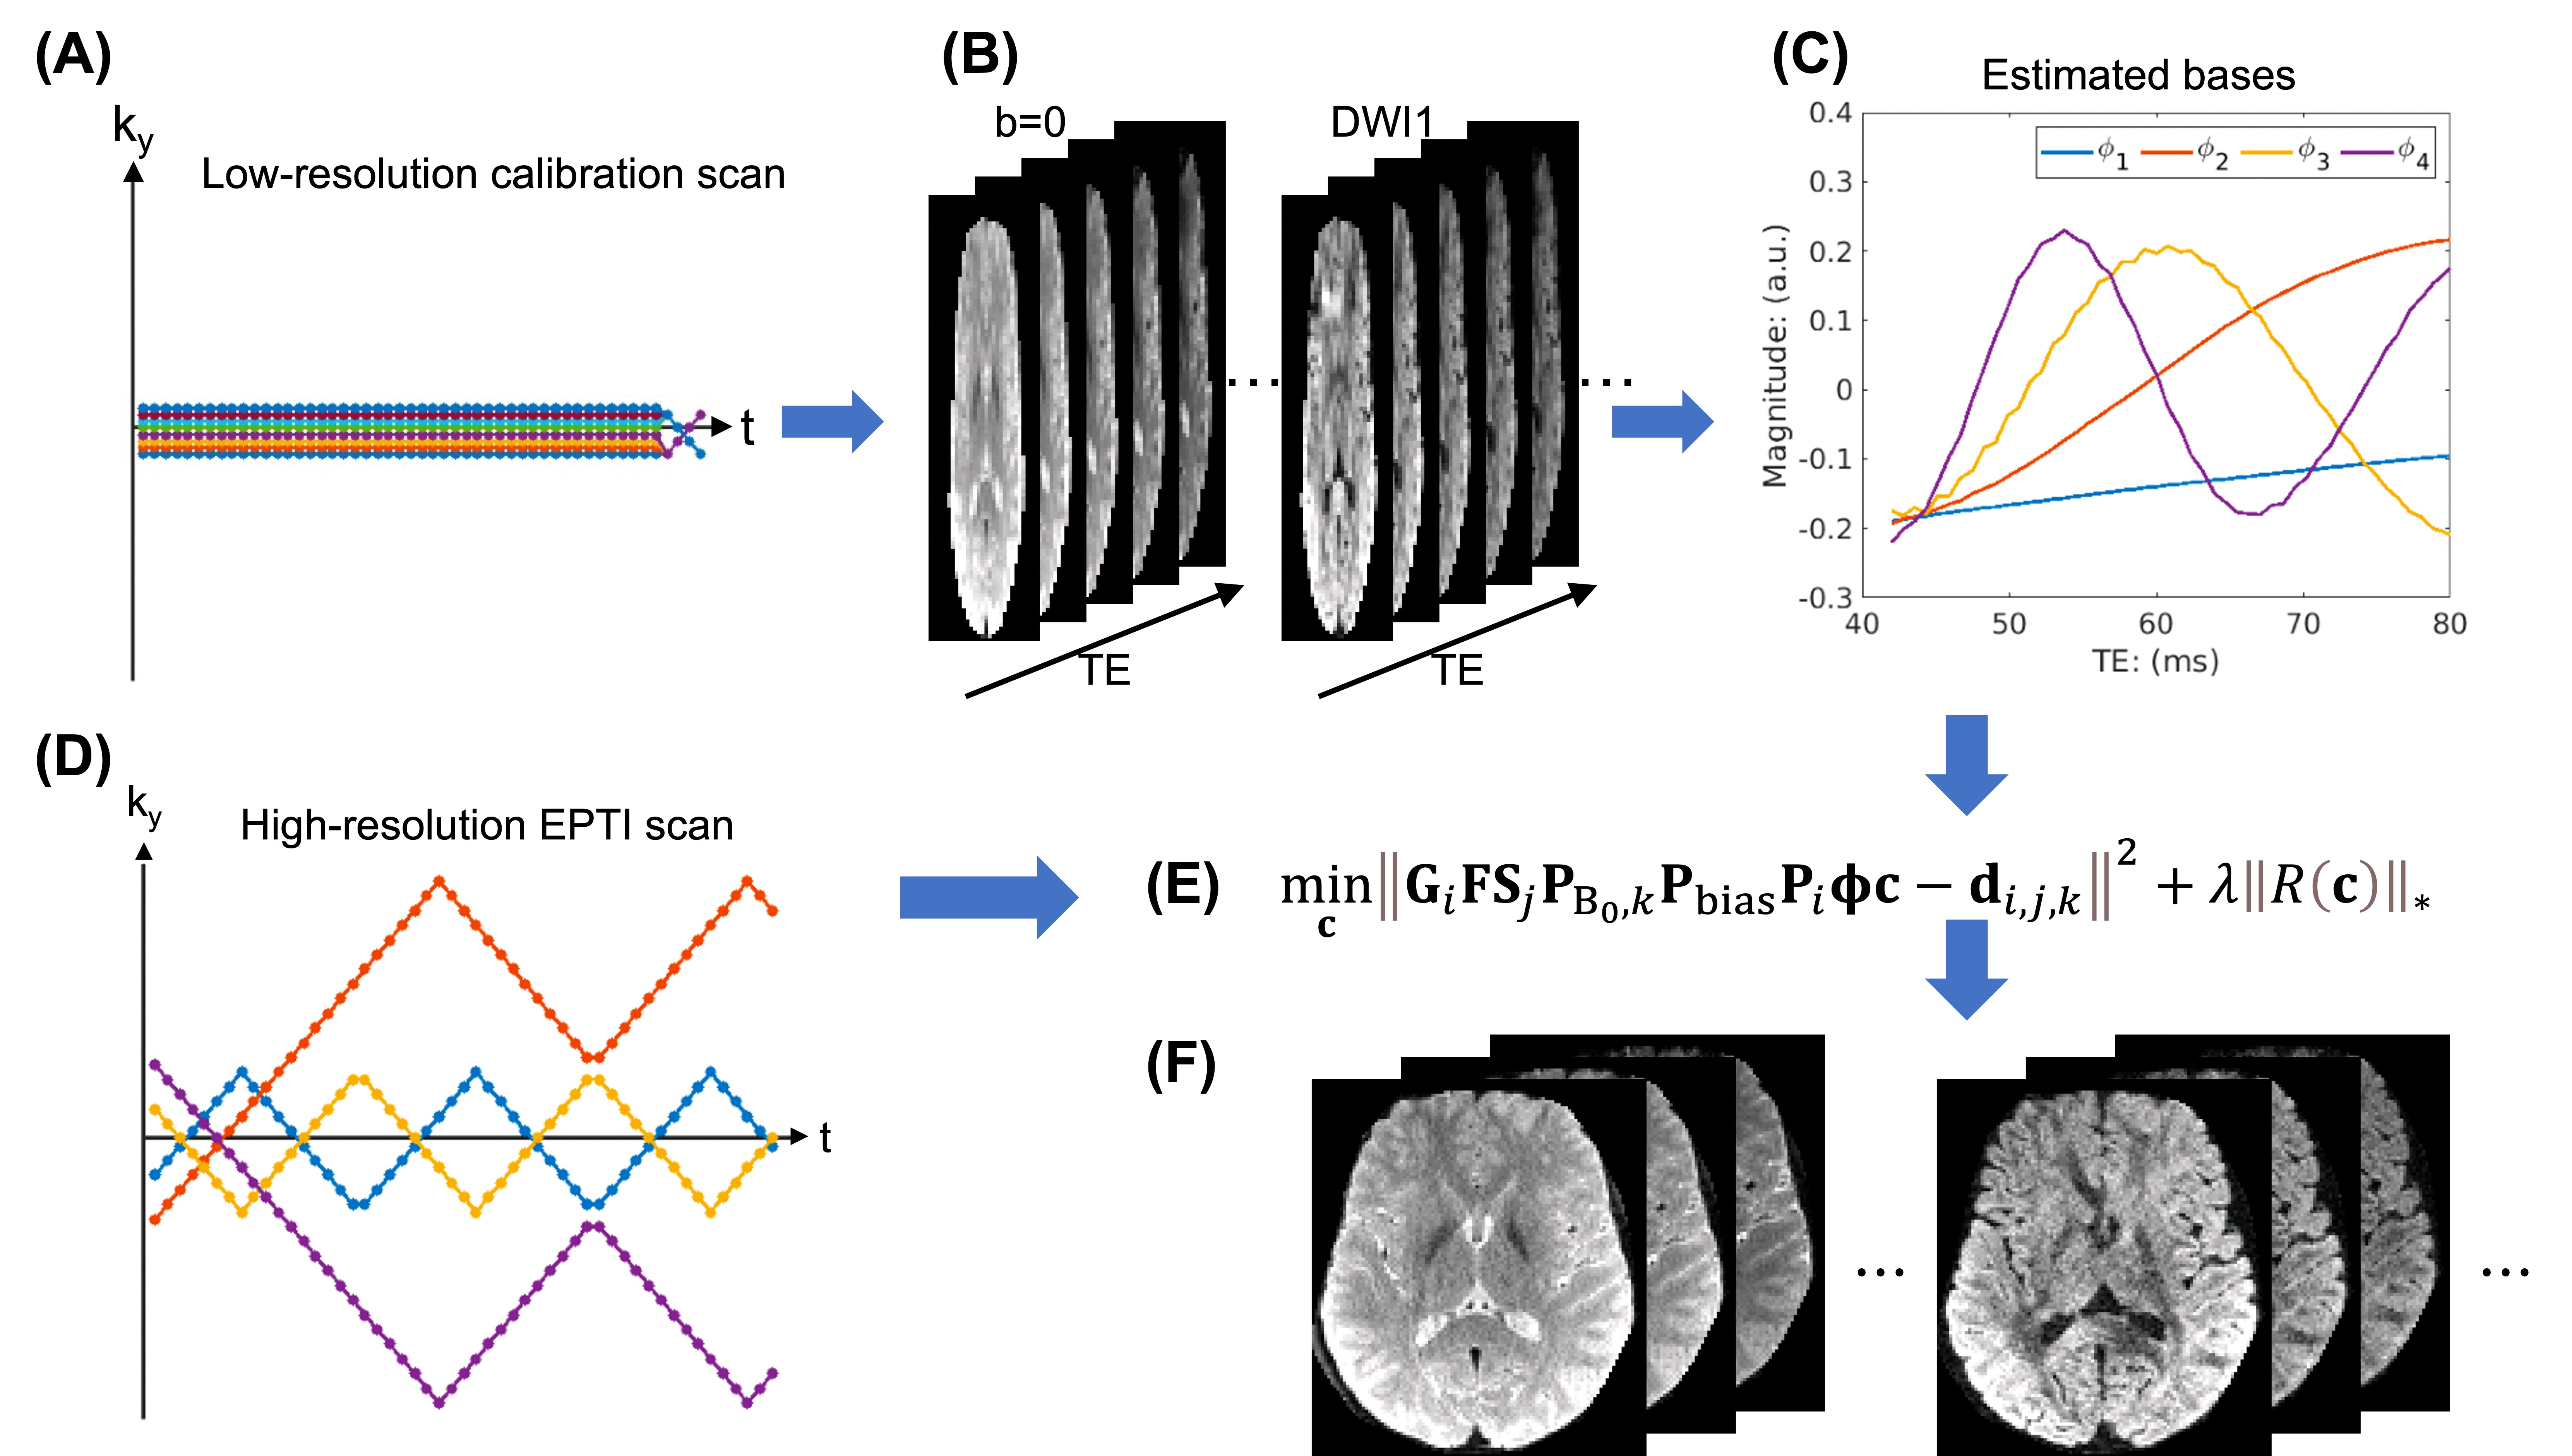
Figure 2. (A-C) The pipeline of estimating subspace bases from the acquired calibration data. (D-F) Subspace reconstruction of high-resolution EPTI images with the estimated bases from the calibration scan.
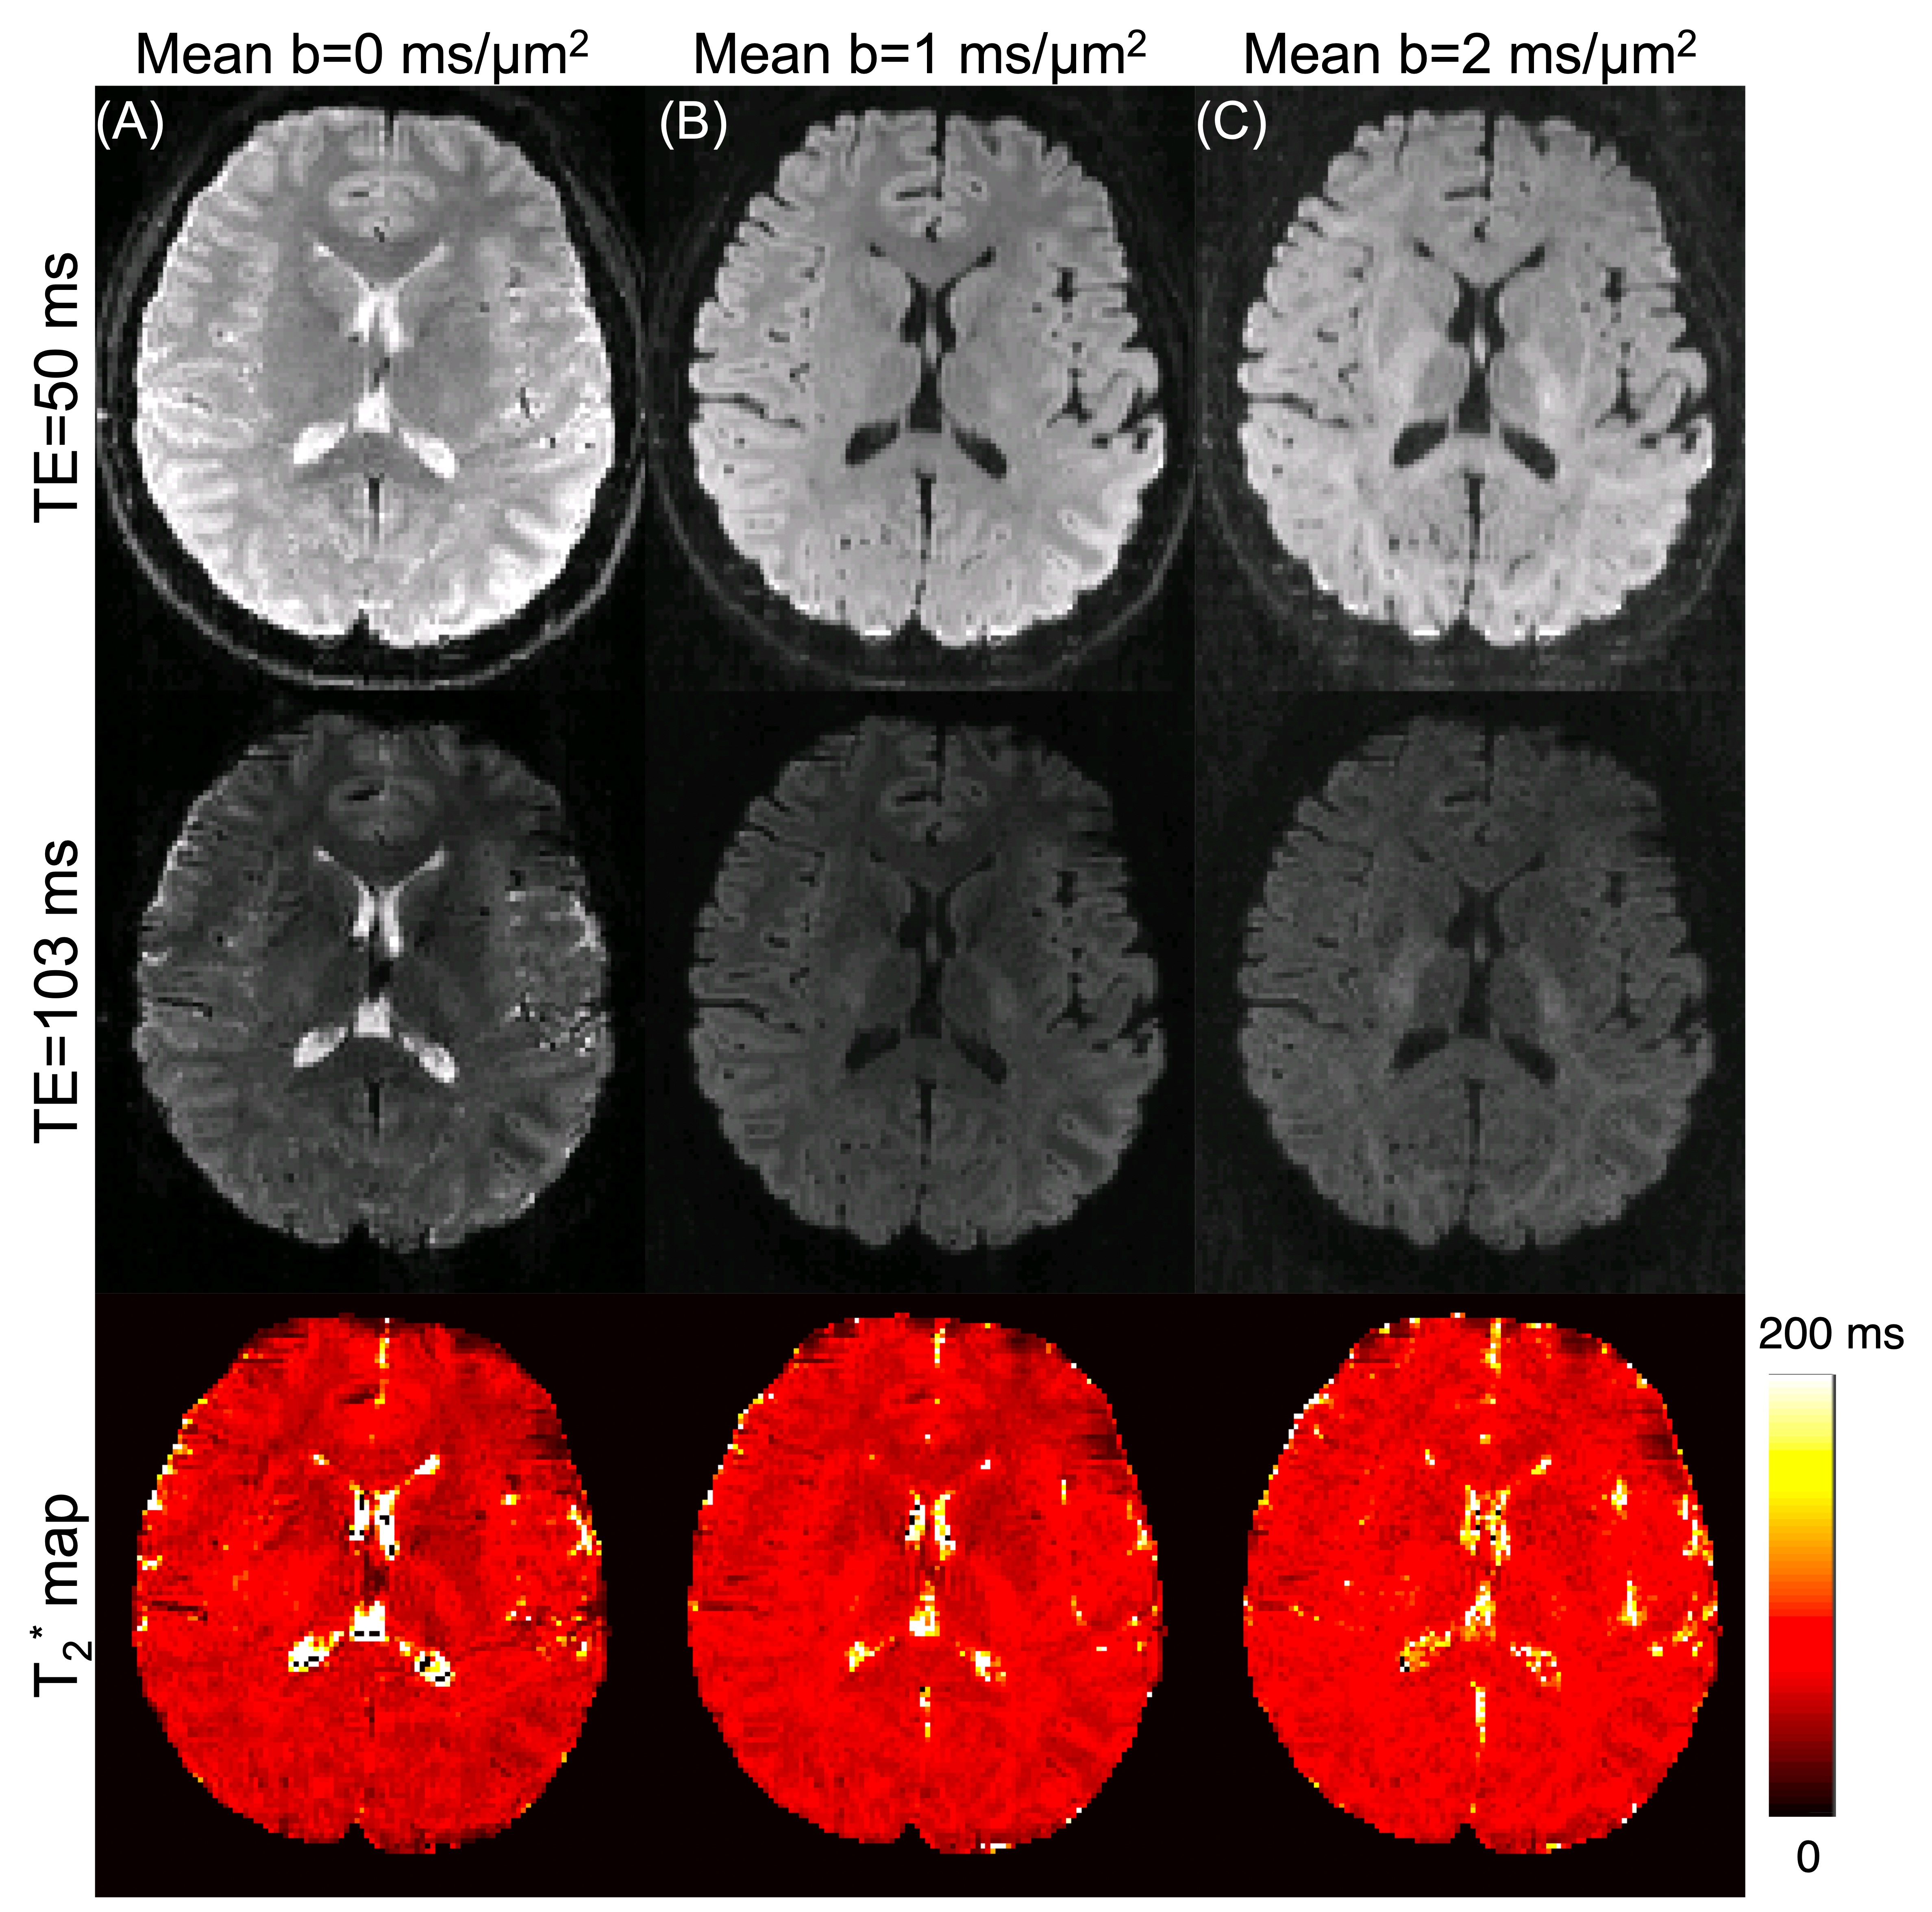
Figure 3. Reconstruction results of Experiment 1, including (A-C) The mean images of b=0, 1, and 2 ms/μm2 (only averaged over different b=0s or diffusion encoding directions. No average along the TE dimension), at the shortest (TE=50 ms) and longest TEs (TE=103 ms), and the fitted T2* maps.
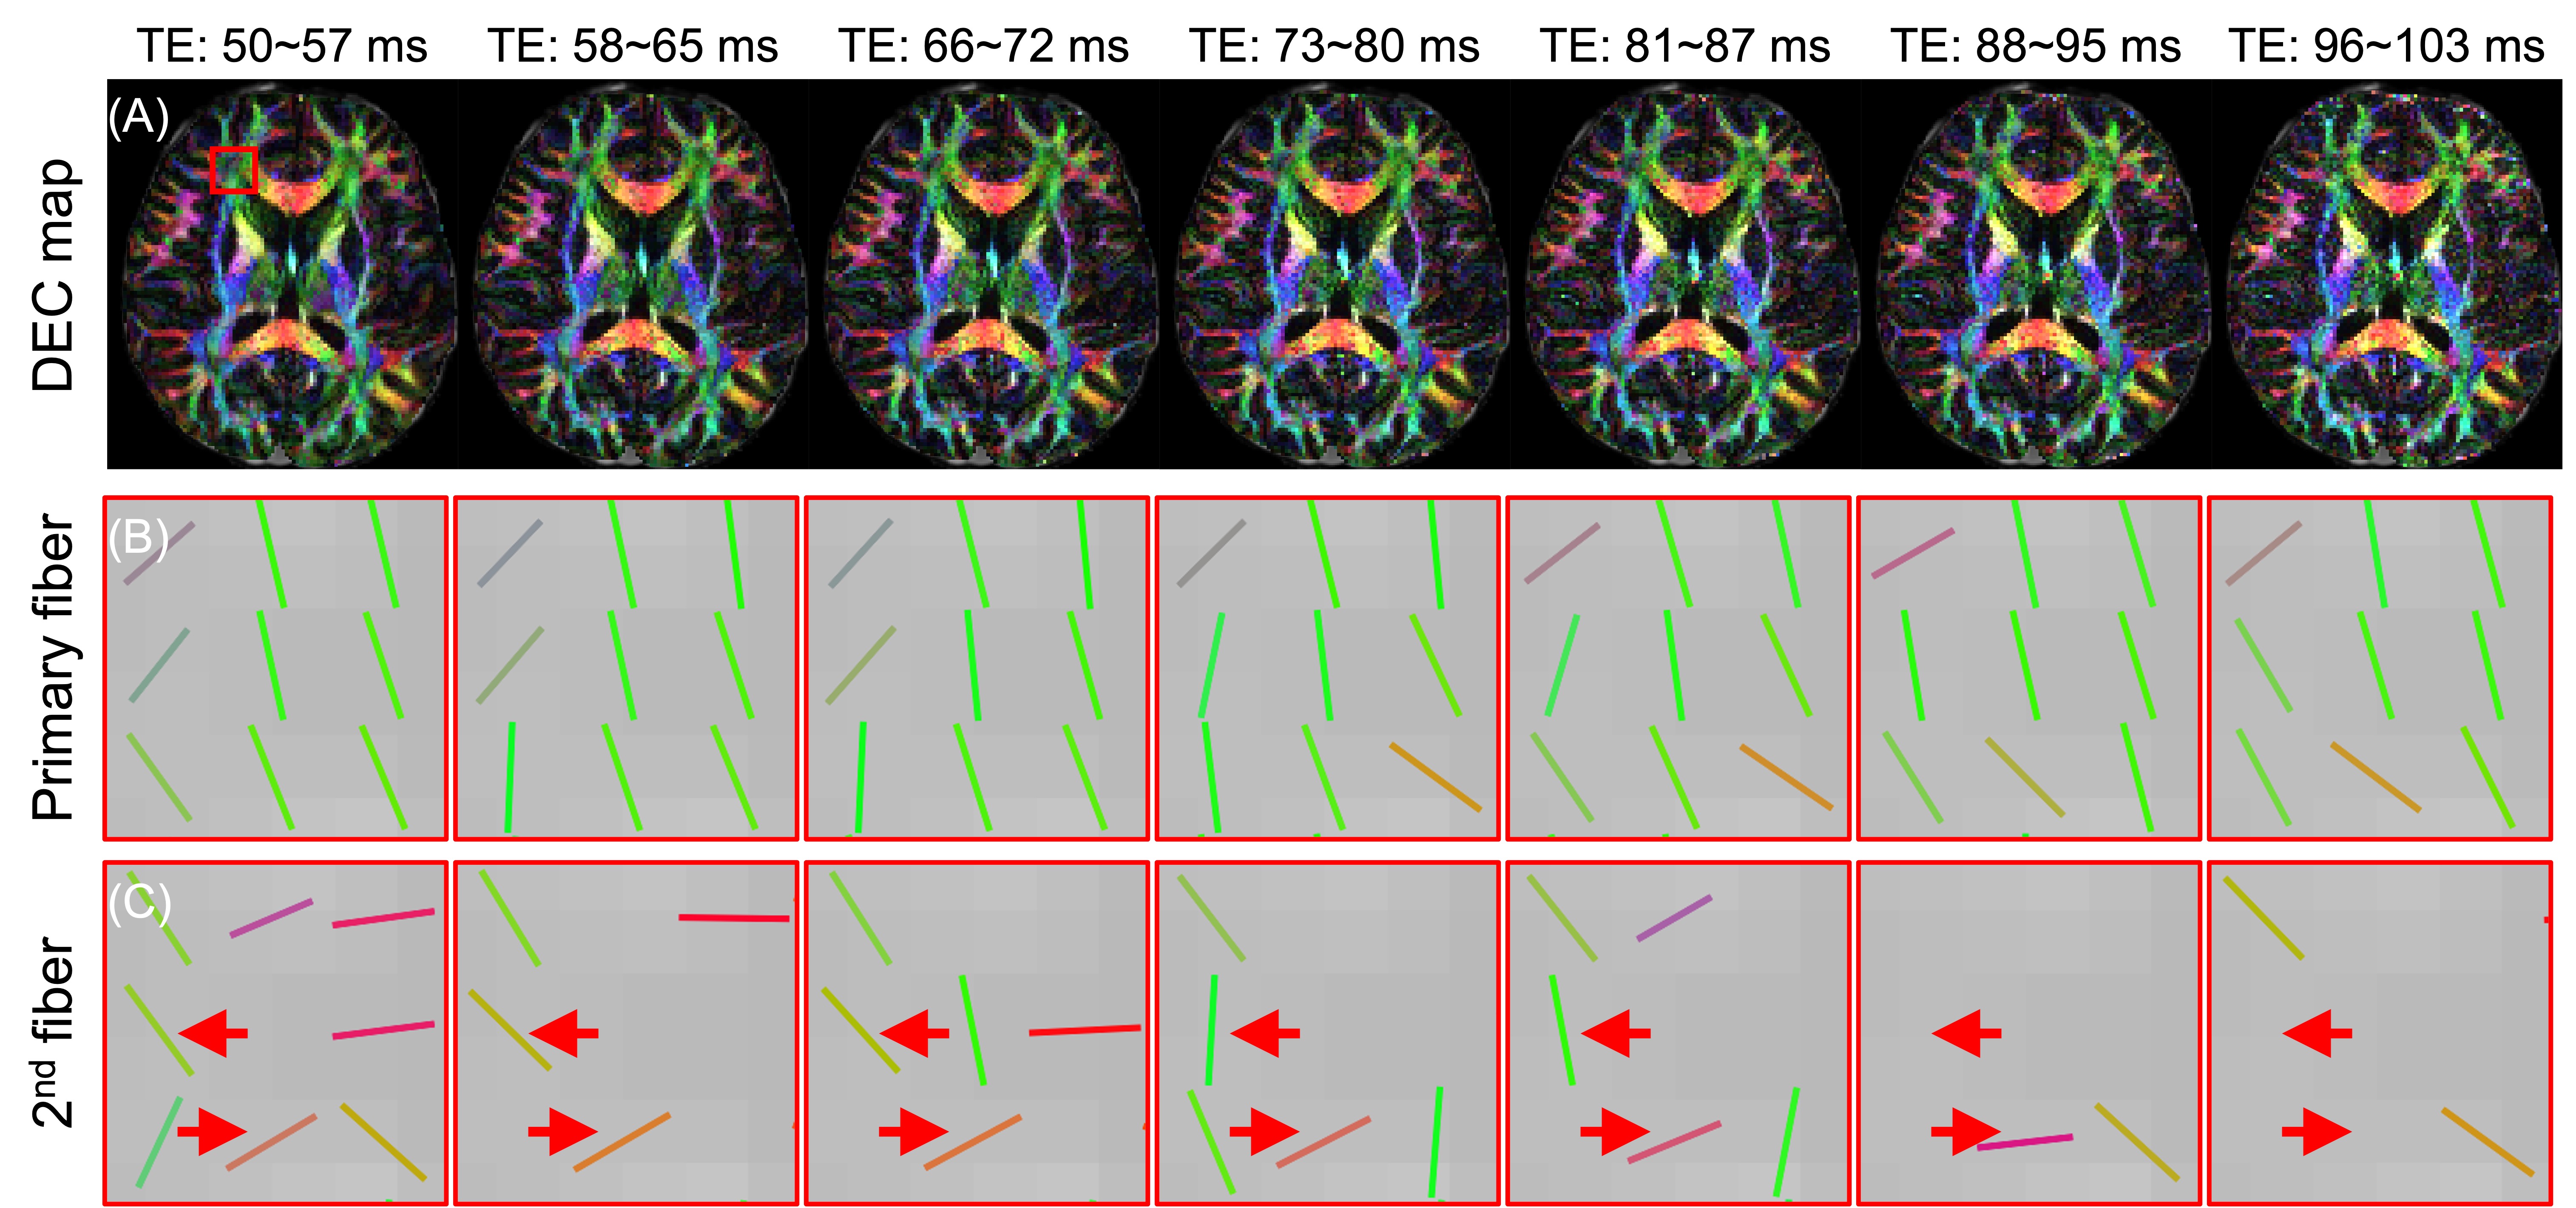
Figure 4. Results of Experiment 1, including (A) the directionally-encoded color (DEC) maps and the line representation of the (B) principal and (C) secondary fiber orientations in a selected ROI (red box) in 7 different TE groups. The red arrowheads note the observed consistent and gradual changes in the secondary fiber orientation over different TEs in two example pixels, potentially indicating changing sensitivity to tissue components with different T2*.
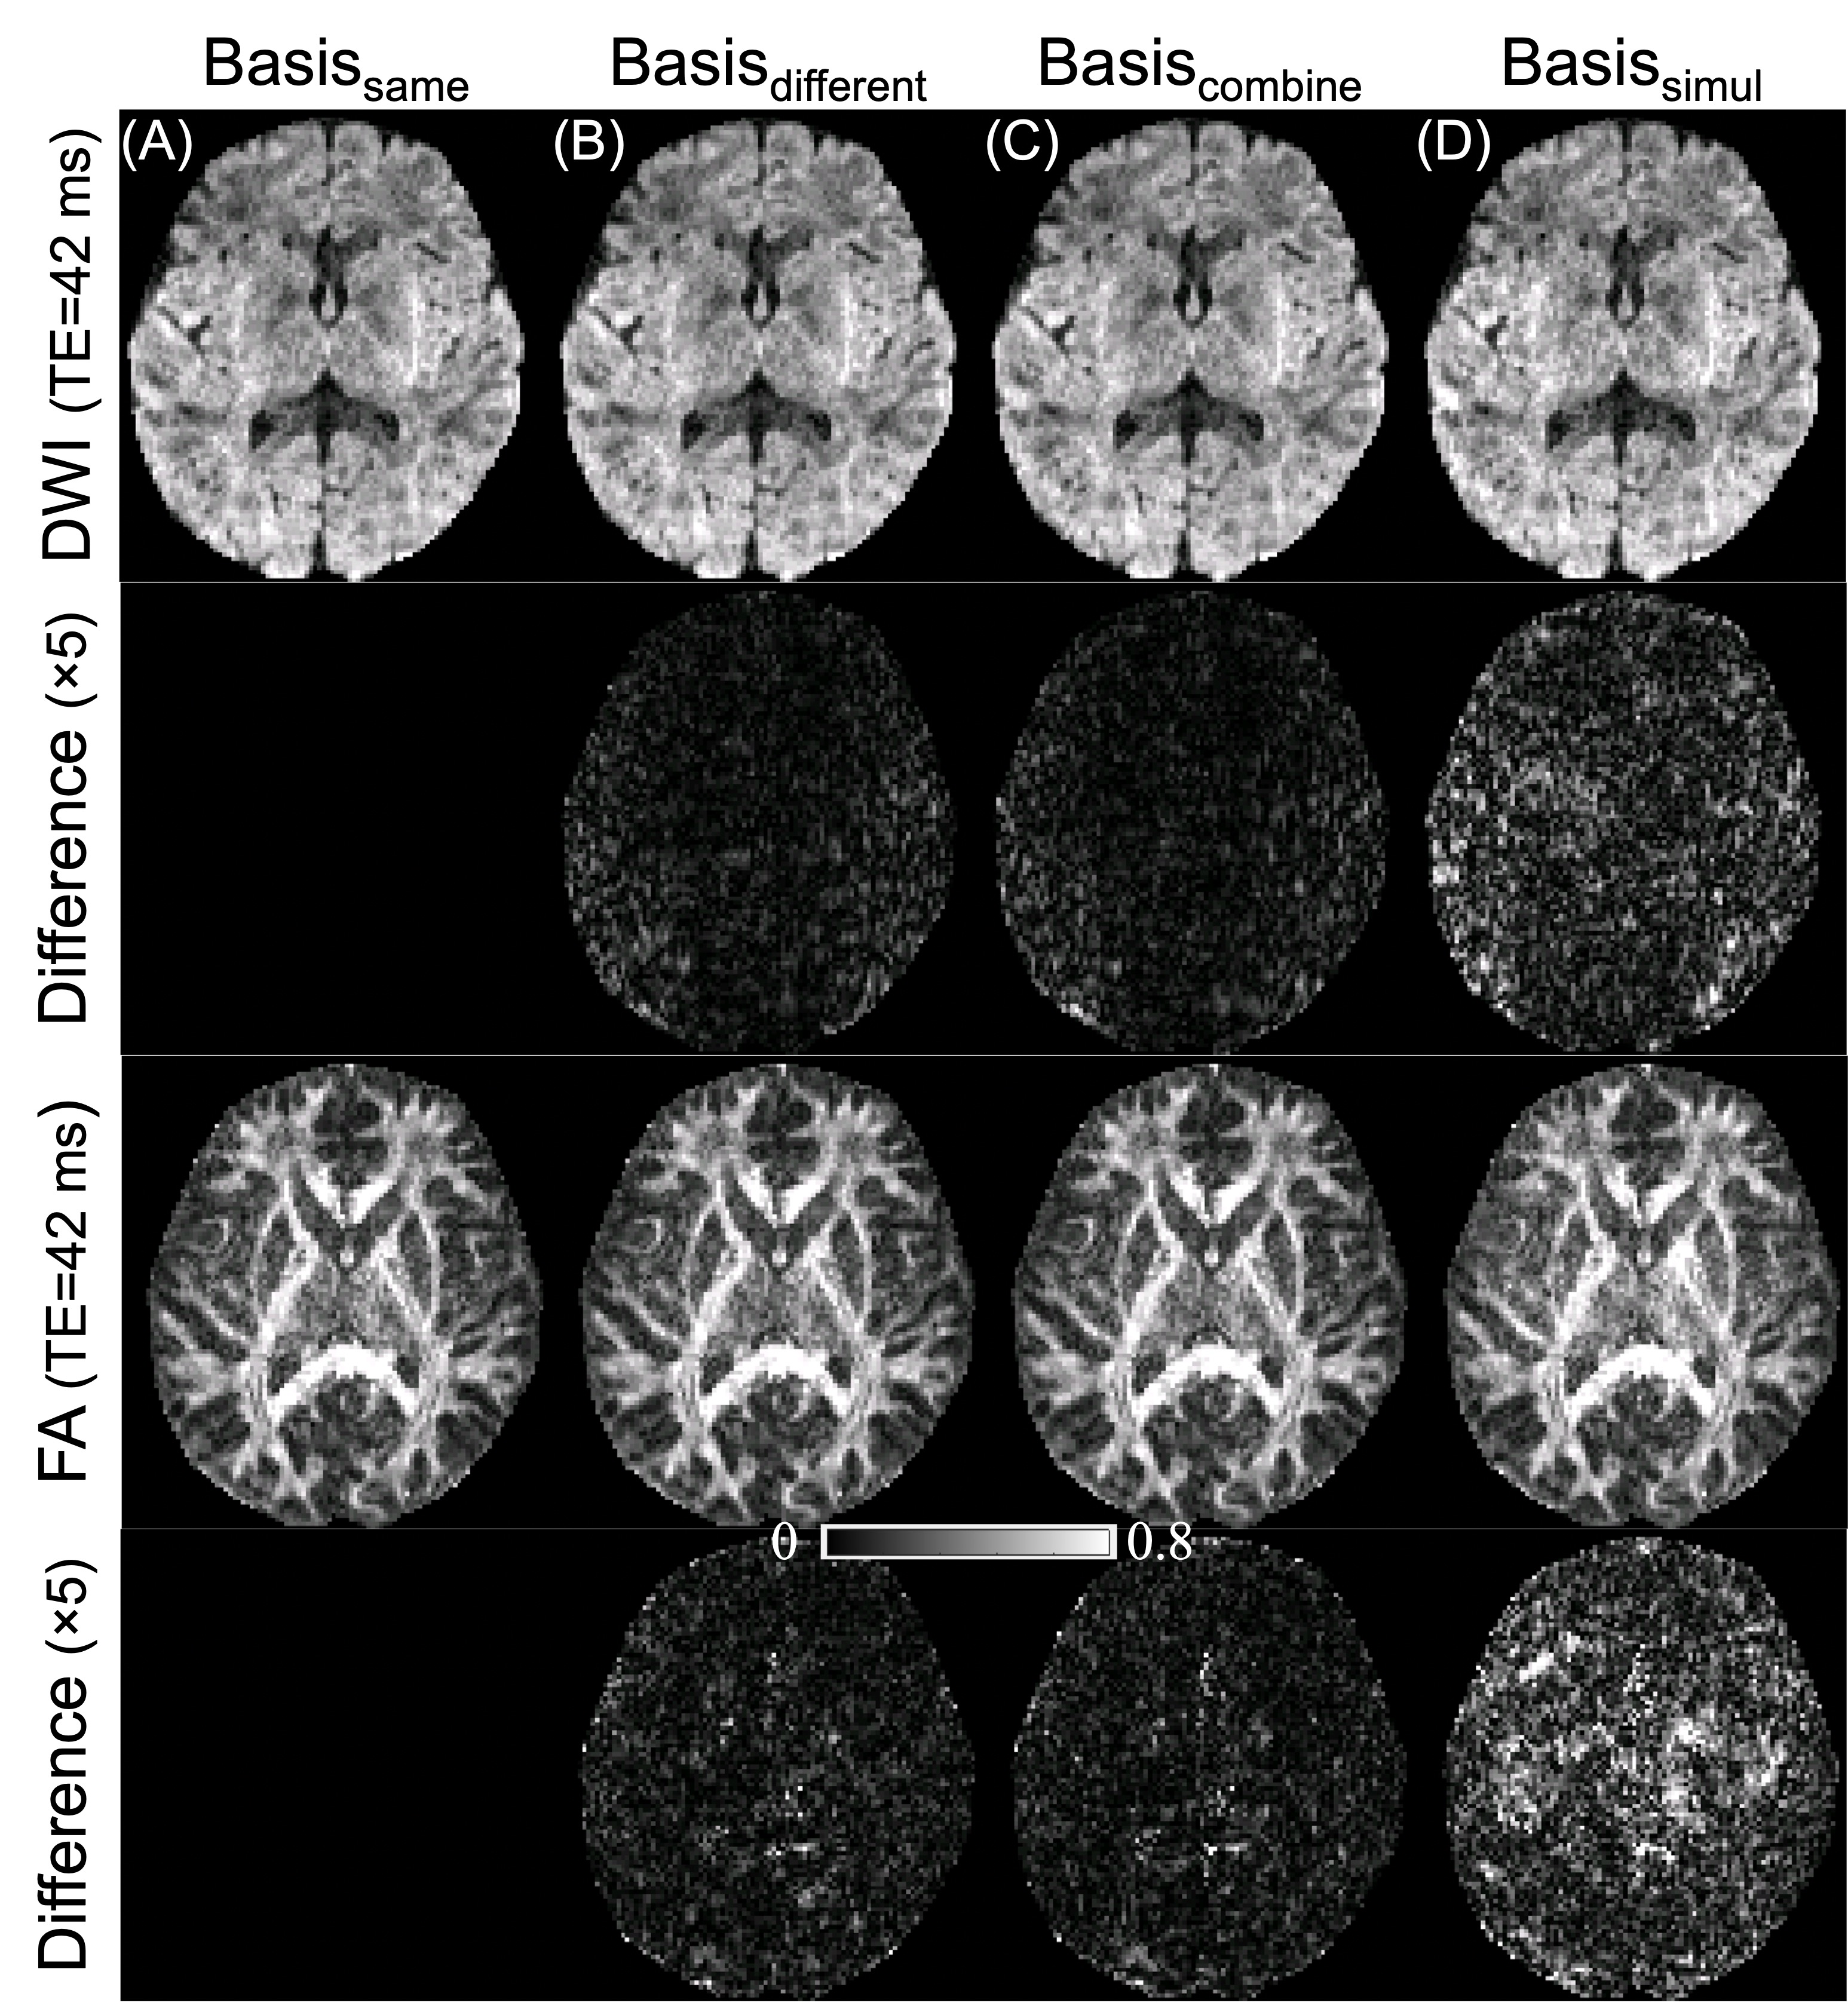
Figure 5. Subspace reconstruction results of Experiment 2 with Nm=4 magnitude bases estimated from (A) the calibration scan of the same subject (Basissame); (B) the calibration scan of a different subject (Basisdifferent); (C) the calibration scans of (A) and (B) together (Basiscombine), and (D) a simulation with varying T2 and T2* (Basissimul). Example single-direction diffusion-weighted images, FA maps, and the differences (intensity ×5) between (B-D) and (A) are shown.