1009
Fully automated analysis of contrast agent-free T1-rho mapping for enhanced myocardial tissue characterization1IHU LIRYC, Electrophysiology and Heart Modeling Institute, Université de Bordeaux, INSERM, Centre de Recherche Cardio-Thoracique de Bordeaux, U1045, Avenue du Haut Lévêque, Bordeaux, France, 2Department of Cardiovascular Imaging, Hôpital Cardiologique du Haut-Lévêque, CHU de Bordeaux, Avenue de Magellan, Bordeaux, France, 3Department of Diagnostic and Interventional Radiology, Lausanne University Hospital and University of Lausanne, Lausanne, Switzerland, 4CIBM Center for Biomedical Imaging, Lausanne, Switzerland
Synopsis
Keywords: Diagnosis/Prediction, Quantitative Imaging, Cardiac T1-rho mapping; automated analysis
Motivation: Contrast agent-free myocardial T1-rho (T1ρ) mapping has shown promise in myocardial injury quantification. However, the lack of analysis tools hinders its clinical use and induces increased workload and operator variability.
Goal(s): To explore the feasibility and benefits of clinically-integrated artificial intelligence-driven analysis of myocardial T1ρ mapping.
Approach: The automated process combines left ventricular wall segmentation, right ventricular insertion point detection and the creation of a 16-segment American Heart Association model for segmental T1ρ values analysis.
Results: Automated T1ρ mapping showcased strong agreement with manual processing, enhanced with time efficiency.
Impact: Artificial intelligence-driven analysis of myocardial T1-rho mapping exhibits strong agreement with manual processing, bolstered by time efficiency. This approach shows promise for the rapid and non-invasive assessment of heart disease without the need for contrast agents.
Background
Myocardial T1-rho (T1ρ) mapping has shown promise for the identification and quantification of myocardial injury without the need for contrast agent1. However, its clinical use is hindered by a lack of dedicated analysis tools. Consequently, the reliance on manual processing persists, imposing a dual challenge of radiologist workload and introduction of operator variability. Here, we intend to investigate the feasibility and the benefits of clinically integrated artificial intelligence (AI)-driven analysis for efficient and automated myocardial T1ρ mapping.Methods
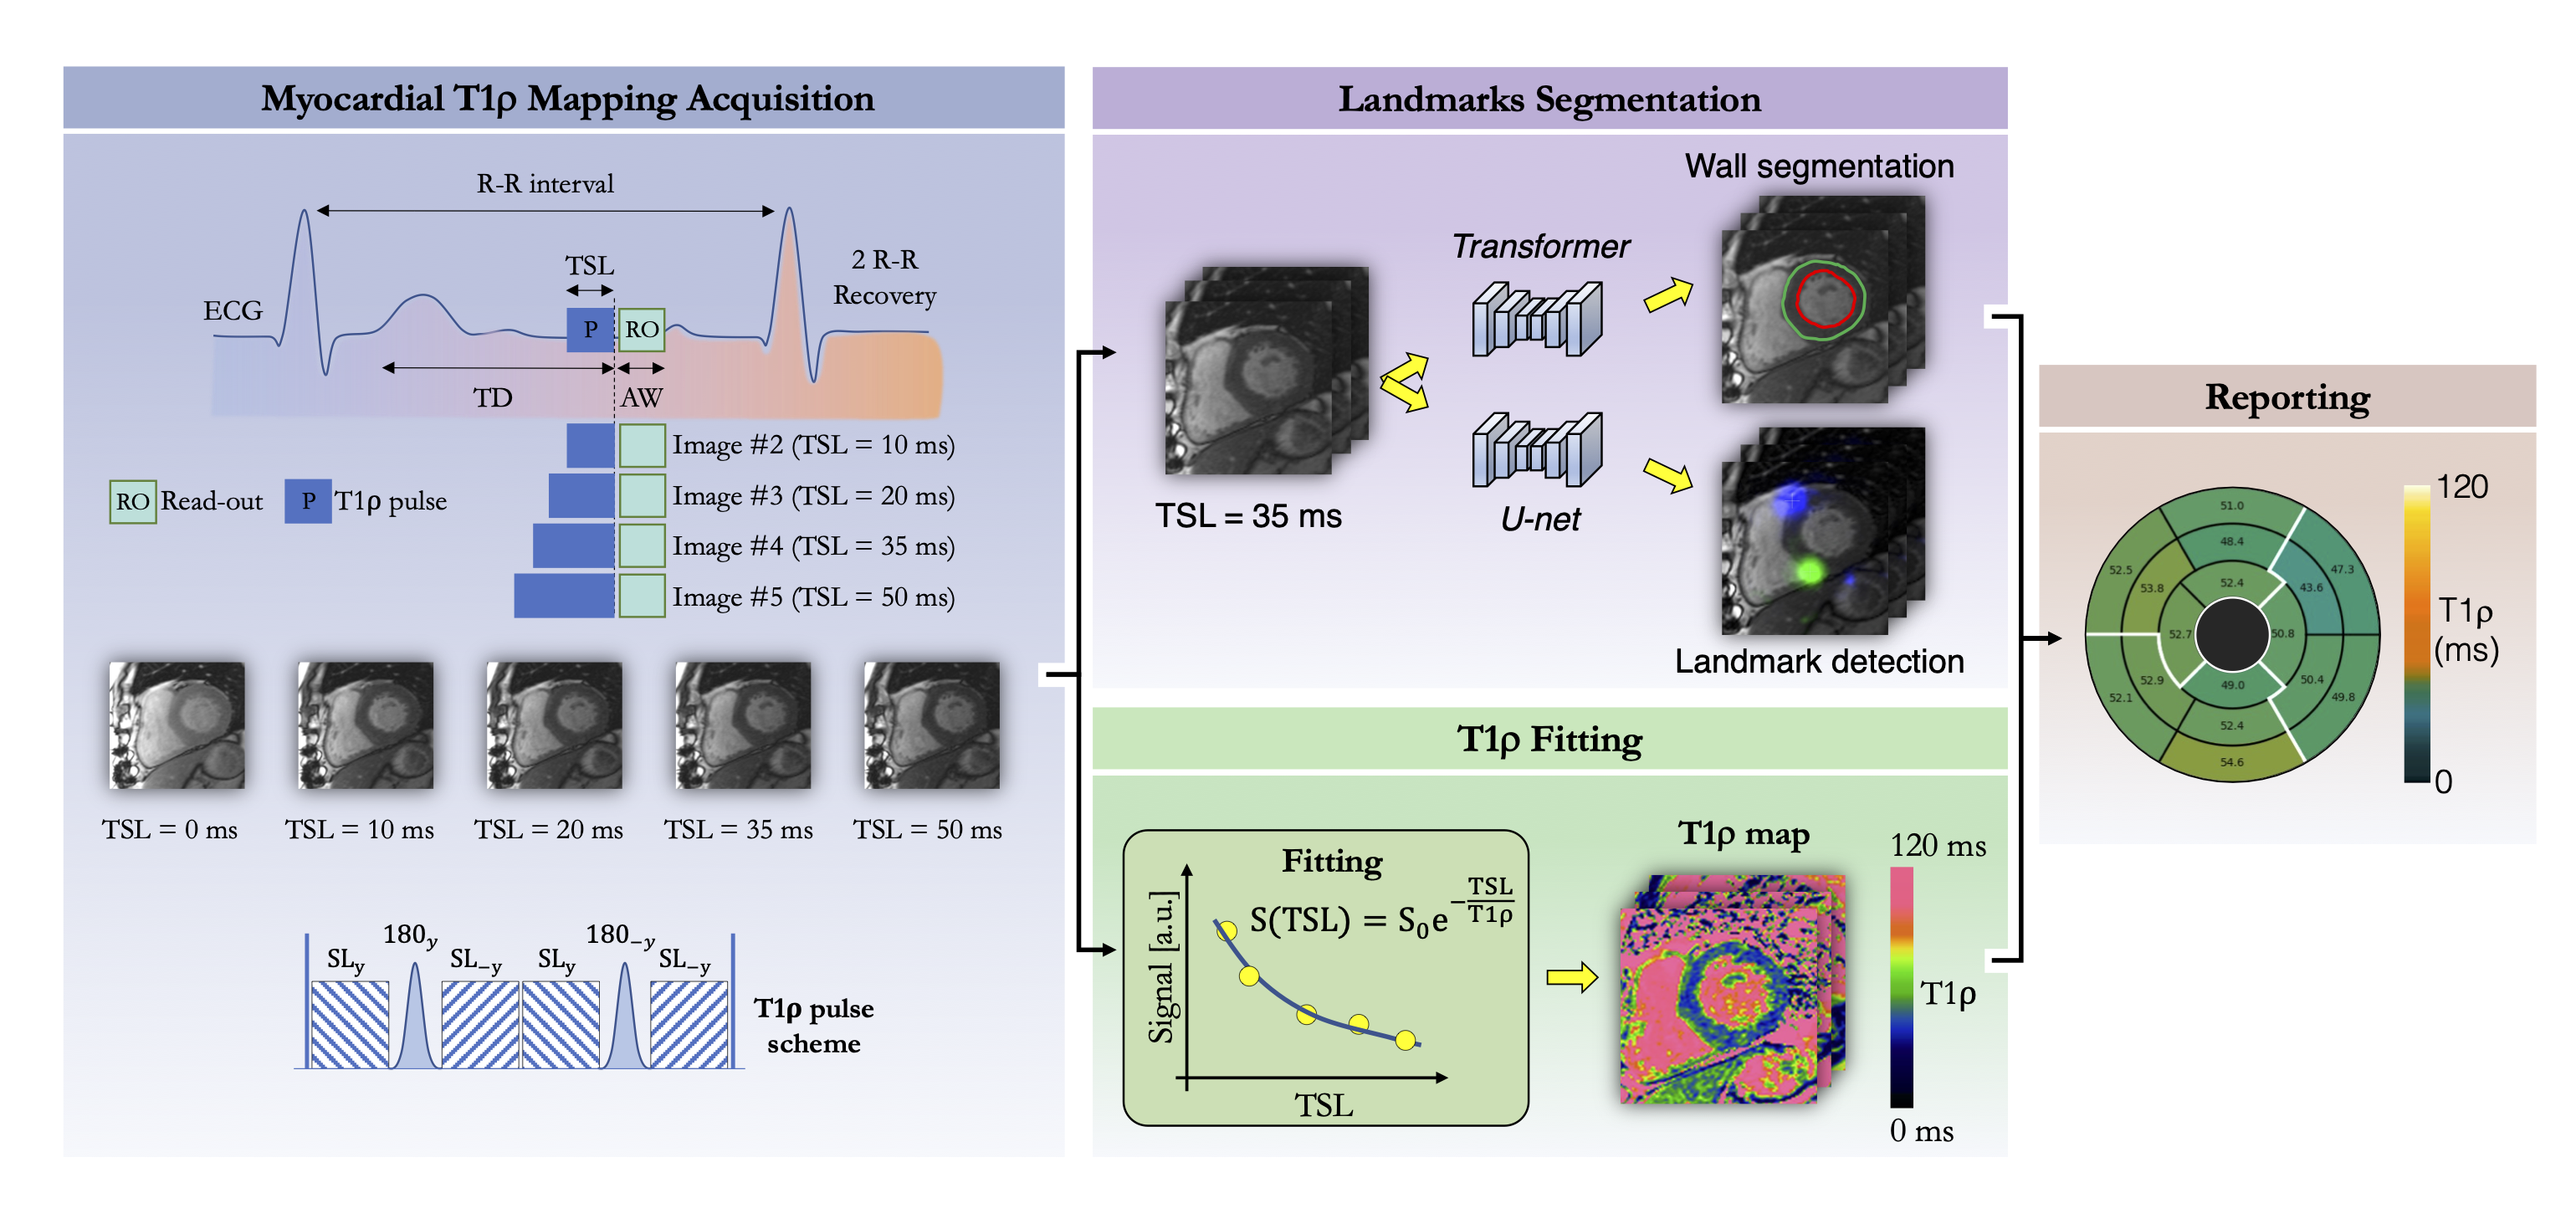
Data: A cohort of 573 patients, composed of healthy cases and patients with various heart conditions, was divided into a train set (N=500, 22% female, age 63 [55-71] years), and a test set (N=73, 68% female, age 55 [41-66] years).Acquisition: Each patient underwent cardiovascular magnetic resonance on a 1.5T scanner (MAGNETOM Aera, Siemens Healthcare, Erlangen, Germany). Pre-contrast 3-slice T1ρ maps were collected using a single-shot ECG-triggered 2D balanced steady-state free-precession sequence. Five co-registered T1ρ-weighted images were acquired using a T1ρ preparation module2 consisting of a 90° tip-down pulse played out along the x-axis to rotate the magnetization, followed by four spin-lock pulses with alternating phases and fixed duration, and two adiabatic 180° pulses. Additionally, a 90° tip-up pulse was then used to return the magnetization to the z-axis. A crusher gradient removed all residual transverse magnetization. For each shot, the spin-lock time was gradually increased (TSL=[0, 10, 20, 35, 50]ms) to generate a T1ρ map through a 2-parameter curve fitting process2. In the same subjects, late gadolinium enhancement imaging was subsequently performed 12min post-administration of 0.2mmol/kg gadoteric meglumine using a phase-sensitive inversion recovery sequence3.
Scan parameters: Images were acquired in short-axis during breath-holds with full ventricular coverage. Imaging parameters were: 10-20 slices, 5 signal averages, 1.4x1.4mm2 in-plane resolution, 8mm slice thickness, spin-lock frequency=400Hz, FA=60°, GRAPPA x2, ~160ms acquisition window, TE/TR=1.2/2.8ms, bandwidth=870Hz/pixel, inversion time was determined from a prior scout acquisition to cancel myocardium signal.
Image analysis: The left ventricular (LV) wall was automatically detected from the fourth T1ρ-weighted image (TSL=35ms) using a transformer-based model4. A U-Net5,6 was leveraged to detect right ventricular (RV) insertion points. LV contours and landmarks were propagated onto the T1ρ maps to build a 16-segment American Heart Association (AHA) model7, allowing for regional T1ρ value analysis (Fig.1). In both train and test sets, the manual contouring and identification of RV insertion points was performed by expert annotators using CVI42 (Circle Cardiovascular Imaging, Calgary, Canada). The transformer’s hyperparameters were: equally weighted binary cross-entropy, Dice loss, learning rate=10-3, AdamW optimizer, epochs=77, batch size=8, and weight decay=0.01. A pixel-wise Euclidean distance loss and a 10-4 learning rate were used for the U-Net.
The proposed method was implemented inline using the Gadgetron framework8. Native T1ρ-weighted images and their corresponding T1ρ maps were sent back to the user interface, along with LV wall contours, AHA 16-segment bullseyes, RV insertion points and associated confidence scores.
Experiments: Processing times were measured. Segmentation quality in the test set was assessed using the Dice coefficient. Confidence scores, informing on the probability of accurate detection of landmark insertion points, were retrieved. T1ρ values were quantitatively assessed for both manual and automated processing on patient, slice, and segment levels. Paired Student’s t-tests were used to compare T1ρ values assessed with both processing. T1ρ values difference between slices and between AHA segments were tested using one-way Repeated Measures Analysis of Variance. The concordance between methods was gauged using Bland-Altman analysis and intra-class correlation coefficient (ICC).
Results
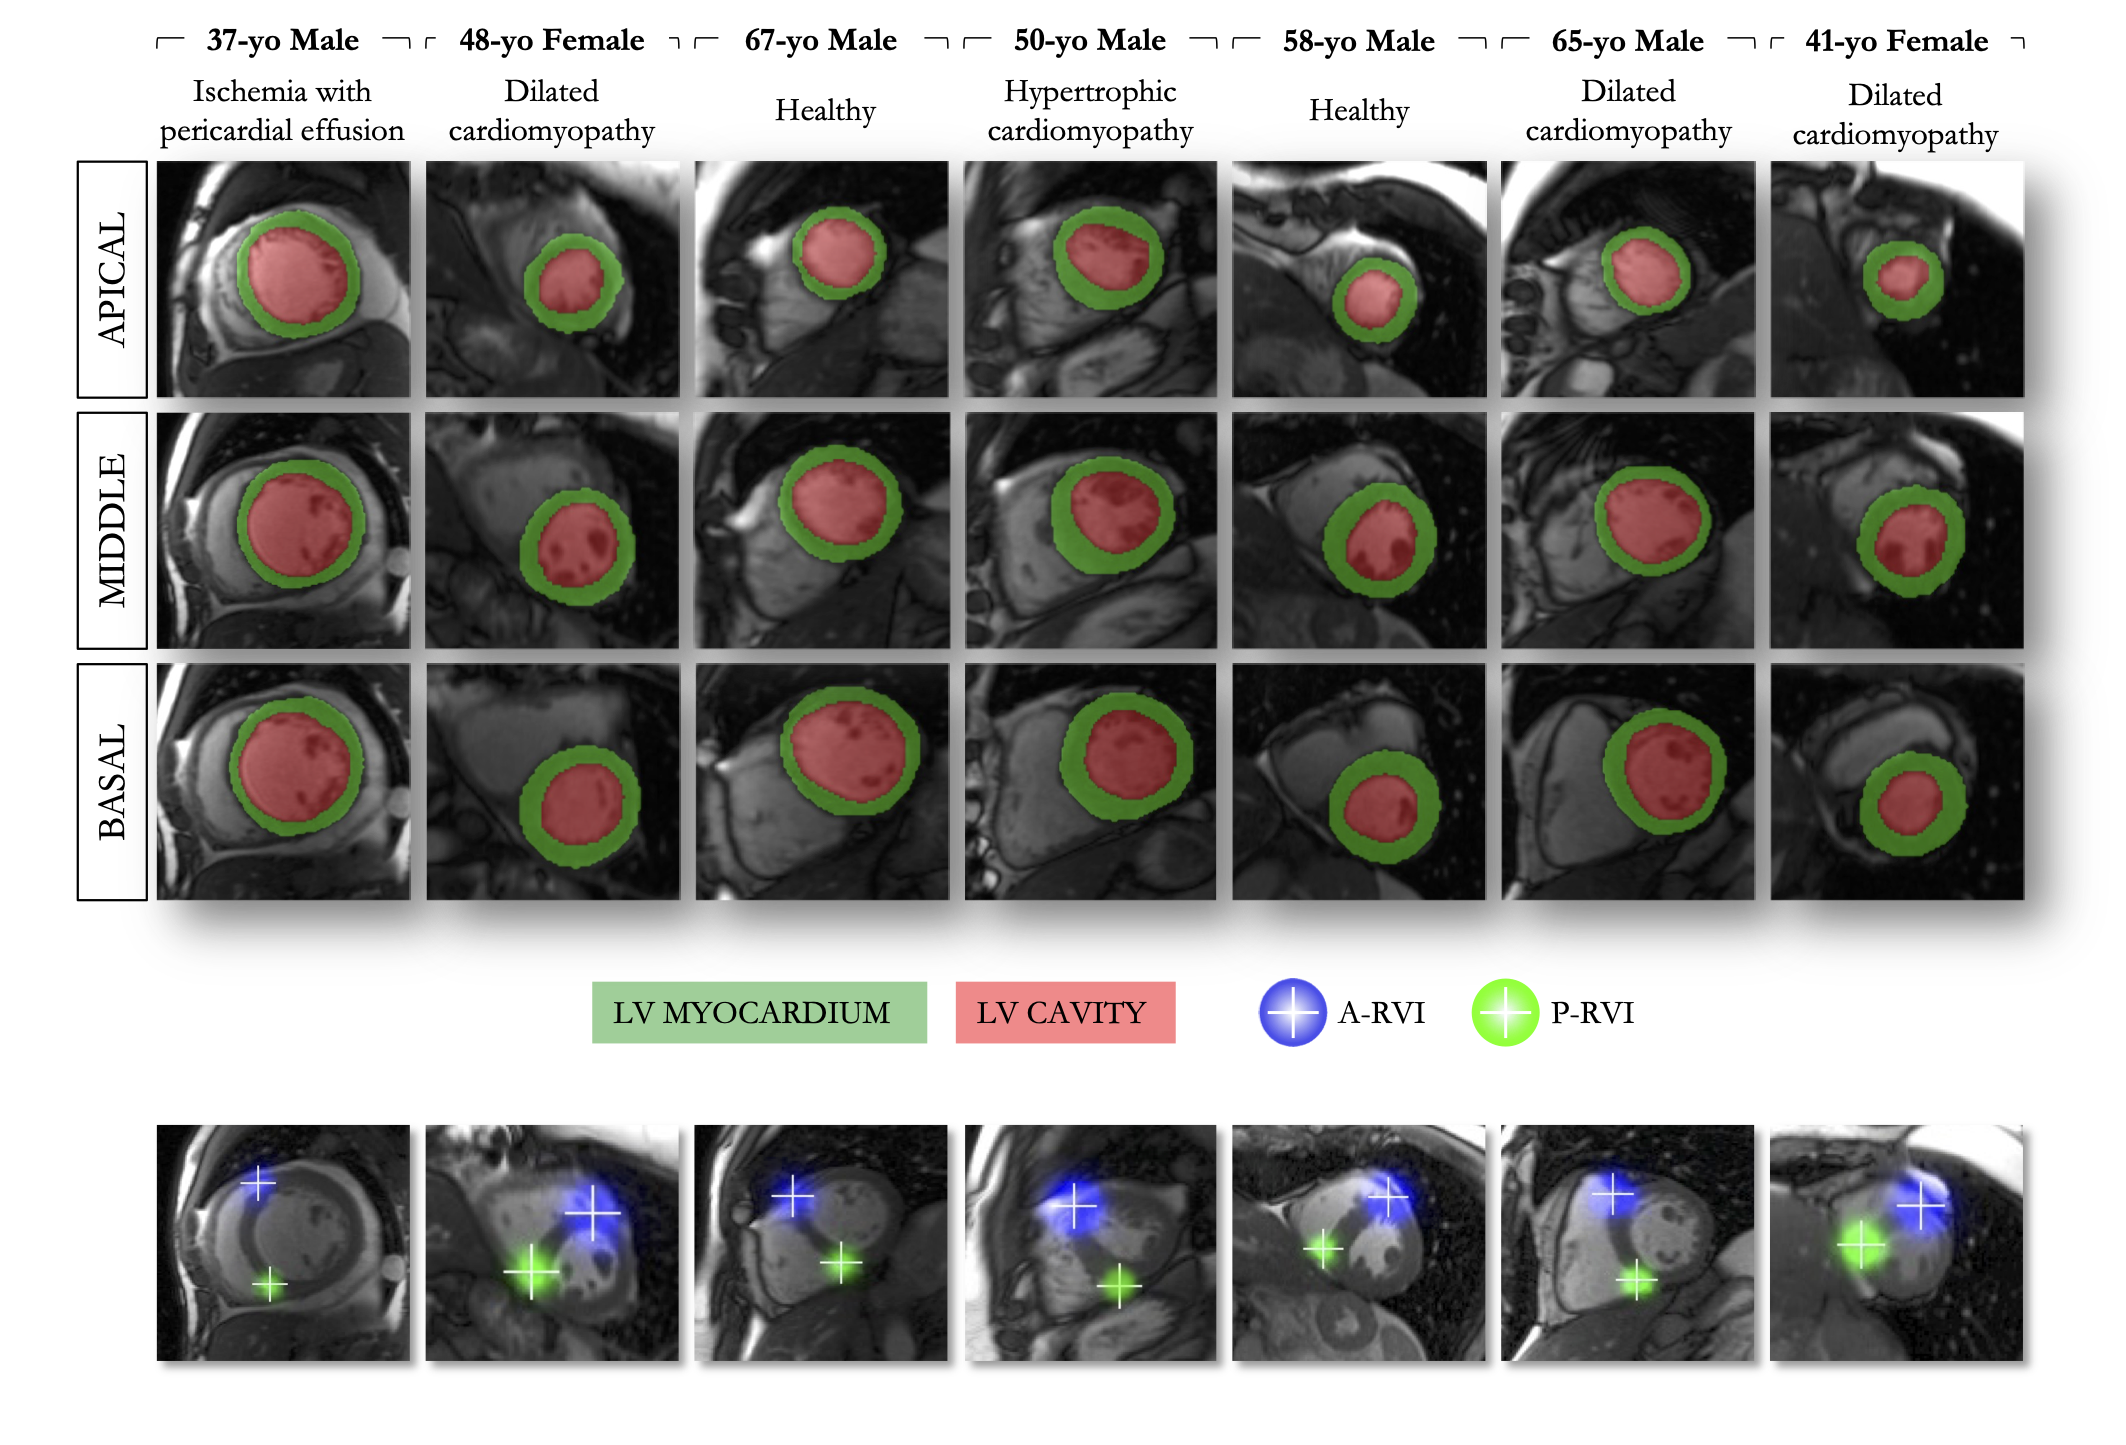
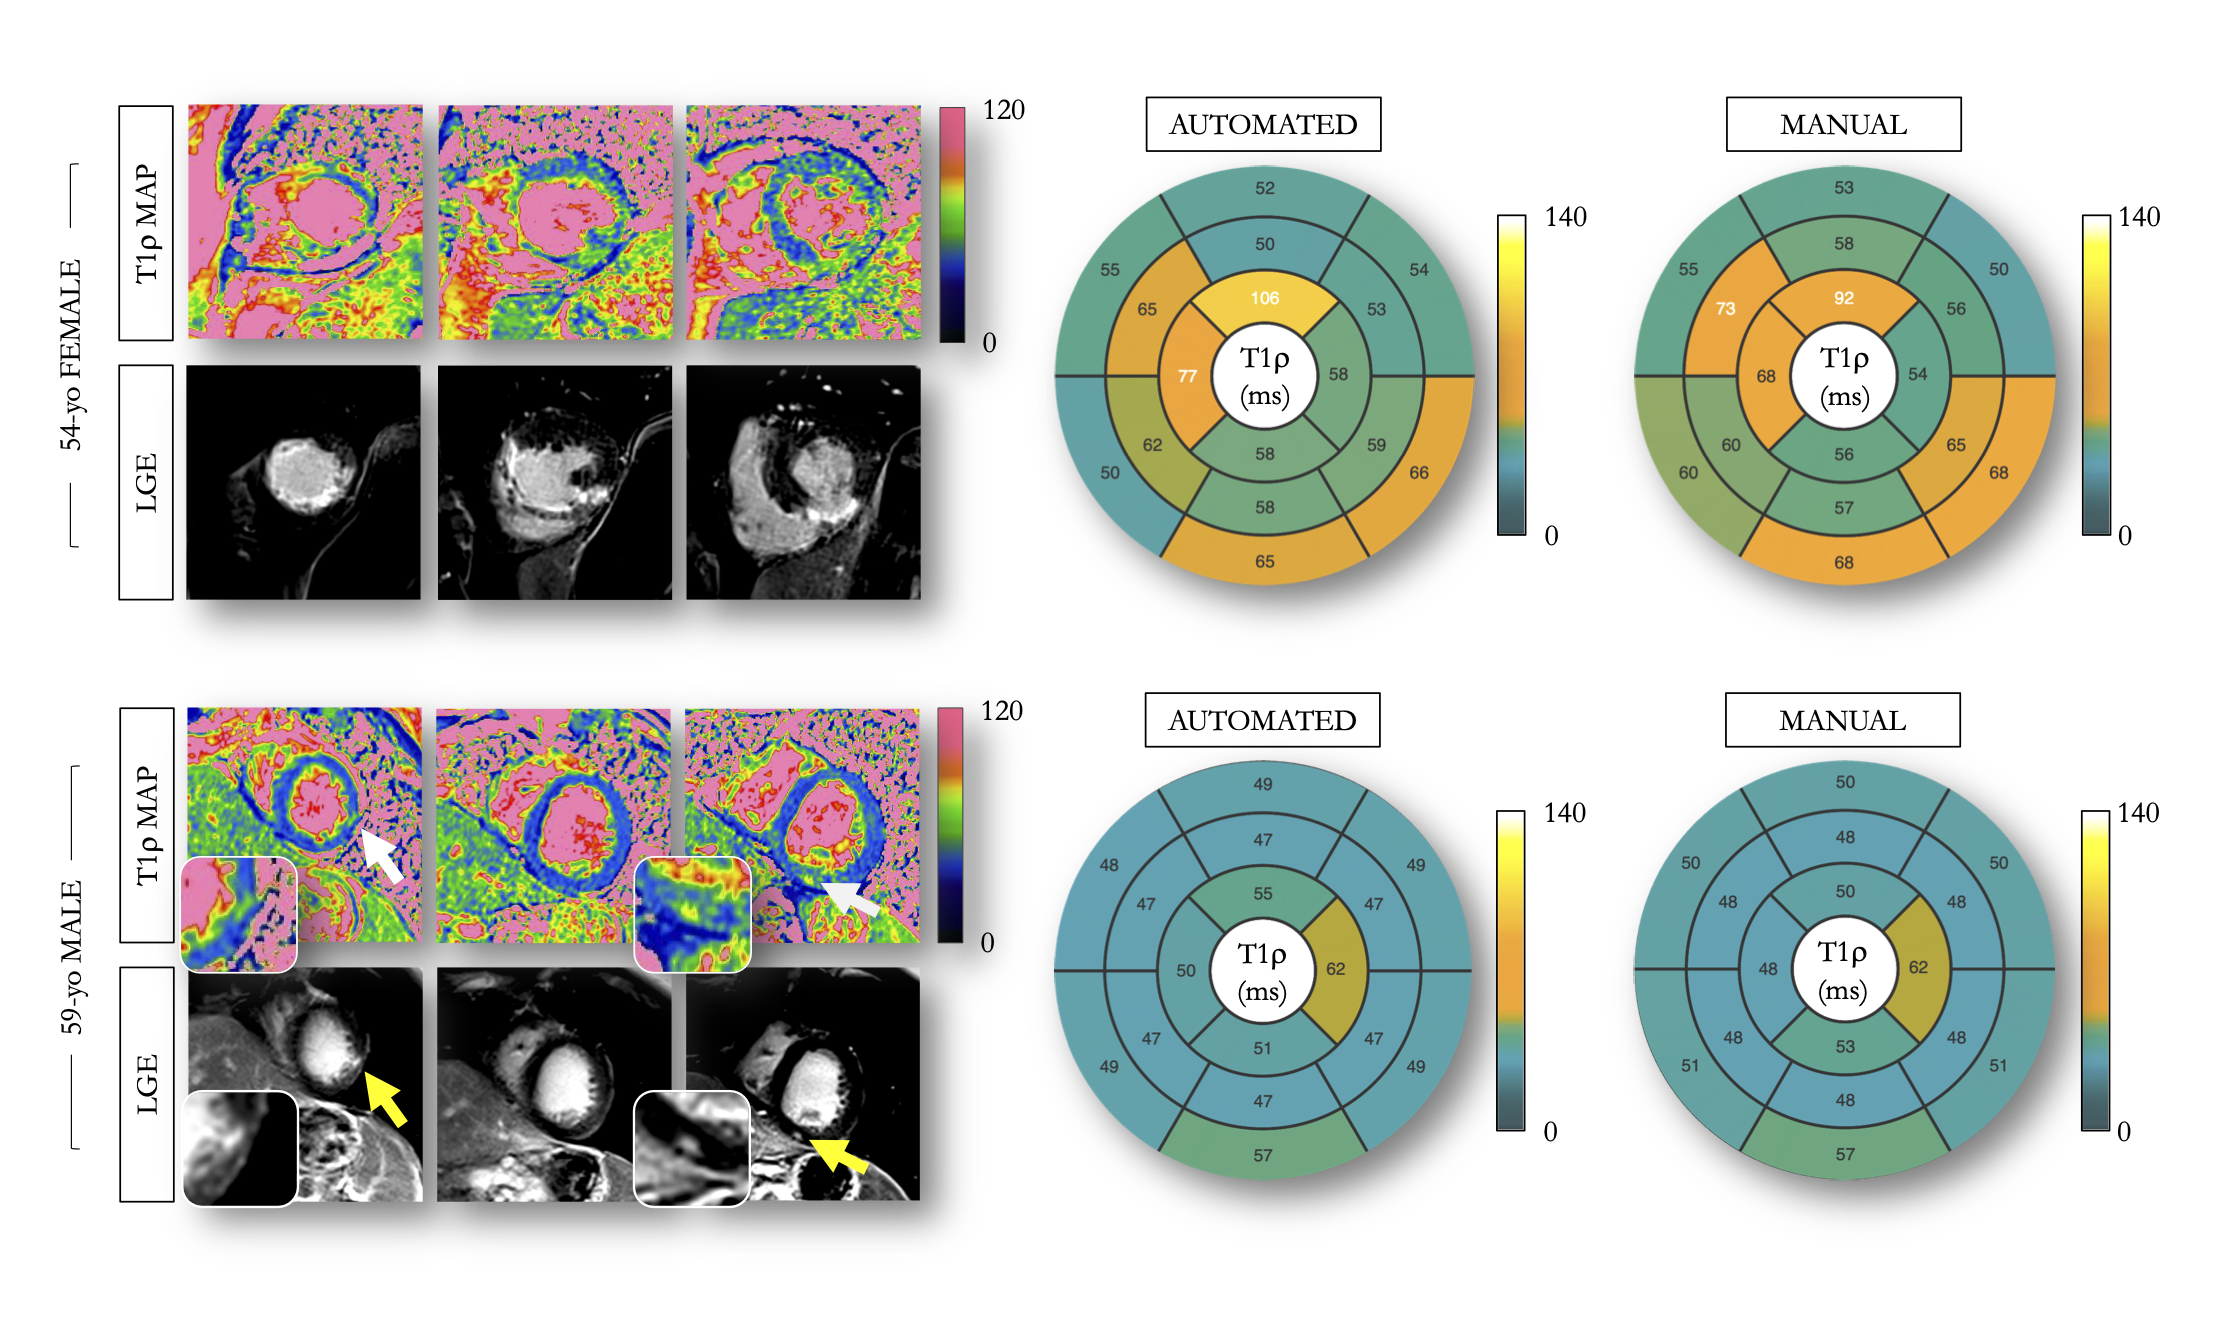
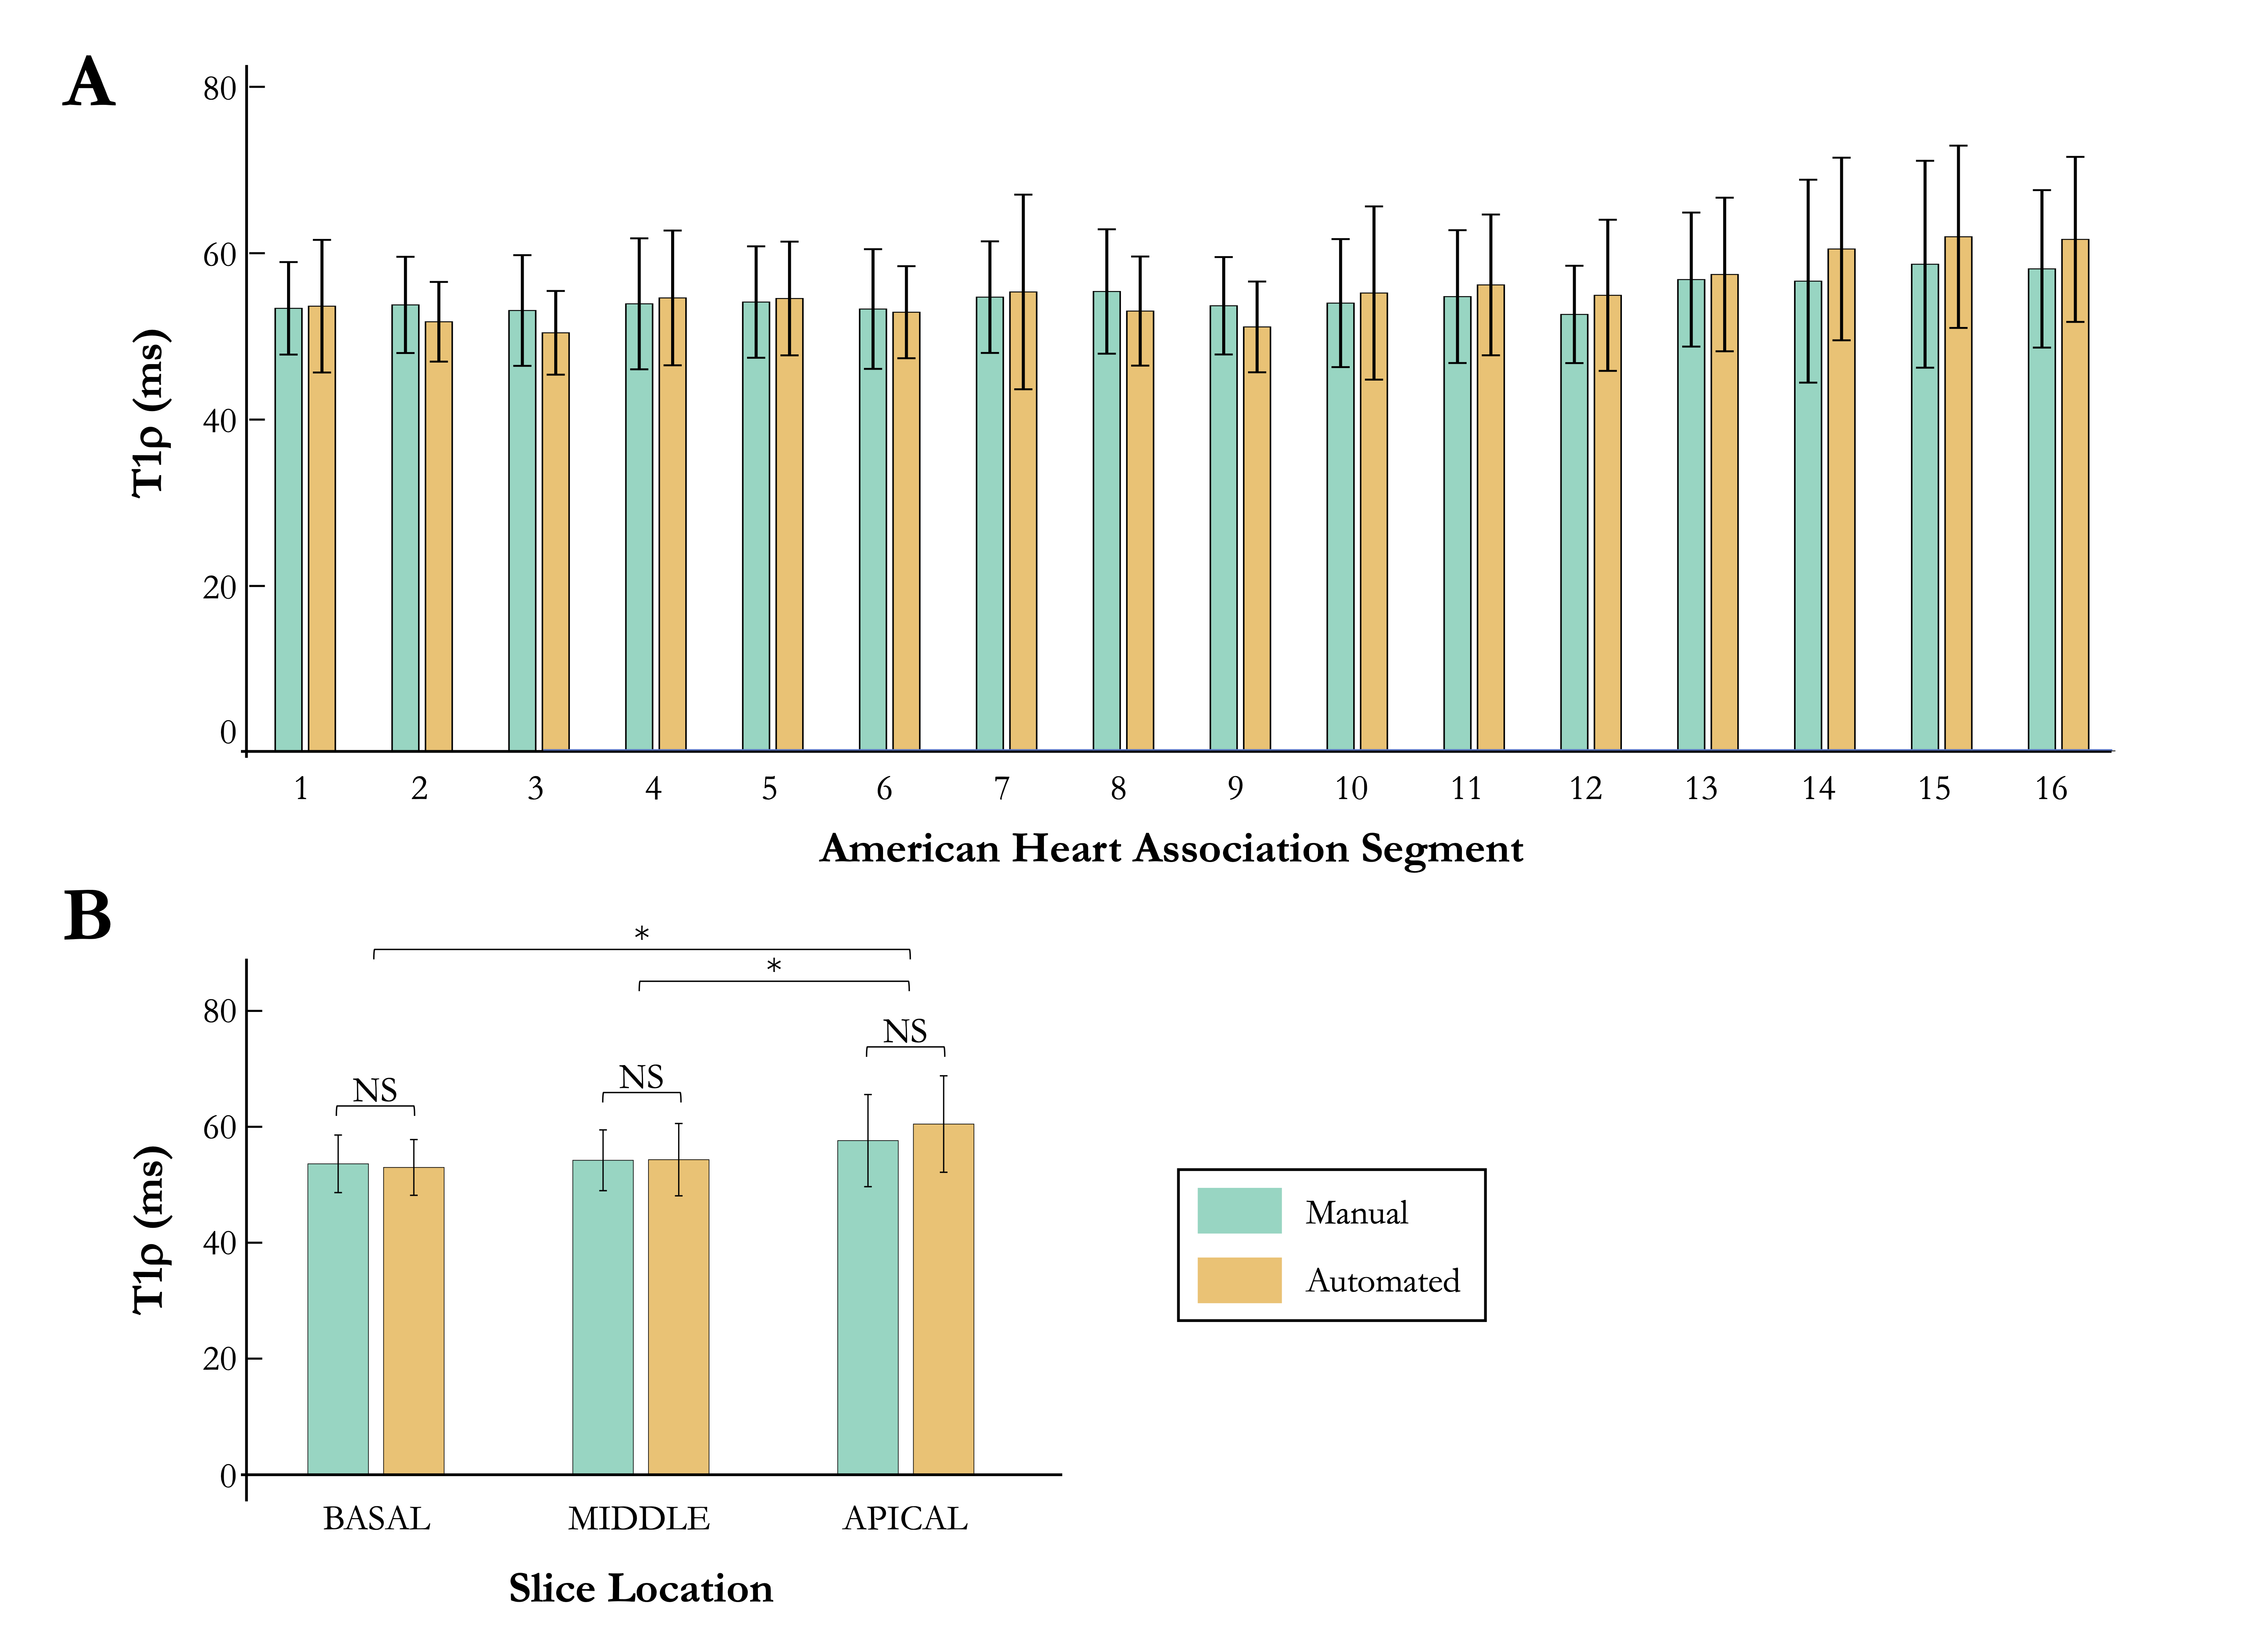
Automated analysis of myocardial T1ρ mapping revealed a reduced processing time compared with manual processing (3s vs. 1min51s±22s). Automated segmentation quality yielded favorable results (global Dice 81.2%±6.5). Confidence score for detecting both landmarks reached 94.4% (95% CI: 91.3% - 95.7%) (Fig.2). No significant difference in global T1ρ values was observed between manual (54.9±4.6ms) and automated (55.4±5.1ms) processing (P=0.098). A high level of agreement with expert-derived T1ρ values was found at the patient (ICC=0.85 [0.77-0.90], bias 0.52±5.18ms), slice (ICC=0.80 [0.74-0.84], bias 0.78±8.52ms), and segment (ICC=0.65 [0.62-0.68], bias 0.52±14.48ms) levels (Fig.3). No significant differences in myocardial T1ρ values were found between the automated pipeline and manual processing across the 16 segments defined by the AHA (P>.05) (Fig.4).Conclusion and Discussion
Automated processing of myocardial T1ρ mapping demonstrates strong agreement with manual processing, bolstered by time efficiency and comparable segmentation quality, highlighting its promising clinical viability for non-invasive, “needle-free”, and rapid on-site assessment of structural heart disease. Further validations in various centers and scanners are warranted.Acknowledgements
This work was supported by funding from the French National Research Agency under grant agreements Equipex MUSIC ANR-11-EQPX-0030, ANR-21-CE17-0034-01, Programme d’Investissements d’Avenir ANR-10-IAHU04-LIRYC, ANR-22-CPJ2-0009-01, and from the European Research Council (ERC) under the European Union’s Horizon 2020 research and innovation program (grant agreement N°101076351).References
1. Bustin A, Witschey WRT, Van Heeswijk RB, Cochet H, Stuber M. Magnetic resonance myocardial T1ρ mapping: Technical overview, challenges, emerging developments, and clinical applications. J Cardiovasc Magn Reson. 2023;25(1):34. doi:10.1186/s12968-023-00940-1
2. Bustin A, Toupin S, Sridi S, et al. Endogenous assessment of myocardial injury with single-shot model-based non-rigid motion-corrected T1 rho mapping. J Cardiovasc Magn Reson. 2021;23(1):119. doi:10.1186/s12968-021-00781-w
3. Kellman P, Arai AE, McVeigh ER, Aletras AH. Phase-sensitive inversion recovery for detecting myocardial infarction using gadolinium-delayed hyperenhancement. Magnetic resonance in medicine. 2002;47(2):372-383. doi:10.1002/mrm.10051
4. Dosovitskiy A, Beyer L, Kolesnikov A, et al. An Image is Worth 16x16 Words: Transformers for Image Recognition at Scale. Published online 2020. doi:10.48550/ARXIV.2010.11929
5. Xue H, Artico J, Fontana M, Moon JC, Davies RH, Kellman P. Landmark Detection in Cardiac MRI by Using a Convolutional Neural Network. Radiology: Artificial Intelligence. 2021;3(5):e200197. doi:10.1148/ryai.2021200197
6. Ronneberger O, Fischer P, Brox T. U-Net: Convolutional Networks for Biomedical Image Segmentation. Medical Image Computing and Computer-Assisted Intervention. Published online 2015:234-241. doi:10.1007/978-3-319-24574-4_28
7. American Heart Association Writing Group on Myocardial Segmentation and Registration for Cardiac Imaging:, Cerqueira MD, Weissman NJ, et al. Standardized Myocardial Segmentation and Nomenclature for Tomographic Imaging of the Heart: A Statement for Healthcare Professionals From the Cardiac Imaging Committee of the Council on Clinical Cardiology of the American Heart Association. Circulation. 2002;105(4):539-542. doi:10.1161/hc0402.102975
8. Hansen MS, Sørensen TS. Gadgetron: an open source framework for medical image reconstruction. Magnetic resonance in medicine. 2013;69(6):1768-1776. doi:10.1002/mrm.24389
Figures