1007
A Multi-Parametric MRI Deep Learning Fusion Model for Grading Arterial Transit Artifacts1Institute of Research and Clinical Innovations, Neusoft Medical Systems Co., Ltd, Shanghai, China
Synopsis
Keywords: Diagnosis/Prediction, Machine Learning/Artificial Intelligence
Motivation: ATAs are essential indicators of collateral pathways in cerebral perfusion anomalies. However, the conventional grading systems for ATA suffer from subjectivity, which may subjectively leads to variability
Goal(s): We aim to standardize ATA grading by a deep learning fusion model that combines information from ASL and DWI
Approach: A deep learning fusion model was developed, which applies two 3D CNNs to extract respective feature map of each modality; this model combines the high-level feature maps to fuse the multi-sequence MRI information
Results: The fusion model shows significant improvements over a single modality model, achieving an AUC value of 0.895
Impact: The good ATA evaluation performance of the deep learning fusion model shows its clinical potential in assisting neuroradiologists in conducting the treatment and prognosis analysis for patients with ischemic stroke
Background or purpose
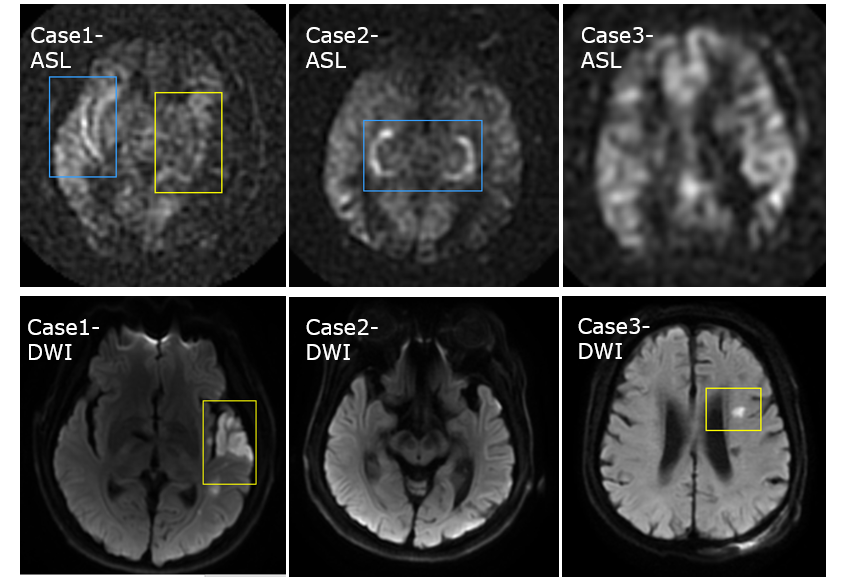
Arterial transition artifacts (ATAs) on ASL MRI, widely used in evaluating acute and subacute ischemic stroke, reveals collateral pathways in cerebral perfusion anomalies 1,2. The simplified two-point grading system is popular for assessing collateral grades based on ATA 3,4. However, the personal experience and subjectivity of raters plays a major role in the grading process, resulting in large individual variation in the grading results. To the best of our knowledge, there is no prior research that utilized AI techniques for ATA grading from DWI and ASL images. In order to achieve an accurate and consistent assessment of ATA with a simple two-point system, this study developed a deep learning fusion model that efficiently fused information from DWI and ASL images for achieving an automated ATA grading goal.Materials and Methods
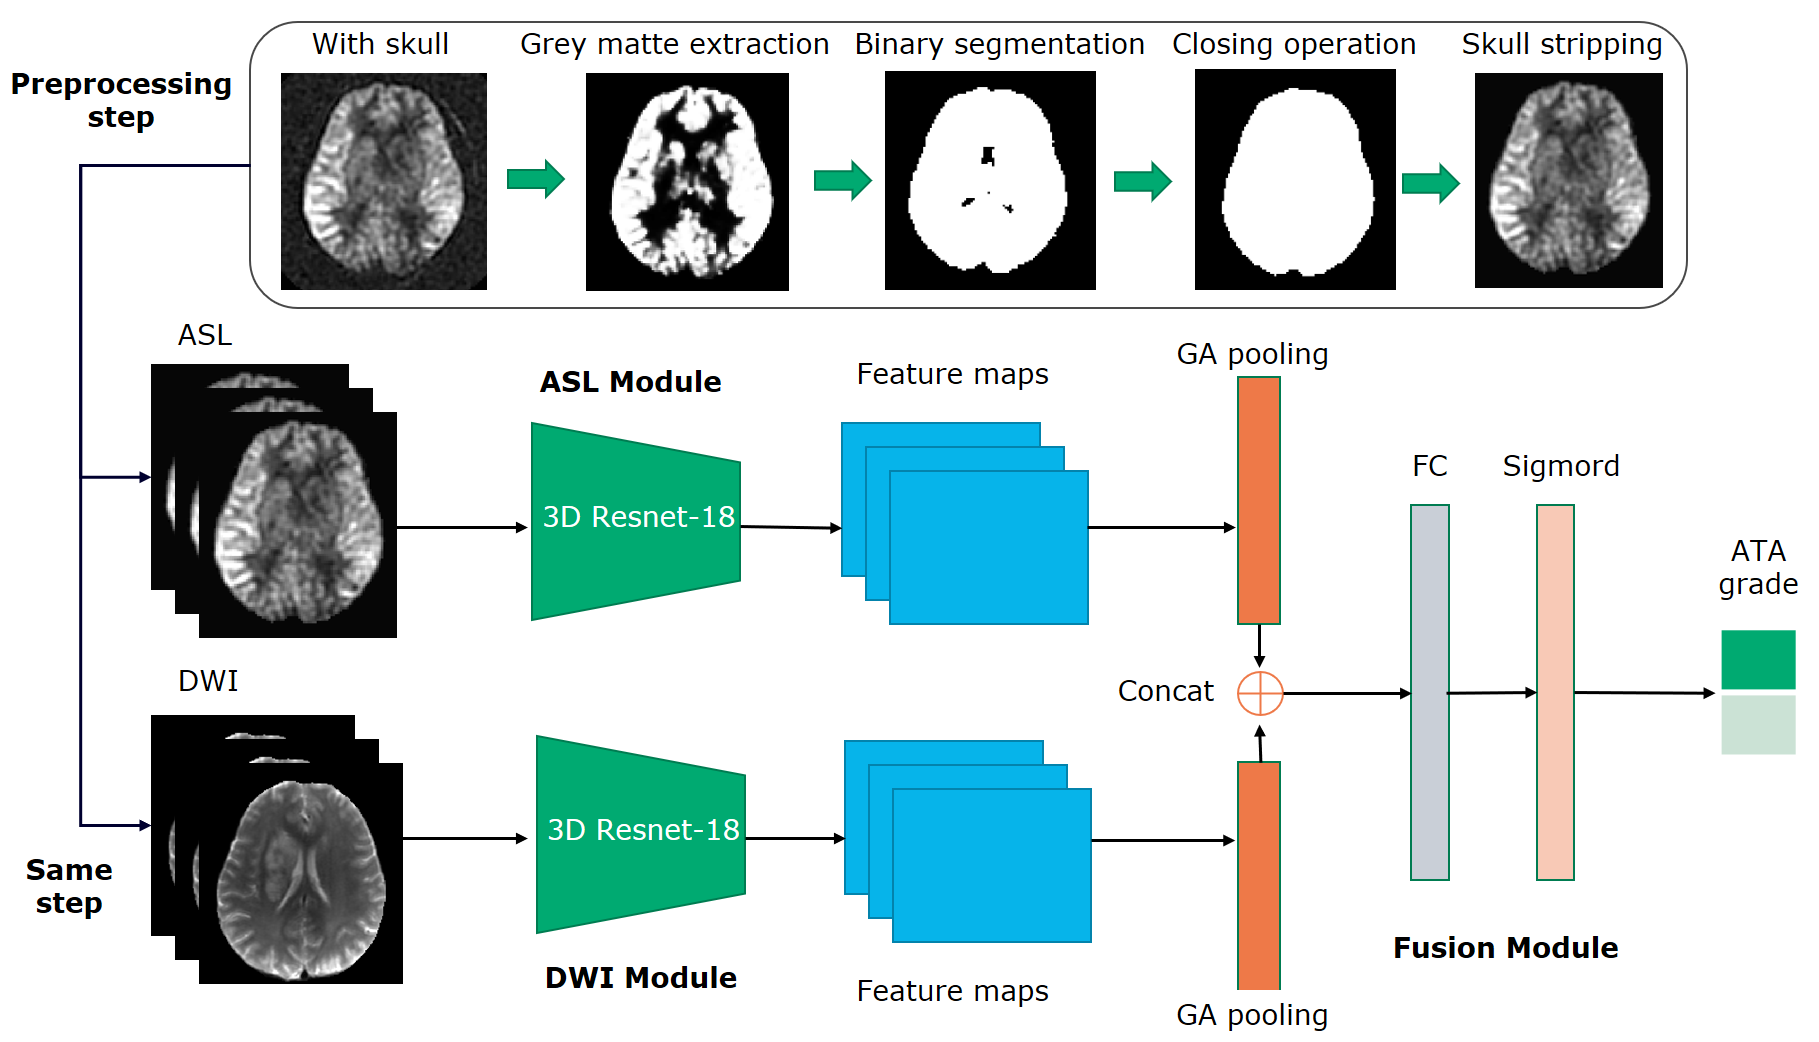
Subjects: In this retrospective study, a total of 650 subjects from three medical center were divided into 454 training set, 98 validation set and 98 test set, in which ASL and DWI data were obtained from each subject. Neuroradiologist analysis: Two neuroradiologists with five-year experience were blinded to clinical status and MRI images rated ATA. Collaterals was classified into 2 categories, absent or present depending on the ASL image without or with ATAs 5. Algorithm: The workflow of the proposed method is depicted in Figure 1. It was a multi-channel convolutional neural network (CNN) composed of three main modules, i.e. the ASL feature extraction module, the DWI feature extraction module, and the feature fusion module. The ASL and the DWI modules were dedicated to extracting features from ASL and DWI images, respectively. The feature fusion module aimed to leverage the complementary information from DWI to enhance the capability for ASL in evaluating the ATA grade by combining the extracted ASL and DWI image features. Specifically, feature extraction modules based on pre-trained 3D Resnet-18 6 were used to extract two channels’ features, and the final output of the two channels was then subjected to a global average pooling layer to reduce dimensionality. Subsequently, the top-layer feature maps from both DWI and ASL modules were concatenated. Finally, we employed a fully connected layer with an output size of two, followed by a sigmoid activation function to generate classification probabilities based on the fused features. The binary cross-entropy loss function was utilized, with the Adam optimizer having an initial learning rate of 0.001. The batch size was set at 8. The training process stopped when the AUC in the verification set did not increase for 30 consecutive epochs. The grey matter extraction was accomplished by SPM12 (http://www.fil.ion.ucl.ac.uk/spm/software/spm12). Statistical analysis: The performance of the proposed fusion model was compared with the baseline of single-modality model that only used single 3D Resnet-18 with ASL image inputting for training. The receiver operating characteristic (ROC) analysis, area under the curve (AUC), accuracy, precision, recall, F1 were utilized to evaluate the classification performance.Results
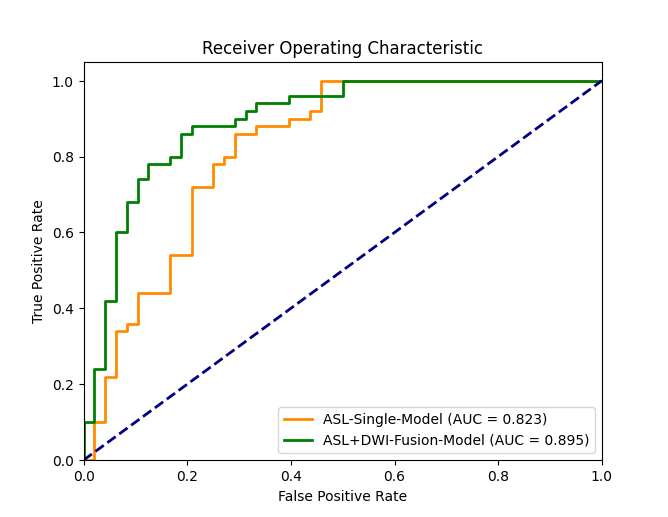
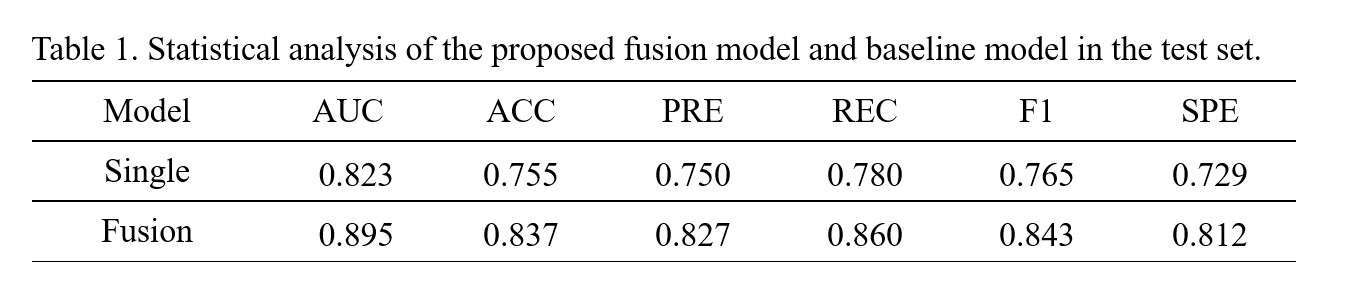
Compare to the single-modality model, the fusion model has achieved superior performance metrics (AUC=0.895 vs 0.823; ACC=0.837 vs 0.755; precision=0.827 vs 0.750; recall=0.860 vs 0.780; F1 score=0.843 vs 0.765; specificity=0.812 vs 0.729) (see Table 1 & Figure 3). Furthermore, the fusion model has achieved a good consistency with neuroradiologists, as indicated by a Kappa coefficient of 0.673 (95% CI: 0.528–0.796).Discussion
In this study, we proposed a strategy to fuse the high-level feature maps from ASL and DWI, to make DWI serve as supplementary guidance information to enhance the feature maps from the ASL and help the network to learn the ATA classification task well. Experimental results demonstrated that the fusion model outperformed the single-modality model. This can be attributed to two key factors. Firstly, adding additional DWI information is valuable in ATA evaluation, which may be explained by ATA primarily focuses on vascular and cerebral blood flow conditions 7, and the microstructure of brain tissue can influence the permeability and diffusivity of blood flow 8, so the microstructure information provided by DWI is useful to assist ATA evaluation 9,10. Secondly, the fusion strategy that concatenate the top-layer feature maps from the two channels can preserve the information unique to each channel, therefore improving the performance well. Furthermore, the ATA evaluation outcomes achieved with the fusion model was in good consistency with the outcomes obtained from a neuroradiologists, demonstrating clinical potential in assisting the treatment and prognosis of patients with ischemic stroke. In future studies, we will refine the deep learning model to achieve the goal of visualizing ATA grades and conducting ATA evaluations on a four-point scale 11.Acknowledgements
No acknowledgement found.References
[1] Bang O Y, Goyal M, Liebeskind D S. Collateral circulation in ischemic stroke: assessment tools and therapeutic strategies[J]. Stroke, 2015, 46(11): 3302-3309.
[2] Wu, D., Zhou, Y., Zhang, G., Shen, N., Lu, J., Yan, S., Xie, Y., Gao, L., Liu, Y., Liu, C., Zhang, S., & Zhu, W. (2023). Collateral circulation predicts 3-month functional outcomes of subacute ischemic stroke patients: A study combining arterial spin labeling and MR angiography
[3] Zaharchuk G, Do H M, Marks M P, et al. Arterial spin-labeling MRI can identify the presence and intensity of collateral perfusion in patients with moyamoya disease[J]. Stroke, 2011, 42(9): 2485-2491.
[4] Ukai R, Mikami T, Nagahama H, et al. Arterial transit artifacts observed by arterial spin labeling in Moyamoya disease[J]. Journal of Stroke and Cerebrovascular Diseases, 2020, 29(9): 105058.
[5] Roach B A, Donahue M J, Davis L T, et al. Interrogating the functional correlates of collateralization in patients with intracranial stenosis using multimodal hemodynamic imaging[J]. American Journal of Neuroradiology, 2016, 37(6): 1132-1138.
[6] Yang J, Shi R, Wei D, et al. MedMNIST v2-A large-scale lightweight benchmark for 2D and 3D biomedical image classification[J]. Scientific Data, 2023, 10(1): 41.
[7] Telischak N A, Detre J A, Zaharchuk G. Arterial spin labeling MRI: clinical applications in the brain[J]. Journal of Magnetic Resonance Imaging, 2015, 41(5): 1165-1180.
[8] Giezendanner S, Fisler M S, Soravia L M, et al. Microstructure and cerebral blood flow within white matter of the human brain: a TBSS analysis[J]. PLoS One, 2016, 11(3): e0150657.
[9] Drake-Pérez M, Boto J, Fitsiori A, et al. Clinical applications of diffusion weighted imaging in neuroradiology[J]. Insights into imaging, 2018, 9: 535-547.
[10] Huisman T. Diffusion-weighted and diffusion tensor imaging of the brain, made easy[J]. Cancer Imaging, 2010, 10(1A): S163.
[11] Zaharchuk G. Arterial transit awesomeness[J]. Radiology, 2020, 297(3): 661-662.
Figures