1004
Brain structure-function interaction network via graph convolution network for Parkinson’s disease classification1School of Computer Science and Engineering, Nanyang Technological University, Singapore, Singapore
Synopsis
Keywords: Diagnosis/Prediction, Multimodal, functional connectivity, structural connectivity, graph convolution network, Parkinson's disease
Motivation: Brain functional connectivity (FC) and structural connectivity (SC) have distinct neural mechanisms for Parkinson’s disease (PD). Furthermore, the interactions between SC and FC could reveal underlying mechanisms and enhance classification performance.
Goal(s): We aim to utilize structure-function interactions for PD classification.
Approach: We propose a brain structure-function interaction model via graph convolution network to incorporate both modality-specific embeddings and structure-function interactions.
Results: Results on 72 PD patients and 69 normal controls demonstrate that our method outperforms other state-of-the-art methods. We identify strong structure-function couplings in the precentral gyrus, prefrontal, superior temporal, cingulate cortices, and cerebellum that are associated with PD.
Impact: We proposed a novel brain structure-function interaction network based on GCN to utilize modality-specific features and interactions of SC and FC for PD classification. Our method identified the coupling strengths between SC and FC associated with PD.
Introduction
Cognitive deficits are common non-motor symptoms of Parkinson's disease (PD), greatly affecting functioning and quality of life. Resting-state functional magnetic resonance imaging (rs-fMRI) and diffusion MRI (dMRI) have become essential tools for exploring differences in brain function and structure, aiding in distinguishing individuals with PD and healthy persons. This facilitates the characterization of the underlying causes of PD [1, 2]. Functional connectivity (FC) illustrates temporal dependency patterns between regional blood-oxygenation-level-dependent signals, measured through rs-fMRI, while structural connectivity (SC) represents the integrity of regional white matter pathways estimated from dMRI. SC and FC not only have their specific markers for PD [1, 2], but their interaction may also reveal different neural mechanisms associated with PD, considering the inherent linkage between neural function and structure [3-6]. Studying the changes in the structure-function interactions in patients with PD may provide potential biomarkers that detect subtle brain connectivity disruption more sensitive than those found by a single modality and facilitate a mechanistic understanding of the dynamic change in clinical manifestations. Therefore, we aim to integrate not only SC- and FC-specific features but also structure-function interactions to classify subjects with PD and healthy persons.Methods
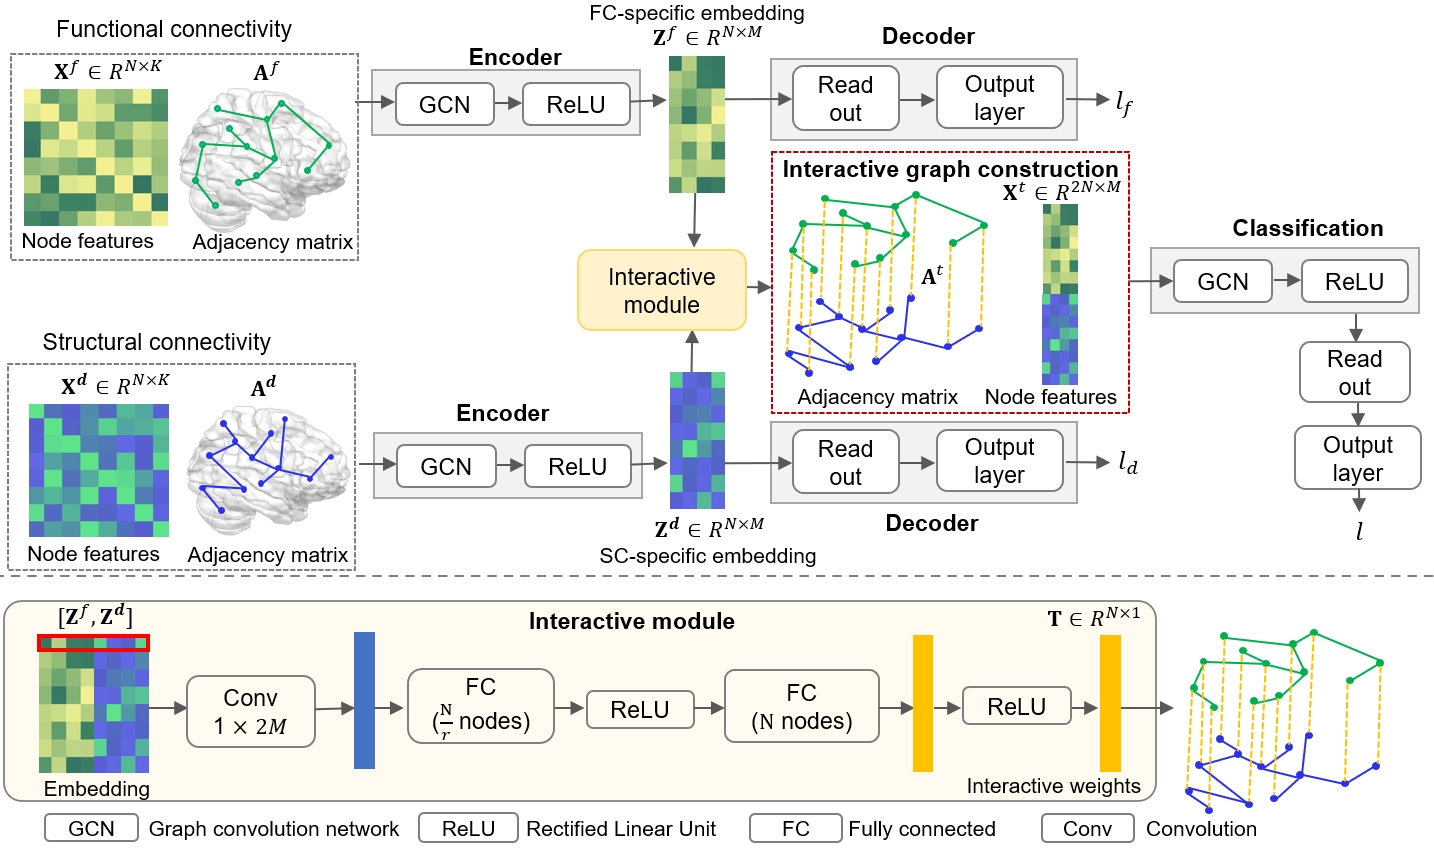
We used a dataset of 72 PD patients and 69 normal controls from the Parkinson's Progressive Markers Initiative (PPMI) [7], which includes T1w, rs-fMRI, and DTI images, to evaluate the proposed method. Both rs-fMRI and dMRI images underwent preprocessing using fMRIPrep and Clinica software, respectively. FC and SC were constructed based on 116 Regions of Interest (ROIs) by using the Automated Anatomical Labeling (AAL) atlas [8].The end-to-end structure-function interaction network is designed to learn the interactive weights between SC and FC while utilizing modality-specific characteristics for PD classification, as shown in Figure 1. We design a graph convolution encoder-decoder module that ensures the output aligns closely with the true label. This module performs on SC and FC separately to extract the modality-specific task-relevant embeddings. Subsequently, an interaction module that utilizes a bottleneck multilayer perceptron (MLP) model is employed to learn the interactive weights between corresponding regions of SC and FC. A higher interactive weight indicates stronger coupling strength between the corresponding regions of two modalities. By inserting the interactive weights as edges connecting corresponding regions of SC and FC, an interactive graph is constructed. This graph not only reflects the modality-specific task-related embeddings of the nodes but also integrates the learned coupling strength between them. Finally, a one-layer GCN and output layer are used on the interactive graph to produce the final classification.
Results
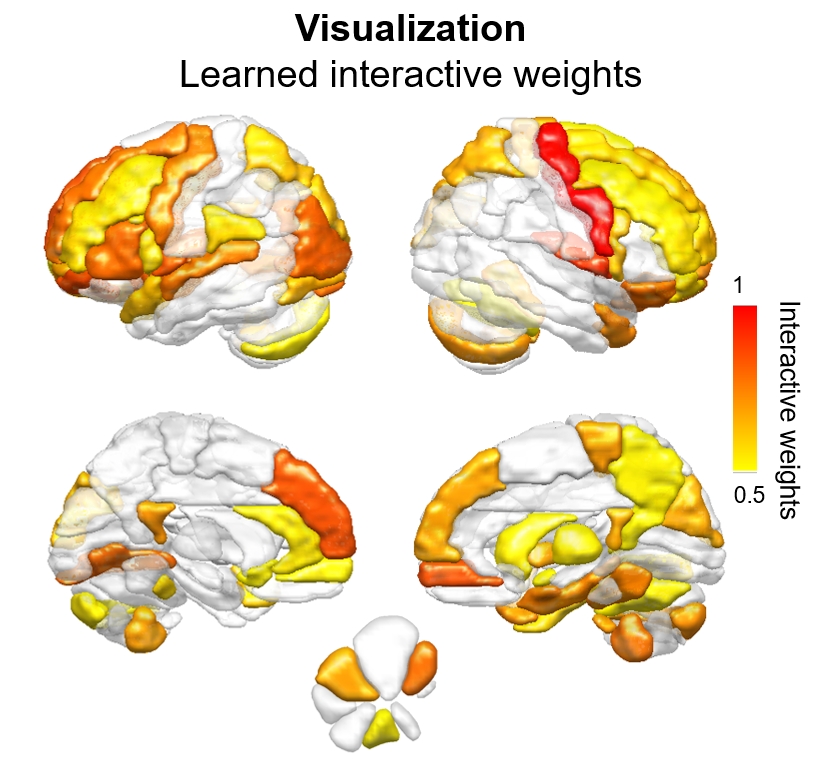
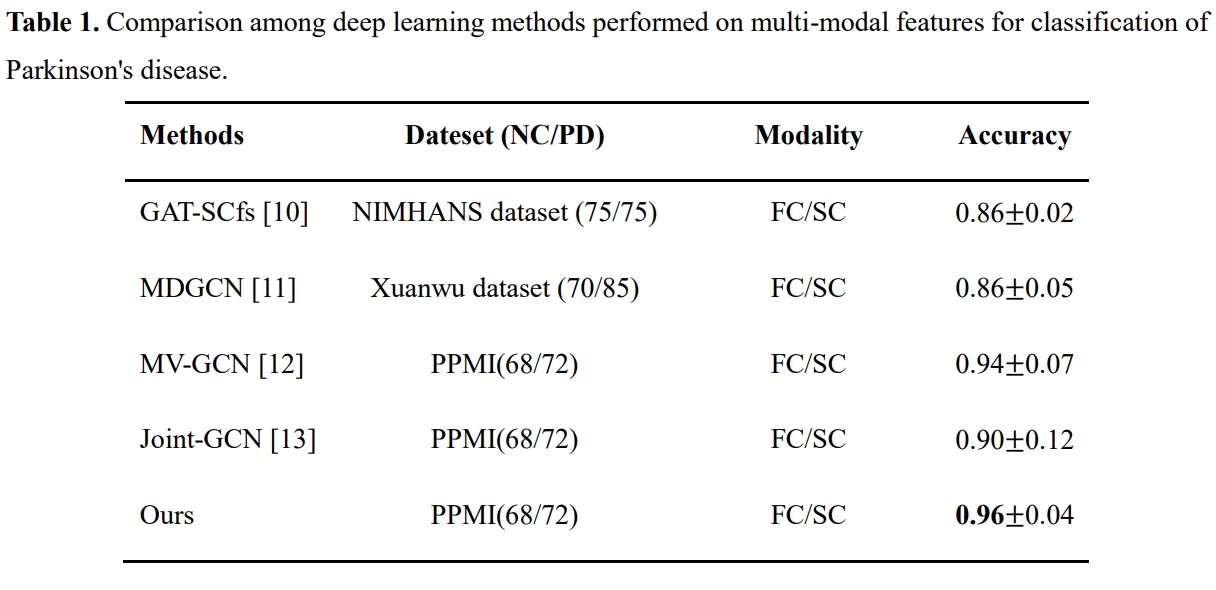
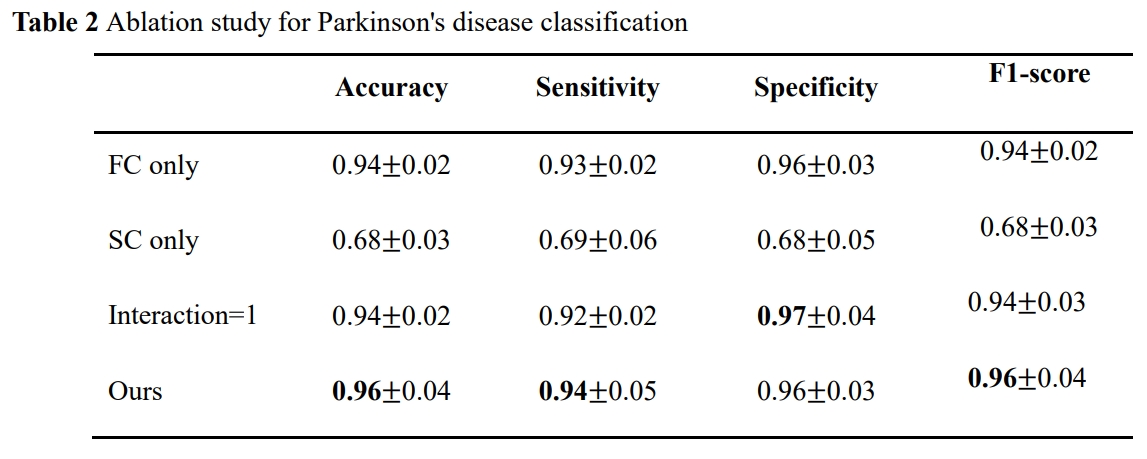
Table 1 shows the results compared against four state-of-the-art multi-modal fusion approaches for PD classification. GAT-SCfs [9] generates node embeddings from the structural connectivity and multimodal feature set, containing morphological features and functional network features of PD patients and healthy controls, and then uses graph attention network for classification. Multi-modal Dynamic Graph Convolution Network (MDGCN) [10] parses multi-modal representations into dynamic graphs and performs graph aggregation for message passing. Multi-View GCN (MV-GCN) [11] applies two separate GCNs to extract features from SC and FC and concatenates them for the final classification. Joint-GCN [12] early fuses SC and FC with joint weight inserted for classification via GCN. The classification results of GAT-SCfs and MDGCN are obtained from [9] and [10]. We implement MV-GCN and joint-GCN and perform them on our dataset. In comparison to these approaches, our framework utilizes both modality-specific and interactions of FC and SC, and gets the highest accuracy, as shown in bold. Table 2 shows the ablation study results that evaluate the classification performance. Here, four different training settings are used: graph convolution encoder-decoder performed on 1) uni-modal FC and 2) uni-modal SC; structure-function interaction network performed on the graph with 3) all interactive weights set to 1 and 4) learned interactive weights (ours). As results in Table 2, our structure-function interaction network can achieve the highest accuracy, sensitivity, and F1-score at 96%, 94%, and 96%, respectively. We visualize learned interactive weights, as shown in Figure 2. It indicates that regions with strong structure-function coupling strength associated with PD are located in the prefrontal cortex, precentral gyrus, cingulate, superior temporal cortices, and cerebellum. These results aligned with existing studies on structure-function coupling markers for PD [5, 6], reinforcing the biological significance of our interaction maps.Discussion and Conclusion
We introduce a novel brain structure-function interaction network to capture the coupling strength between SC and FC, while incorporating modality-specific characteristics to classify PD and healthy persons. Experimental results validate the effectiveness of our proposed method, demonstrating its superiority over four methods for multi-modal brain features.Acknowledgements
This research is supported by AcRF Tier-2 grant MOE T2EP20121-0003 of Ministry of Education, Singapore.References
[1] Tessitore, Alessandro, Mario Cirillo, and Rosa De Micco. "Functional connectivity signatures of Parkinson’s disease." Journal of Parkinson's disease 9.4 (2019): 637-652.
[2] Yang, Yanwu, et al. "Alteration of brain structural connectivity in progression of Parkinson's disease: A connectome-wide network analysis." NeuroImage: Clinical 31 (2021): 102715.
[3] Droby, Amgad, et al. "The interplay between structural and functional connectivity in early stage Parkinson's disease patients." Journal of the Neurological Sciences 442 (2022): 120452.
[4] Herrington, Todd M., Jessica Briscoe, and Emad Eskandar. "Structural and functional network dysfunction in Parkinson disease." Radiology 285.3 (2017): 725-727.
[5] Fiorenzato, Eleonora, et al. "Dynamic functional connectivity changes associated with dementia in Parkinson’s disease." Brain 142.9 (2019): 2860-2872.
[6] Zarkali, Angeliki, et al. "Organisational and neuromodulatory underpinnings of structural-functional connectivity decoupling in patients with Parkinson’s disease." Communications biology 4.1 (2021): 86.
[7] Marek, Kenneth, et al. "The Parkinson progression marker initiative (PPMI)." Progress in neurobiology 95.4 (2011): 629-635.
[8] Tzourio-Mazoyer, Nathalie, et al. "Automated anatomical labeling of activations in SPM using a macroscopic anatomical parcellation of the MNI MRI single-subject brain." Neuroimage 15.1 (2002): 273-289.
[9] Safai, Apoorva, et al. "Multimodal Brain Connectomics-Based Prediction of Parkinson’s Disease Using Graph Attention Networks." Frontiers in Neuroscience 15 (2022): 741489.
[10] Yang, Yanwu, et al. "Multi-modal Dynamic Graph Network: Coupling Structural and Functional Connectome for Disease Diagnosis and Classification." 2022 IEEE International Conference on Bioinformatics and Biomedicine (BIBM). IEEE, 2022.
[11] Liu, Jiahao, et al. "Community-preserving graph convolutions for structural and functional joint embedding of brain networks." 2019 IEEE International Conference on Big Data (Big Data). IEEE, 2019.
[12]Li, Yueting, et al. "Joint Graph Convolution for Analyzing Brain Structural and Functional Connectome." International Conference on Medical Image Computing and Computer-Assisted Intervention. Cham: Springer Nature Switzerland, 2022.
Figures