1000
Detecting magnetization exchange between human brain tissue and CSF compartments using selective parenchyma spin labeling and CSF imaging1Advanced Imaging Research Center, UT Southwestern Medical Center, Dallas, TX, United States, 2Department of Radiology, UT Southwestern Medical Center, Dallas, TX, United States
Synopsis
Keywords: Neurofluids, Neurofluids, CSF, MT, magnetization transfer
Motivation: While challenging in humans, measuring fluid exchange between the brain parenchyma tissue and CSF compartments is essential for understanding the role of CSF-mediated metabolic waste clearance in neurodegeneration.
Goal(s): We demonstrate the feasibility of detecting such fluid exchange in human brains, unaffected by CSF-flow and partial-volume artifacts.
Approach: Free-water spins inside parenchyma were selectively saturated and labeled by magnetization transfer, and subsequent partial saturations were quantified within CSF compartments.
Results: We found 3.6% saturation in subarachnoid space (SAS), significant saturation difference between SAS and lateral ventricles (1.3%), and higher saturations in slow-flowing, narrow compartments (e.g. SAS and longitudinal fissure) than larger ventricle spaces.
Impact: We demonstrated feasibility of detecting fluid exchange between brain parenchyma and CSF compartments in human brains through selective parenchyma saturation and CSF saturation quantification. Measuring such exchange is important for understanding the role of CSF-mediated metabolic waste clearance in neurodegeneration.
Introduction
Cerebrospinal fluid (CSF) plays a vital role in clearing metabolic waste from the brain [1, 2], and the interruption of this process has been suggested to contribute towards neurodegeneration. In-vivo measurement of the exchange between CSF and brain parenchymal tissue is important to establish the clinical value of this clearance process. While this exchange has been studied using tissue-selective magnetization labeling MRI methods in mice [3], such studies are challenging in humans due to faster-flowing CSF and partial volume effects [4]. Consequently, only indirect probing of such exchange, such as measuring CSF T1 and T2, have been reported [5].In this study, we demonstrated the feasibility for detecting the magnetization exchange between the brain tissue and CSF compartments by selectively saturating parenchyma magnetization through a magnetization transfer (MT) process and subsequently quantifying the transferred saturation using a CSF-selective imaging sequence. The spins labeled inside the parenchyma were allowed to travel from the source, before T2-selective CSF imaging sequence measured the partial saturations within CSF compartments.Methods
Parenchyma spins were selectively saturated by repeated saturation units that allowed maximal saturation of parenchyma protons at the end of the saturation module. Each unit consisted of 16 binomial on-resonance short-T2-selective saturation RF pulses [6] (B1=13mT, total duration 6ms) and was repeated 12 times with 250ms gap, over a period of 3072ms. Following the saturation, T2-preparation (T2-prep) module with TE=800ms suppressed the parenchyma signal prior to readout to prevent partial volume effects. Both modules were non-slice-selective to label all parenchyma locations and to eliminate CSF in-flow artifacts.Using a Philips Achieva 3.0T scanner, the saturation-labeled, T2-prepared spins were acquired in CSF compartments using a single-slice single-shot spin-echo (SE) echo-planar-imaging (EPI) sequence (Figure 1), with in-plane 2.0x2.0mm resolution, 3.0mm slice thickness, TE/TR=22ms(effective 822ms)/30000ms, and SENSE factor=3. The T2-prep module used 6 adiabatic refocusing pulses and shortest-duration rectangular 90° RF pulses (maximum B1 strength) for maximal bandwidth and fat excitation/saturation. To help reduce physiology and motion artifacts, the scans were performed in 10 dynamics with saturation pulses interleaved on/off, to obtain 5 sets of on/off measurement pairs for averaging (6-min scan time). In six IRB-approved healthy human subjects (ages 20-30, males), 2-3 axial and 2 sagittal images were acquired to include different CSF compartments described below.The dynamic images were in-plane motion corrected using signal magnitudes. Using the average signal magnitudes of saturation -on and -off images (Son and Soff), the relative signal reduction compared to the saturation-off reference was quantified as saturation ratio (SR): (Soff – Son)/Soff. Using masks obtained by thresholding the CSF images followed by manual correction, SR’s were computed in each subject for the following CSF compartments: lateral ventricle (LV), subarachnoid space (SAS), longitudinal fissure (LF), third ventricle (V3), fourth ventricle (V4) and temporal horn (TH). In 2 test subjects, SR was measured with varying T2-prep TEs (200-1000ms) to validate minimum T2-prep TE for sufficient parenchyma and partial volume suppression.Results
When T2-prep TE varied (Figure 2), saturation ratios showed a rapid decline over 200-600ms range, indicating sufficient parenchyma suppression at TE>600ms. Figure 3 shows example saturation ratio images acquired in this study. When averaged by compartments within each subject, the SR distributions across 6 subjects are shown in Figure 4 as boxplots. At cohort level, we found average 3.61% saturation ratio in SAS, significant difference (p = 0.0008) between LV (1.3%) and SAS (3.6%), and higher saturations in LF and SAS than other ventricle spaces. In reference, Block simulation estimated 0.7% direct CSF saturation, assuming no CSF-tissue exchange at T1=4.5s and T2=1.0s.Discussion
Selective magnetization labeling of macromolecule protons inside parenchyma and subsequent CSF-selective imaging allowed sensitive detection of magnetization exchange between parenchyma and CSF compartments. Immediate T2 preparation “locks in” the existing spin saturation status, while allowing such saturation-labeled spins to travel into different CSF spaces. Since mass exchange only occurs through contact surface, large or fast-flowing CSF compartments (such as LV, LH, V3, and V4) understandably showed lowest SR’s. Conversely, highest saturations were observed in slow-flowing, narrow compartments such as SAS and LF, with higher surface-to-volume contact with parenchyma. With the single-slice acquisition scheme, subject motion challenged measurement stability. Averaging repeated scans reduced motion effect (Figure 5).Conclusion
Quantifying CSF saturation after selective parenchyma saturation allowed magnetization exchange between parenchyma and CSF to be examined. We found a significant saturation difference between LV (1.3%) and SAS (3.6%), and generally higher saturations in slow-flowing CSF compartments (e.g. SAS and LF) and lower saturations in larger ventricles (e.g. LV, TH, V3, V4).Acknowledgements
This work was supported in part by Hamon Foundation and Texas Instruments Foundation.References
1. Abate O, Bollo E, Lotti D, Bo S. Cytological, immunocyto-chemical and biochemical cerebrospinal fluid investigations in selected central nervous system disorders of dogs. Zentralbl Veterinarmed B. 1998;45:73- 85
2. Iliff JJ, Wang M, Liao Y, Plogg BA, Peng W, Gundersen GA, Benveniste H, Vates GE, Deane R, Goldman SA, Nagelhus EA, Nedergaard M. A Paravascular Pathway Facilitates CSF Flow Through the Brain Parenchyma and the Clearance of Interstitial Solutes, Including Amyloid β. Sci. Transl. Med., 4 (2012), p.147ra111.
3. Li AM, Chen L, Liu H, LiY, Duan W, Xu J. Age- dependent cerebrospinalfluid- tissue water exchange detected bymagnetization transfer indirect spin labeling MRI. Magn Reson Med. 2022;87:2287- 2298.
4. Liu J. Imaging magnetization exchange between cerebrospinal fluid and brain parenchyma in humans at 3 T. ISMRM & ISMRT Annual Meeting & Exhibition, Toronto, Canada. 2023; Abstract Number 3276.
5. Jiang D, Gou Y, Wei Z,Hou X, Yedavalli V, Lu H. Quantification of T1andT2of subarachnoid CSF: Implications for waterexchange between CSF and brain tissues. MagnReson Med. 2023;90:2411-2419.
6. PV Gelderen, X Jiang, and JH Duyn, “Rapid measurement of brain macromolecular proton fraction with transient saturation transfer MRI,” Magn Reson Med, vol. 77, no. 6, pp. 2174–2185, 2017
Figures

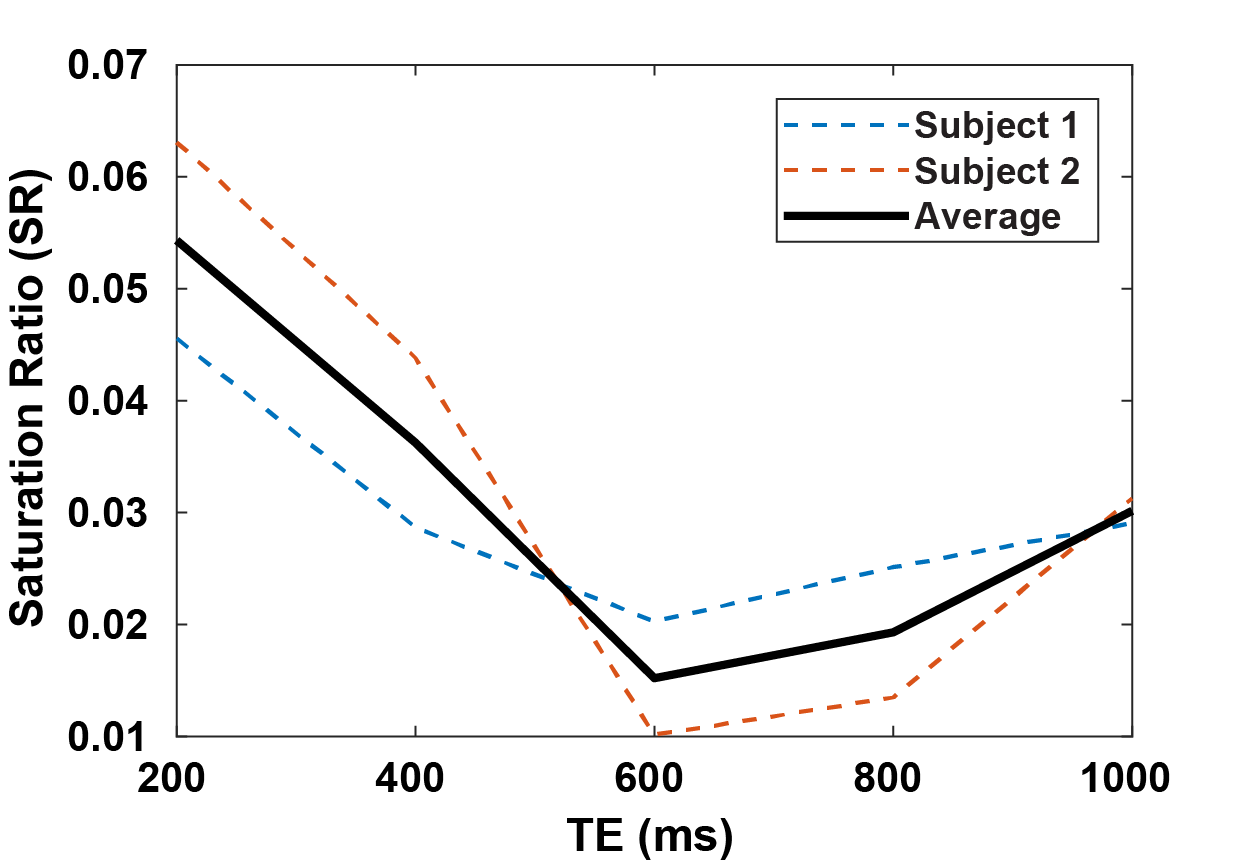
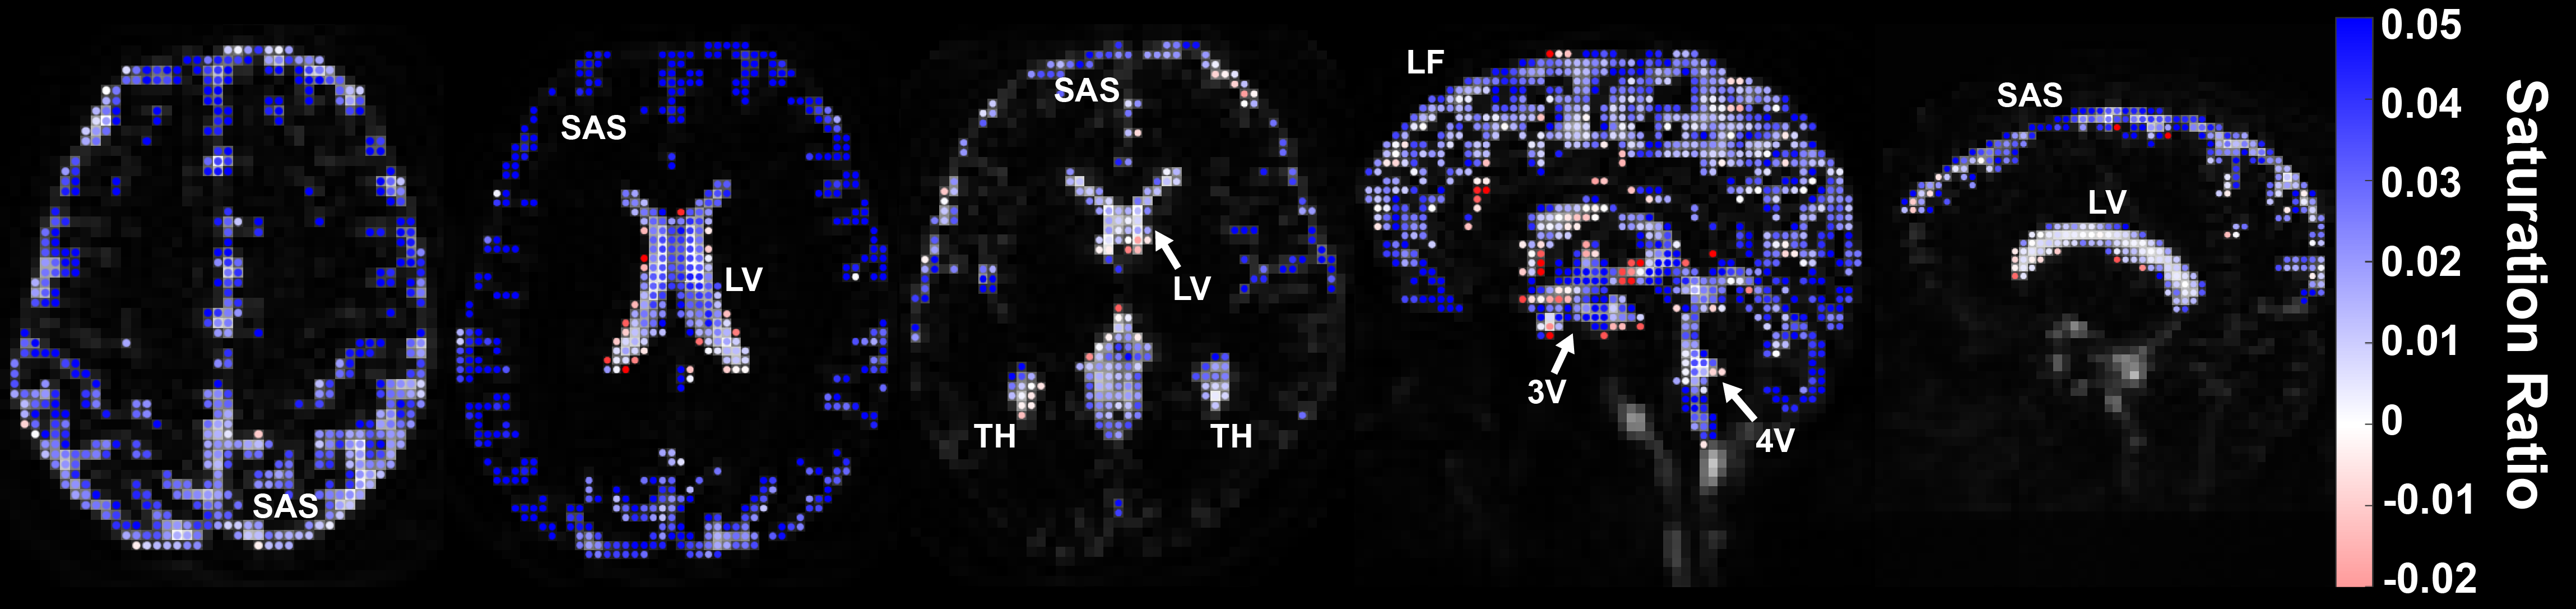
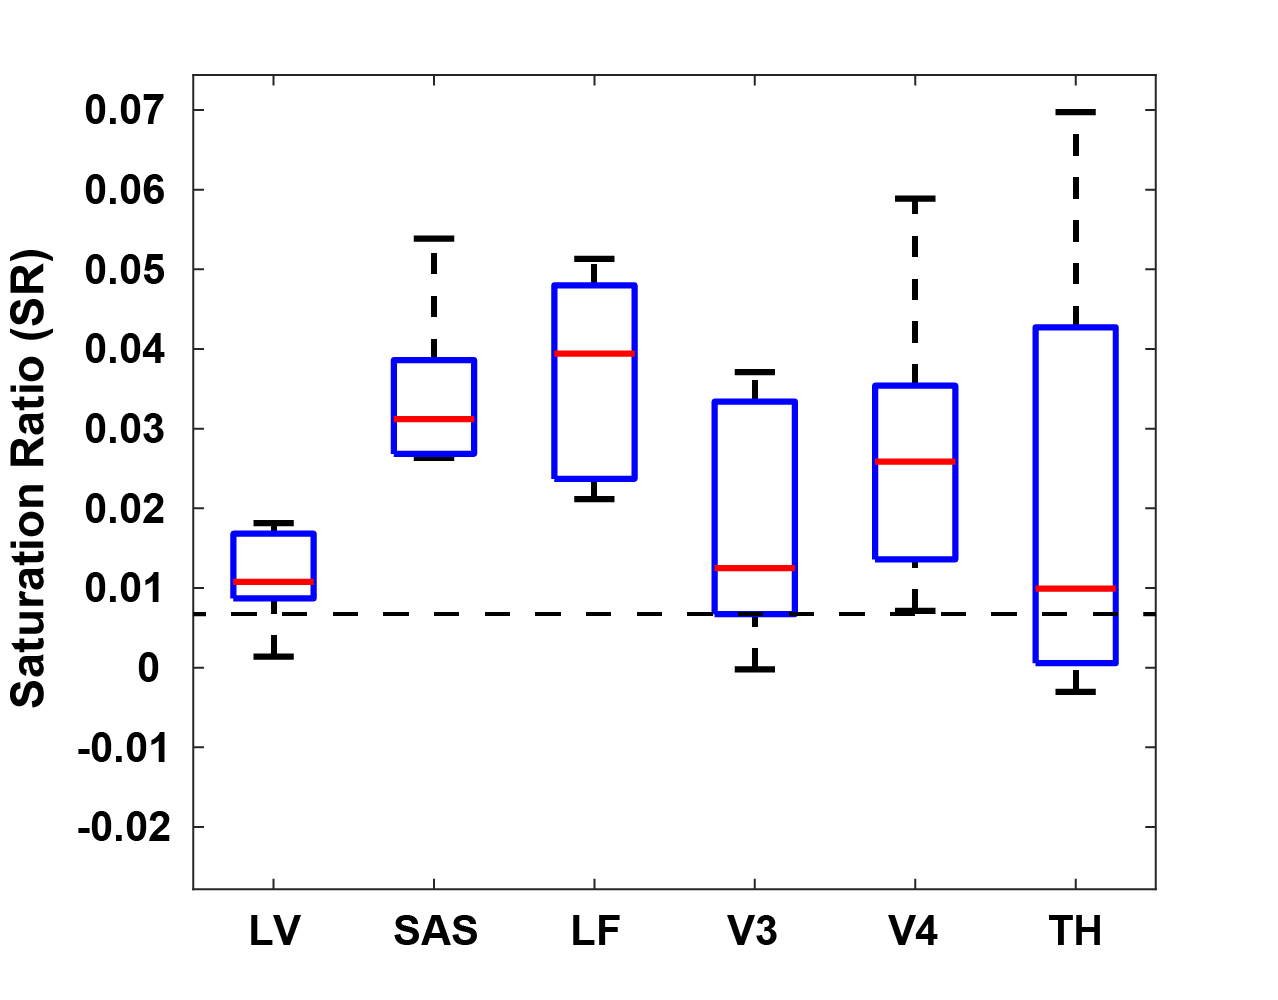
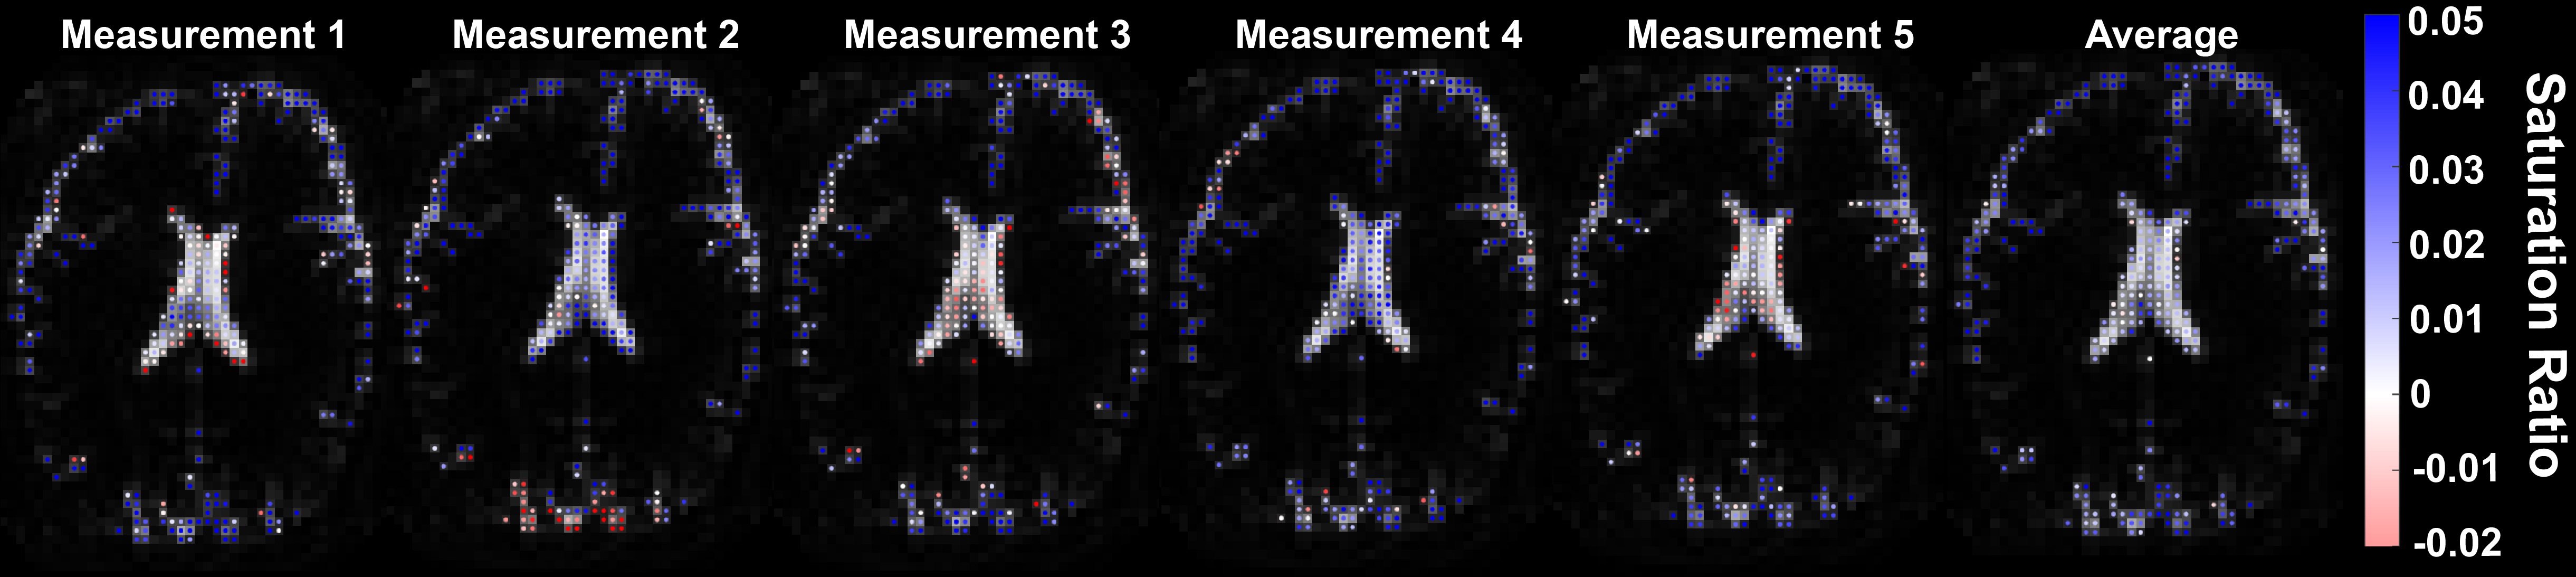
Figure 5. Saturation ratio images shown for 5 consecutive measurements, showing their variability. In this study, 5 sets of saturation on/off images were acquired for each scan. The average signal magnitude of saturation-on and -off images (co-registered) were used to compute the final saturation ratio, as shown on the far right. This averaging helped reduce motion artifacts and stabilize measurements.