0999
Localized convolutional function regression: A computational method for measuring interstitial fluid flow and perfusion in DCE-MRI1City of Hope, Duarte, CA, United States, 2Fralin Biomedical Institute, Virginia Polytechnic Institute, Roanoke, VA, United States, 3College of Charleston, Charlston, NC, United States
Synopsis
Keywords: Neurofluids, Perfusion
Motivation: Aggressive gliomas are known to migrate in the direction of interstitial fluid flow (IFF), though it is difficult to measure interstitial fluid flow using MRI.
Goal(s): Our goal is to develop a computational method for measuring IFF using DCE-MRI.
Approach: We developed localized convolutional function regression (LCFR), validated in silico, in porous hydrogel, and apply it to in vivo tumors.
Results: LCFR accurately measures fluid flow and perfusion to less than 10% error in silico, and measures IFF in a mouse model of glioma to be 1.63E-3 mm/s. In a case study, the method tentatively predicts invasion across the corpus collosum.
Impact: This method will allow physicians and researchers to investigate how highly aggressive gliomas invade healthy tissue, and can be further used to predict how therapeutic agents or cells will disperse throughout the tumor, predicting disease progression and response.
Introduction
It has been shown that interstitial fluid flow is predictive of tumor invasion in the brain and other cancers (1). As such, this important physiological process is important to measure non-invasively and in vivo, as it's measurement may predict regions of invasion, or be predictive of tumor aggression, especially in the case of high grade gliomas and glioblastoma multiforme. Further, interstitial fluid flow also influences the distribution of therapeutic agents and cells (1), thus measuring this flow may be indicative of treatment response. In this abstract, we summarize a method we call Localized Convolutional Function Regression (LCFR), which simultaneously measures fluid flow, diffusion, and perfusion from dynamic contrast-enhanced MRI data. We test the validity of the model in silico, and then apply it to real MR data acquired from a porous hydrogel to assess it's accuracy. We then apply LCFR in vivo, on a preclinical GL261 mouse model, where we histologically validate perfusion measurements using histology. Finally, we apply LCFR to clinical brain tumor data, and present a case study where the fluid velocity field measured in the tumor is highly predictive of cross-hemisphere tumor invasion.Methods
LCFR is a computational data processing method modified from Sparse Identification of Nonliear Dynamics (2, 3) for its application to dynamic contrast-enhanced (DCE) MRI data. As DCE-MRI is often noisy, LCFR utilizes smooth polynomial basis functions to represent the data. First, the Fourier spectrum of the measured MRI signal is measured in all 4 dimensions, 3 space and 1 time, and a cutoff frequency is determined by locating the elbow point of the cumulative Fourier Spectrum. Then, a set of basis functions are constructed from polynomials, approximating a Gaussian filter. This filter is convolved with the data, which filters noise greater than the established subject-specific threshold, and serves to project the data onto a basis function with known derivatives. Finally, a simple linear regression is performed on the projected data and it's smooth derivatives at each voxel to measure the model coefficients of the PDE describing fluid transport within the interstitium:$$\frac{\partial c}{\partial t} = \nabla \cdot D \nabla c - \nabla (\vec{u}\cdot c) + K^{trans} VIF(t)-K_{ep} c + v_p VIF$$
We test the validity of the method on simulations where the coefficients of the above model are known a priori. We then apply the method to actual MRI data, where Gd-DTPA is placed ontop of a porous hydrogel, and the resulting pressure head drives the contrast agent into the well. We then apply the method to a GL261 mouse model of glioma, where mice (N = 6) undergo DCE-MRI on days 7 and 14 after engraftment. After DCE-MRI on day 14, mice are then perfused with Evans Blue, and sacrificed. The resulting MRI scans and histology, including CD31 and Evans Blue, are quantified and compared across subjects. Finally, we apply LCFR to longitudinal DCE-MRI acquired from patients undergoing treatment for recurrent GBM.
Results
In simulations, LCFR was able to accurately measure interstitial fluid flow to less than 10% error, and accurately measure the direction of flow. LCFR was also able to measure Ktrans and vp to within 10% error. We also demonstrate the method's robustness to noise, showing that the accuracy of the method converges with high SNR, and begins to diverge from the truth when the standard deviation of noise exceeds 10% of the maximum signal.In a porous hydrogel, we first estimate the fluid velocity of the Gd-DTPA by measuring the velocity of the apparent contrast front. We then compare the front velocity to the velocity measured by LCFR, and determine that the mean velocity measured by LCFR is within 15% of that of the apparent contrast agent front. Further, the measured diffusion coefficient in the gel was measured to be 1.5E-4 mm2/s, which is in line with literature values of contrast agent diffusion in hydrogel (4).
In vivo, we are able to demonstrate that Evans Blue coverage was correlated with LCFR-meausured Ktrans (n = 17, p = 0.04, r = 0.51). We measure mean IFF in GL261 tumors to be 1.6E-3 +/- 4.0E-4 mm/s.
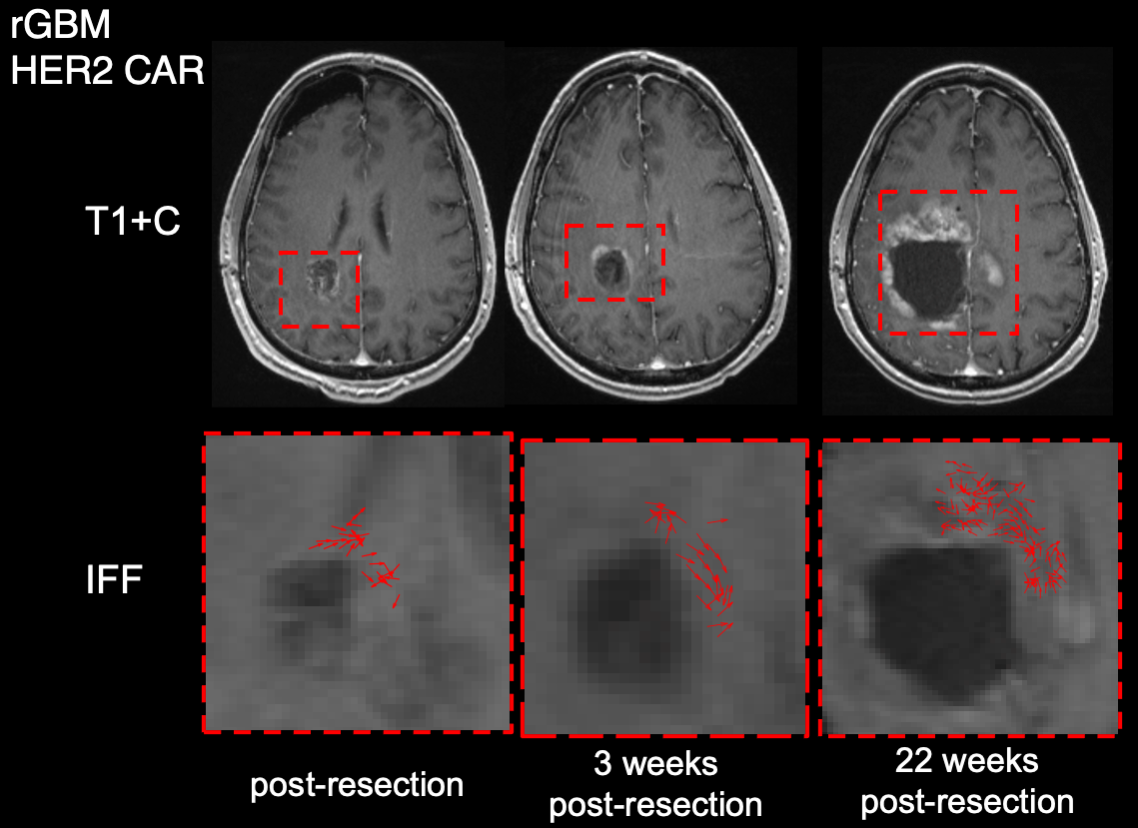
When applied to clinical data, we measure the IFF in post-resection tumor margins to be 6.81E-2 mm/s. In a case study, we demonstrate that the direction of fluid velocity may be highly predictive of tumor invasion across the corpus callosum.
Conclusion
LCFR is a novel methodology, which allows for simultaneous estimation of fluid flow, diffusion, and perfusion from DCE-MRI data. LCFR is accurate, and its application may be predictive of tumor invasion.Acknowledgements
The authors would like to thank the clinicians and researchers who contributed to the creation of the Quantitative Imaging Network Breast-02, and the City of Hope neuro-oncology program. We especially thank all the patients who voluntarily participated in the QIN studies, and their families, for their exemplary strength and generosity. We could not have performed this research without you. Research reported in this publication was supported by the National Institutes of Health under award numbers P30CA033572, R01NS115971 (R.C.R., C.E.B., J.M.)R01CA254271 (C.E.B.) and the California Institute for Regenerative Medicine under awardCLIN2-10248 (C.E.B.). The content is solely the responsibility of the authors and does not necessarily represent the official views of the National Institutes of Health or the California Institute of Regenerative Medicine.References
1. J. M. Munson, R. V. Bellamkonda, M. A. Swartz, Interstitial Flow in a 3DMicroenvironment Increases Glioma Invasion by a CXCR4-Dependent Mechanism.Cancer Res. 73, 1536–1546 (2013).
2. S. L. Brunton, J. L. Proctor, J. N. Kutz, Discovering governing equations from data bysparse identification of nonlinear dynamical systems. Proc. Natl. Acad. Sci. 113, 3932–3937 (2016)
3. D. A. Messenger, D. M. Bortz, Weak SINDy for partial differential equations. J. Comput.Phys. 443, 110525 (2021).
4. M. J. Gordon, K. C. Chu, A. Margaritis, A. J. Martin, C. R. Ethier, B. K. Rutt,Measurement of Gd-DTPA Diffusion Through PVA Hydrogel Using a Novel Magnetic Resonance Imaging Method. Biotechnol. Bioeng. 65, 459–467 (1999).
Figures
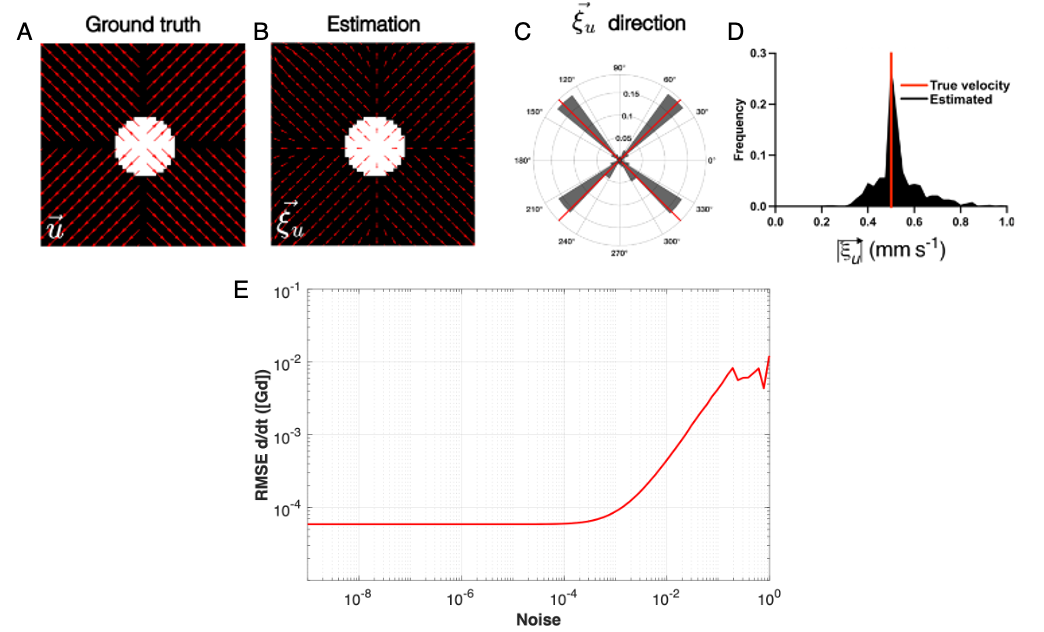
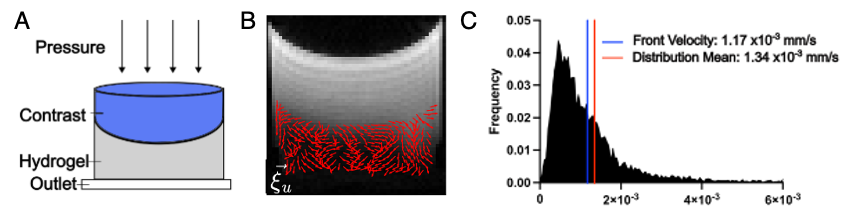
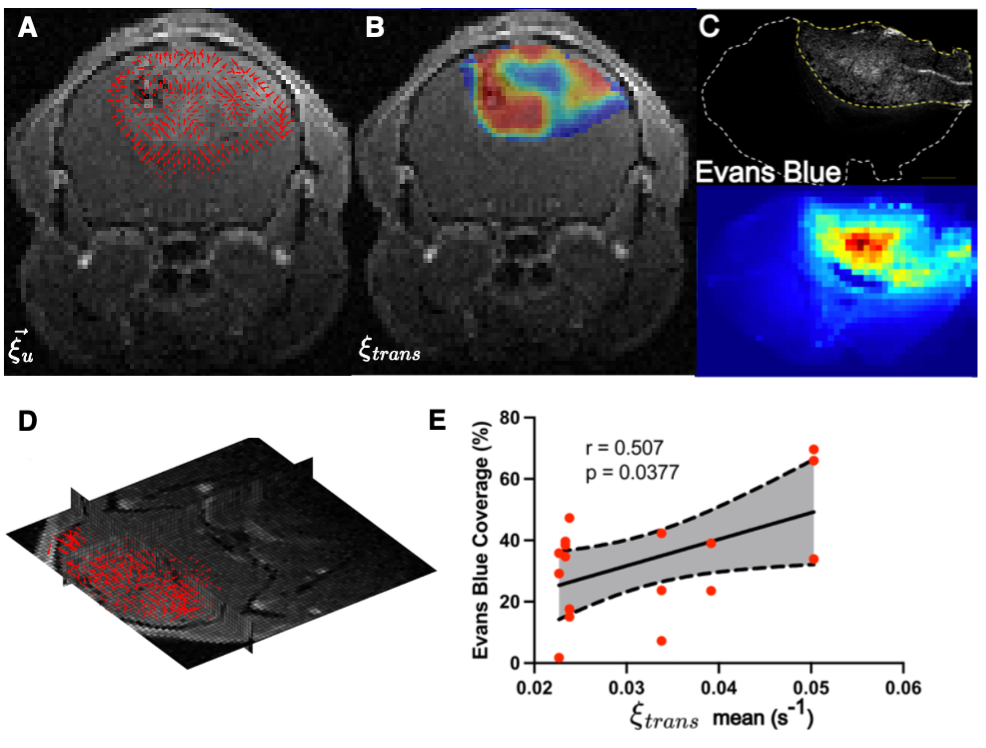
Figure 3: Velocity measurement, and perfusion validation in GL261 mouse glioma model. A) The measured velocity field on central tumor slice. B) The measured perfusion rate within the tumor. C) Evans blue stain density from central tumor slice, depicting regions of blood vessel perfusion and leakage. D) 3D reconstruction of the fluid velocity field (imaging method is isotropic). E) The measured correlation coefficient between perfusion (x-axis), and Evans Blue coverage of the tumor (y-axis), demonstrating significant correlation.