0996
T2 selective saturation labeling for imaging of water exchange between tissues and CSF.1Beth Israel Deaconess Medical Center, Boston, MA, United States, 2Harvard Medical School, Boston, MA, United States
Synopsis
Keywords: Neurofluids, Neurofluids
Motivation: Water exchange between tissue and CSF may contribute to CSF production and glymphatic clearance. The large difference in T2 between tissue and fluid suggests T2 saturation transfer can be used to image this exchange.
Goal(s): We aimed to develop a method for water exchange imaging using T2 saturation.
Approach: A novel strategy to control for systematic errors from direct effects of T2 saturation on fluid is proposed and evaluated in healthy volunteers.
Results: Three dimensional images at longer TE show exchange signal surrounding the choroid plexus, but also more modest exchange near the cerebellar vermis and the cerebellar and cerebral cortices.
Impact: A new strategy for T2 selective water exchange imaging can enable in vivo studies of CSF exchange that may reflect changes in glymphatic clearance or CSF production with aging, Alzheimer’s disease, intracranial hypertension and other disorders.
Introduction
The mechanisms underlying CSF production, glymphatic clearance, and CSF reabsorption have become a focus of interest for the study of Alzheimer’s disease and other pathologies. A key process in CSF dynamics is the exchange of water across compartments, from tissue and blood into the CSF, subarachnoid, and paravascular spaces. T2 selective preparation may be a useful approach to MRI characterization of this exchange1.Theory
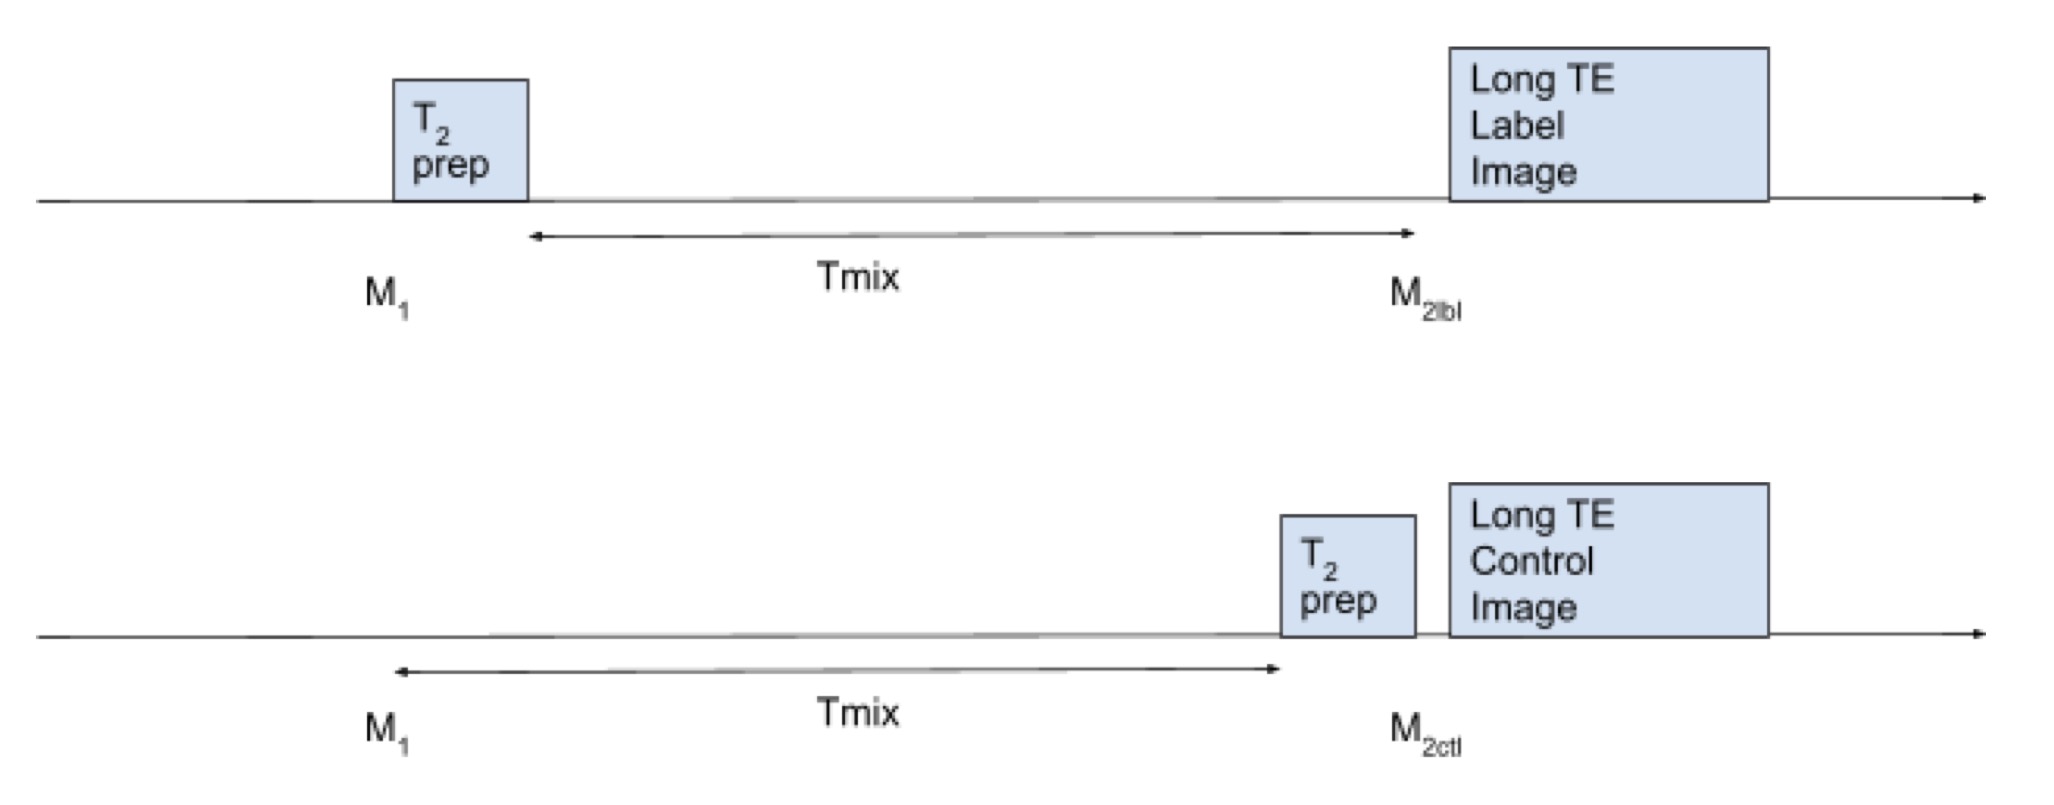
Our approach to T2 selective labeling employed a second image with T2 saturation applied later as a control, figure 1. For the labeled sequence, a T2 selective saturation is applied before a mixing time Tmix. For the control sequence, The T2 selective saturation is applied after Tmix. In the absence of exchange during the mixing time, the magnetizations after the label and control sequences are given by$$$M_{2lbl}={\alpha}M_1(e^{({-T_{mix}/T_1})})+R$$$
$$$M_{2ctl}={\alpha}M_1(e^{({-T_{mix}/T_1})})+{\alpha}R$$$
Where alpha is the saturation factor for the T2 saturation and R is the recovered magnetization during the mixing period. The difference between the two ending magnetizations is nonzero only because of the recover term R.
$$$M_{2lbl} - M_{2ctl} =(1-\alpha)R= (1-\alpha)(1-e^{({-T_{mix}/T_1})})$$$
If we add n inversion pulses during the mixing time, the M1 terms above are multiplied by a power of the inversion efficiency. But, if the timing of the inversion(s) is optimized, one can make R close to zero2. For 3 or more inversions, R can be reduced to less than 1% for T1’s from pure water to fat.
$$$M_{2lbl} - M_{2ctl}= \alpha\beta^nM_1e^{({-T_{mix}/T_1})}-\alpha\beta^nM_1e^{({-T_{mix}/T_1})}+(1-\alpha)R$$$
Because this subtraction removes direct effects of labeling on exchanging spins, any difference between label and control should reflect exchange during the mixing time such that T2 and/or T1 are not constant.
Methods
The T2 selective exchange sequences were implemented on a GE Signa Premier XT scanner before a 3DFSE (RARE) sequence. T2 preparation was achieved with a 200ms TE BIR8 adiabatic sequence3, and 4 tanh adiabatic inversion pulses were applied at optimized times to minimize recovered magnetization. The preparations were preceded by nonselective saturation 5 s before imaging and a T2 selective inversion recovery optimized to nearly null CSF M1. Following the preparations, 200ms were allowed to allow some recovery of tissue magnetization and 3 fat saturations pulses were applied immediately before imaging. A TR of 10s, 2x2 parallel imaging acceleration, an asymptotic 70° flip angle train with echo spacing of 3.3ms, and centric phase ordering with TE controlled by skipping echoes prior to acquisition were selected. Acquisition of the label and control images and an unprepared reference image required 5min 20s.Aftertesting in MnCl phantoms with a range of T1’s and T2’s that showed subtraction errors of less than 0.1%, images were acquired in 3 healthy volunteers following an IRB protocol and written informed consent. Images were acquired for TE’s of 106.5, 213.0 and 319.5ms for Tmix of 2s and 1.5s and for the 2 longer TE’s at Tmix of 1s. DICOM images were processed in MATLAB and SPM. Following gaussian smoothing to 3x3x3 mm resolution, label and control images were subtracted and divided by the signal in the center of the ventricles on the reference image.
Results
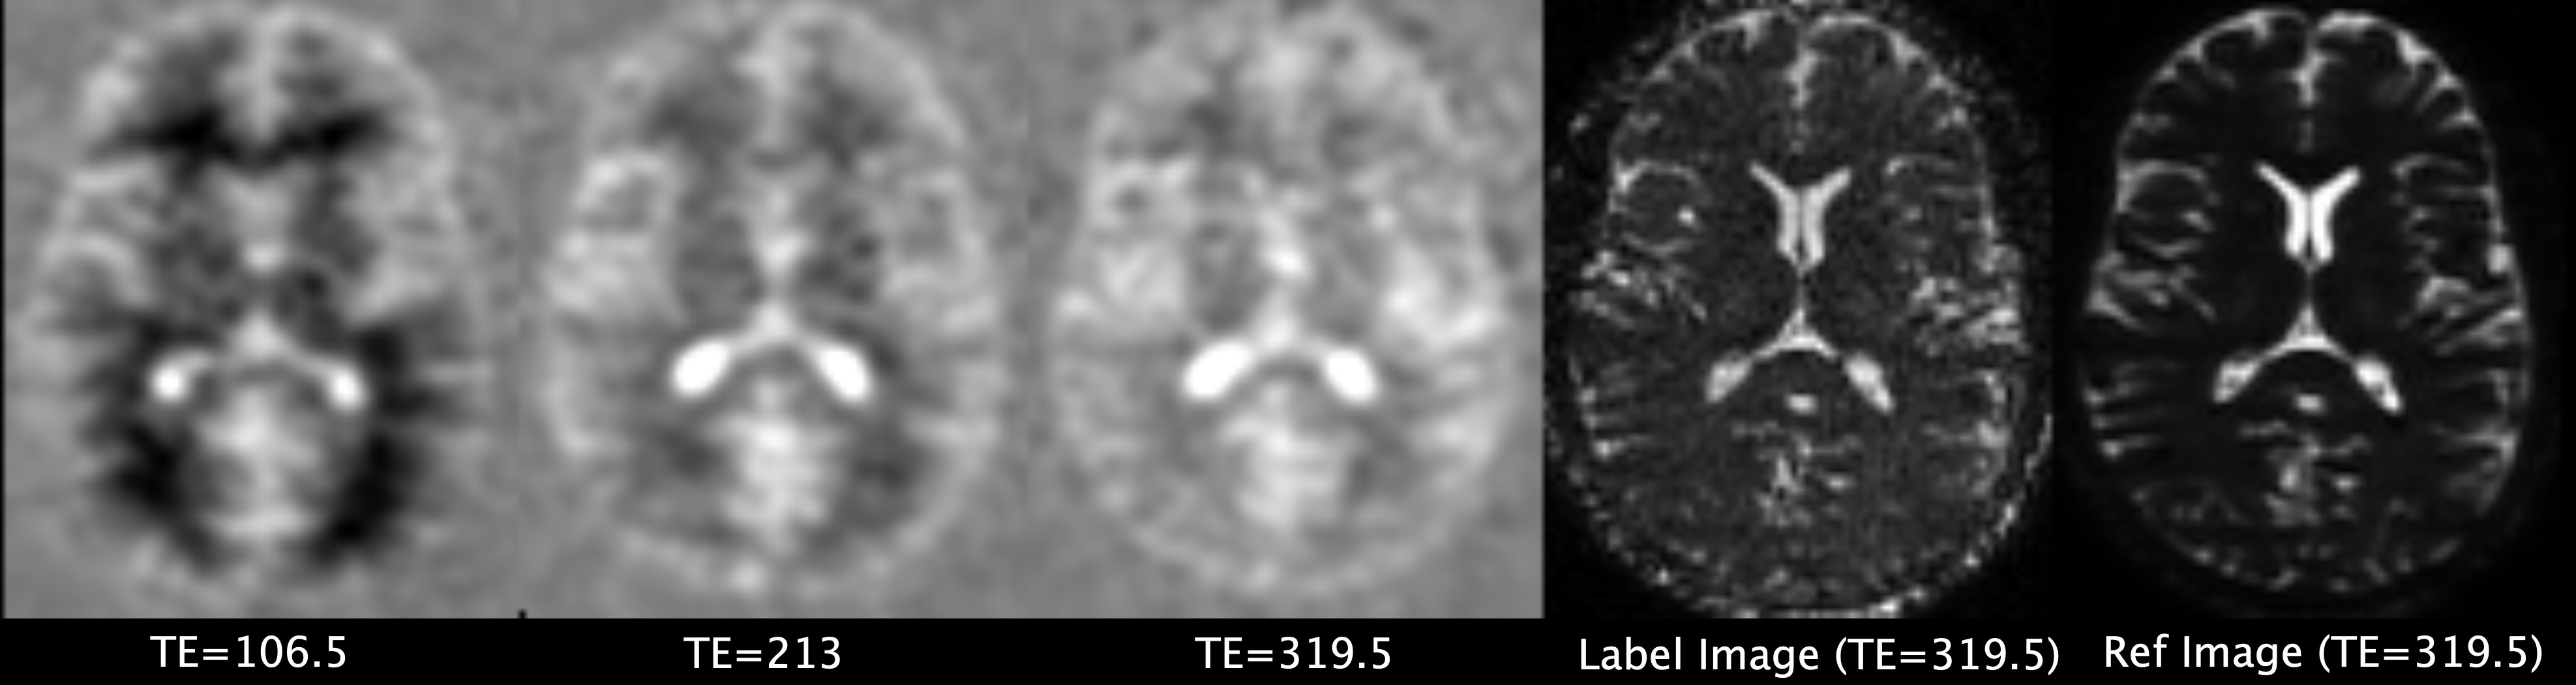
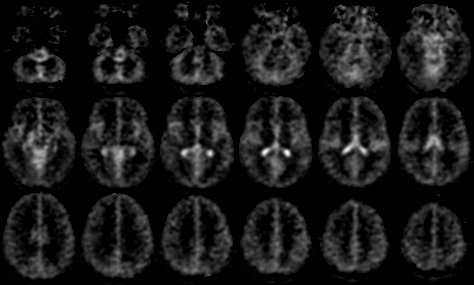
All images showed elevated signal surrounding the choroid plexus and distributed throughout cortical and brain stem regions, figure 2. Negative white matter signal was noticeably present on the TE 106.5 ms images but the effected faded by the 213 ms images and was negligible in the 319.5 ms images. This effect likely reflects incomplete suppression of recovered magnetization due to a very short T1 component in white matter4. Exchange signal in choroid plexus and near cortex appeared to increase slightly with TE, consistent with reduced partial volume of blurred negative white matter signal. Though the exchange signal was present only in regions known to contain CSF, this signal could not simply be a systematic error in CSF, since the spatial variation of intensity was very different from the unsubtracted label or control images and the reference images. 3D images averaged across subjects show the whole brain distribution of the exchange signal, figure 3. The spatial distribution of exchange signal was consistent across subjects with the highest signal around the choroid plexus of the lateral ventricles. Signal was also prominent in the fourth ventricle and around the cerebellar vermis. Noticeable exchange can be seen surrounding the cerebellar and cerebral cortices.Conclusions
An approach for sensitive measurement of exchange from short to long T2 compartments can be used to assess water exchange from tissue and blood to CSF. This method may be used to help understand and diagnose disorders of CSF production and the glymphatic clearance system.Acknowledgements
No acknowledgement found.References
1. Taso M. and Alsop DC. Proceedings of the ISMRM 2023: 1466
2. Maleki N. et al. MAGMA (2012) 25(2):127-33.
3. Guo J. et al. Magn Reson Med (2015) 73(3):1085-94
4. Oh S. et al. NeuroImage (2013) 83: 485-492
Figures