0994
High-field contrast-enhanced magnetic resonance imaging demonstrates cerebrospinal fluid nasal efflux dynamics in vivo1Department of Experimental Medicine, Faculty of Medicine, Lund University, Lund, Skåne, Sweden, 2Bioimaging Centre, Faculty of Medicine, Lund University, Lund, Skåne, Sweden
Synopsis
Keywords: Neurofluids, High-Field MRI, Cerebrospinal fluid efflux
Motivation: The astroglia-mediated circulation of metabolites and waste between cerebrospinal fluid (CSF) and blood or lymph, recently termed the glymphatic system, is implicated in processes from autoimmunity to neurodegeneration.
Goal(s): Many details of CSF dynamics, particularly efflux routes from brain to periphery including nasal pathways as we examine here, remain to be clarified.
Approach: Here we investigate CSF efflux in living mice using 9.4-T in vivo dynamic contrast-enhanced magnetic resonance imaging (DCE-MRI).
Results: We show that gadolinium-based contrast agent injected into the cisterna magna (CM) of live mice dose-rate-dependently effluxes into the nasal mucosa in a manner affected by olfactory neuronal integrity.
Impact: Controversy surrounds the current model of CSF efflux from brain ventricles to periphery. We show with high-field DCE-MRI in live mice that nasal efflux of CSF from cisterna magna adapts to both a flow rate challenge and olfactory neuronal damage.
Introduction
Multitudinous biological processes may be influenced in therapeutically manipulable ways by metabolite circulation between cerebrospinal fluid (CSF) and blood or lymphatic vessels via astroglia-controlled perivascular channels in what is now called the glymphatic system1, of which associated efflux pathways from the brain still remain unclear. Ventricular CSF is thought to flow caudally from choroid plexus to the subarachnoid space, but uncertainty surrounds its various routes thereafter into blood and/or lymph2,3, especially since the brain parenchyma may lack lymphatic vessels4, and arachnoid5 and dura mater likely block aqueous solute diffusion. Here we expand upon previous observations in diverse species2,3,6-12 that ventricular CSF exits the brain into the nasal submucosa, using dynamic contrast-enhanced in vivo MRI13-17 to show that gadolinium-based tracer injected into the CSF space rapidly enters the nasal turbinates in a flow-rate-dependent manner affected by olfactory neuronal integrity in anesthetized mice.Methods
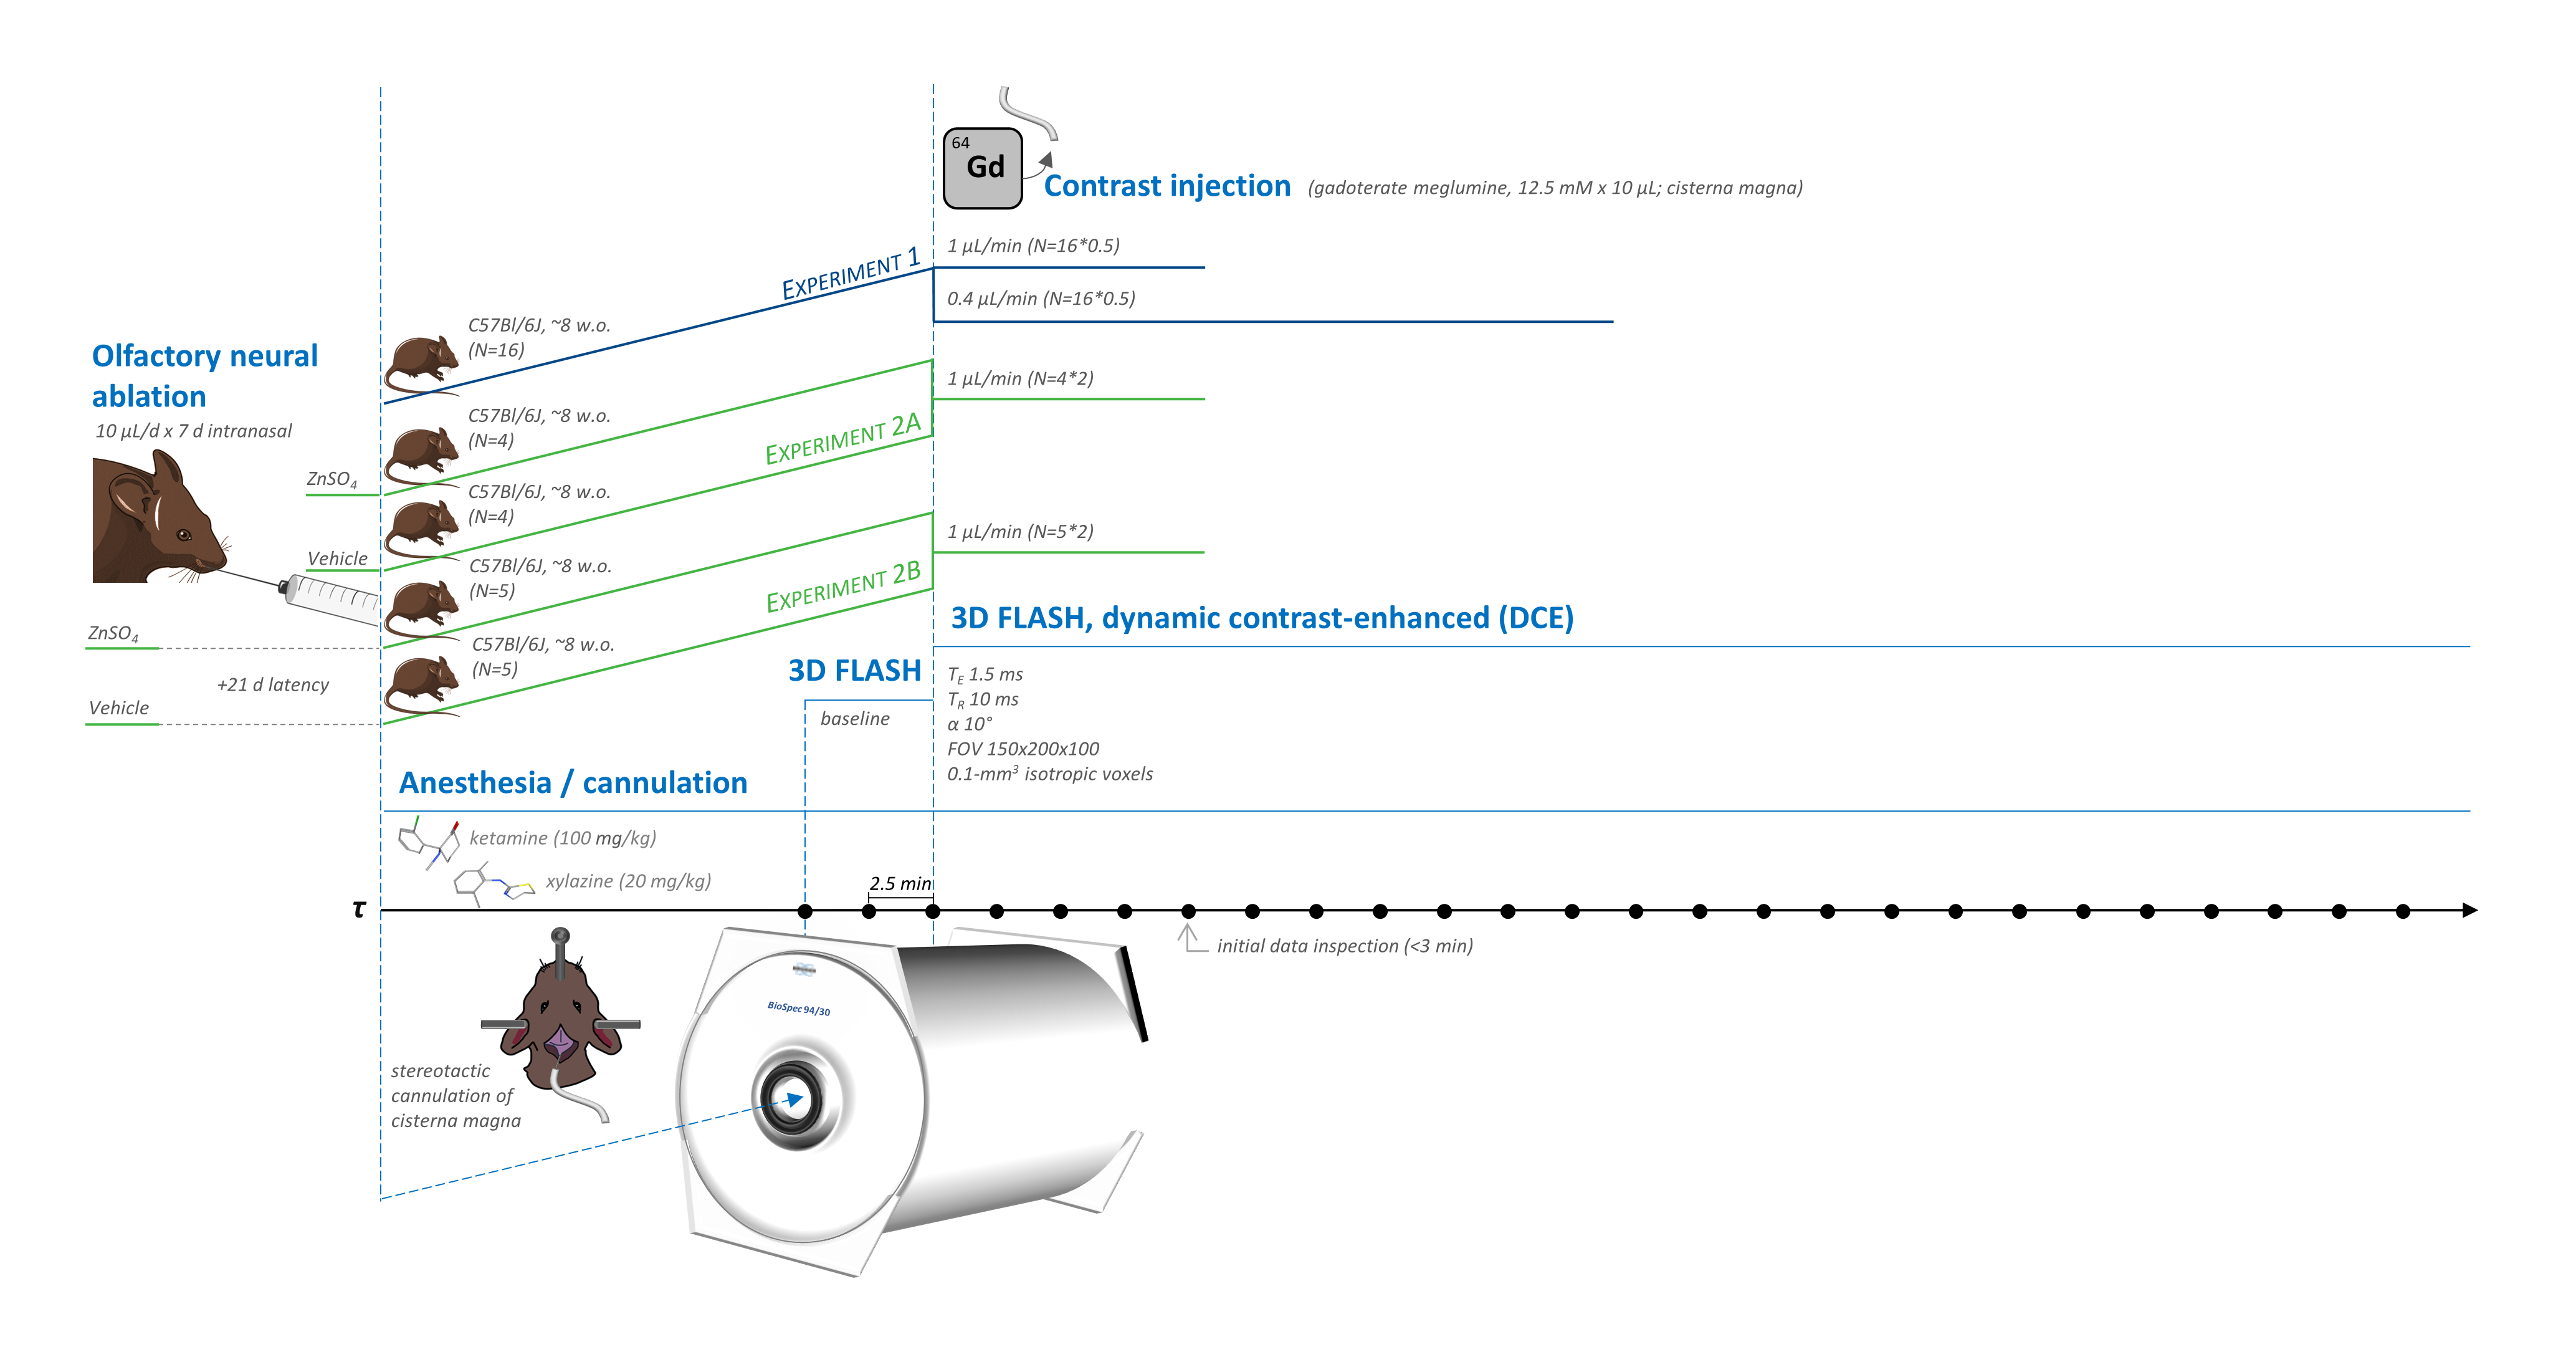
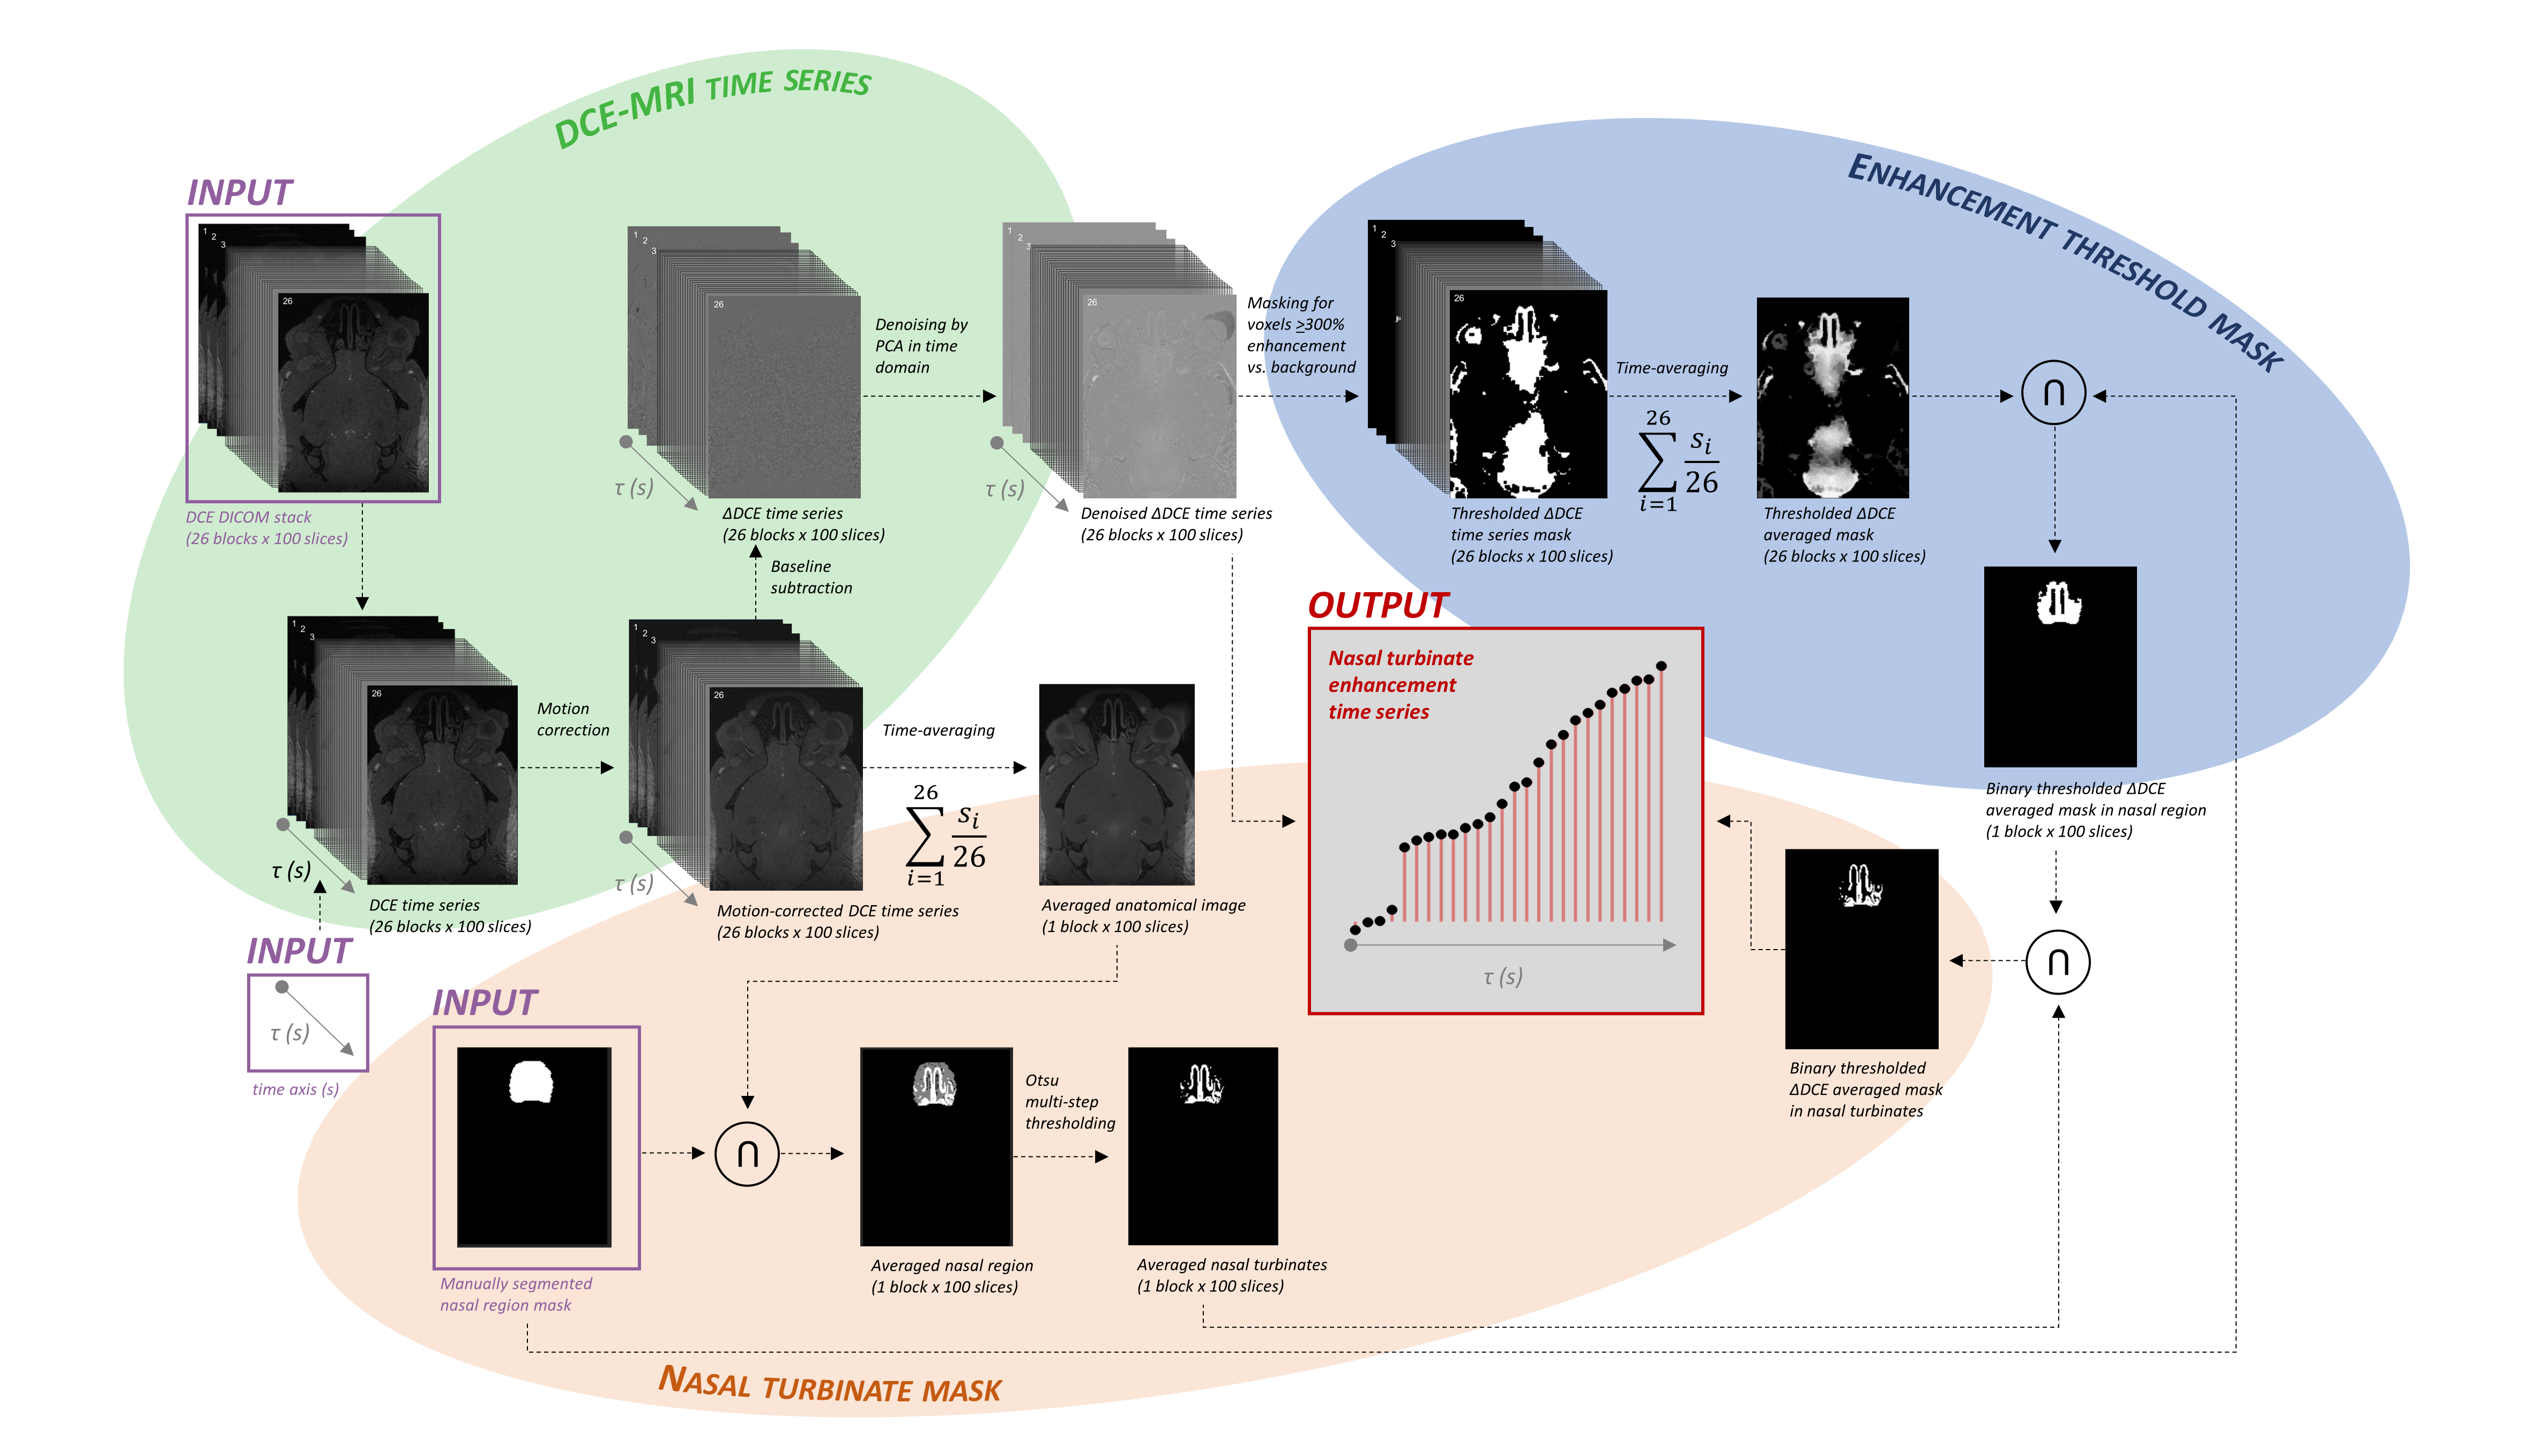
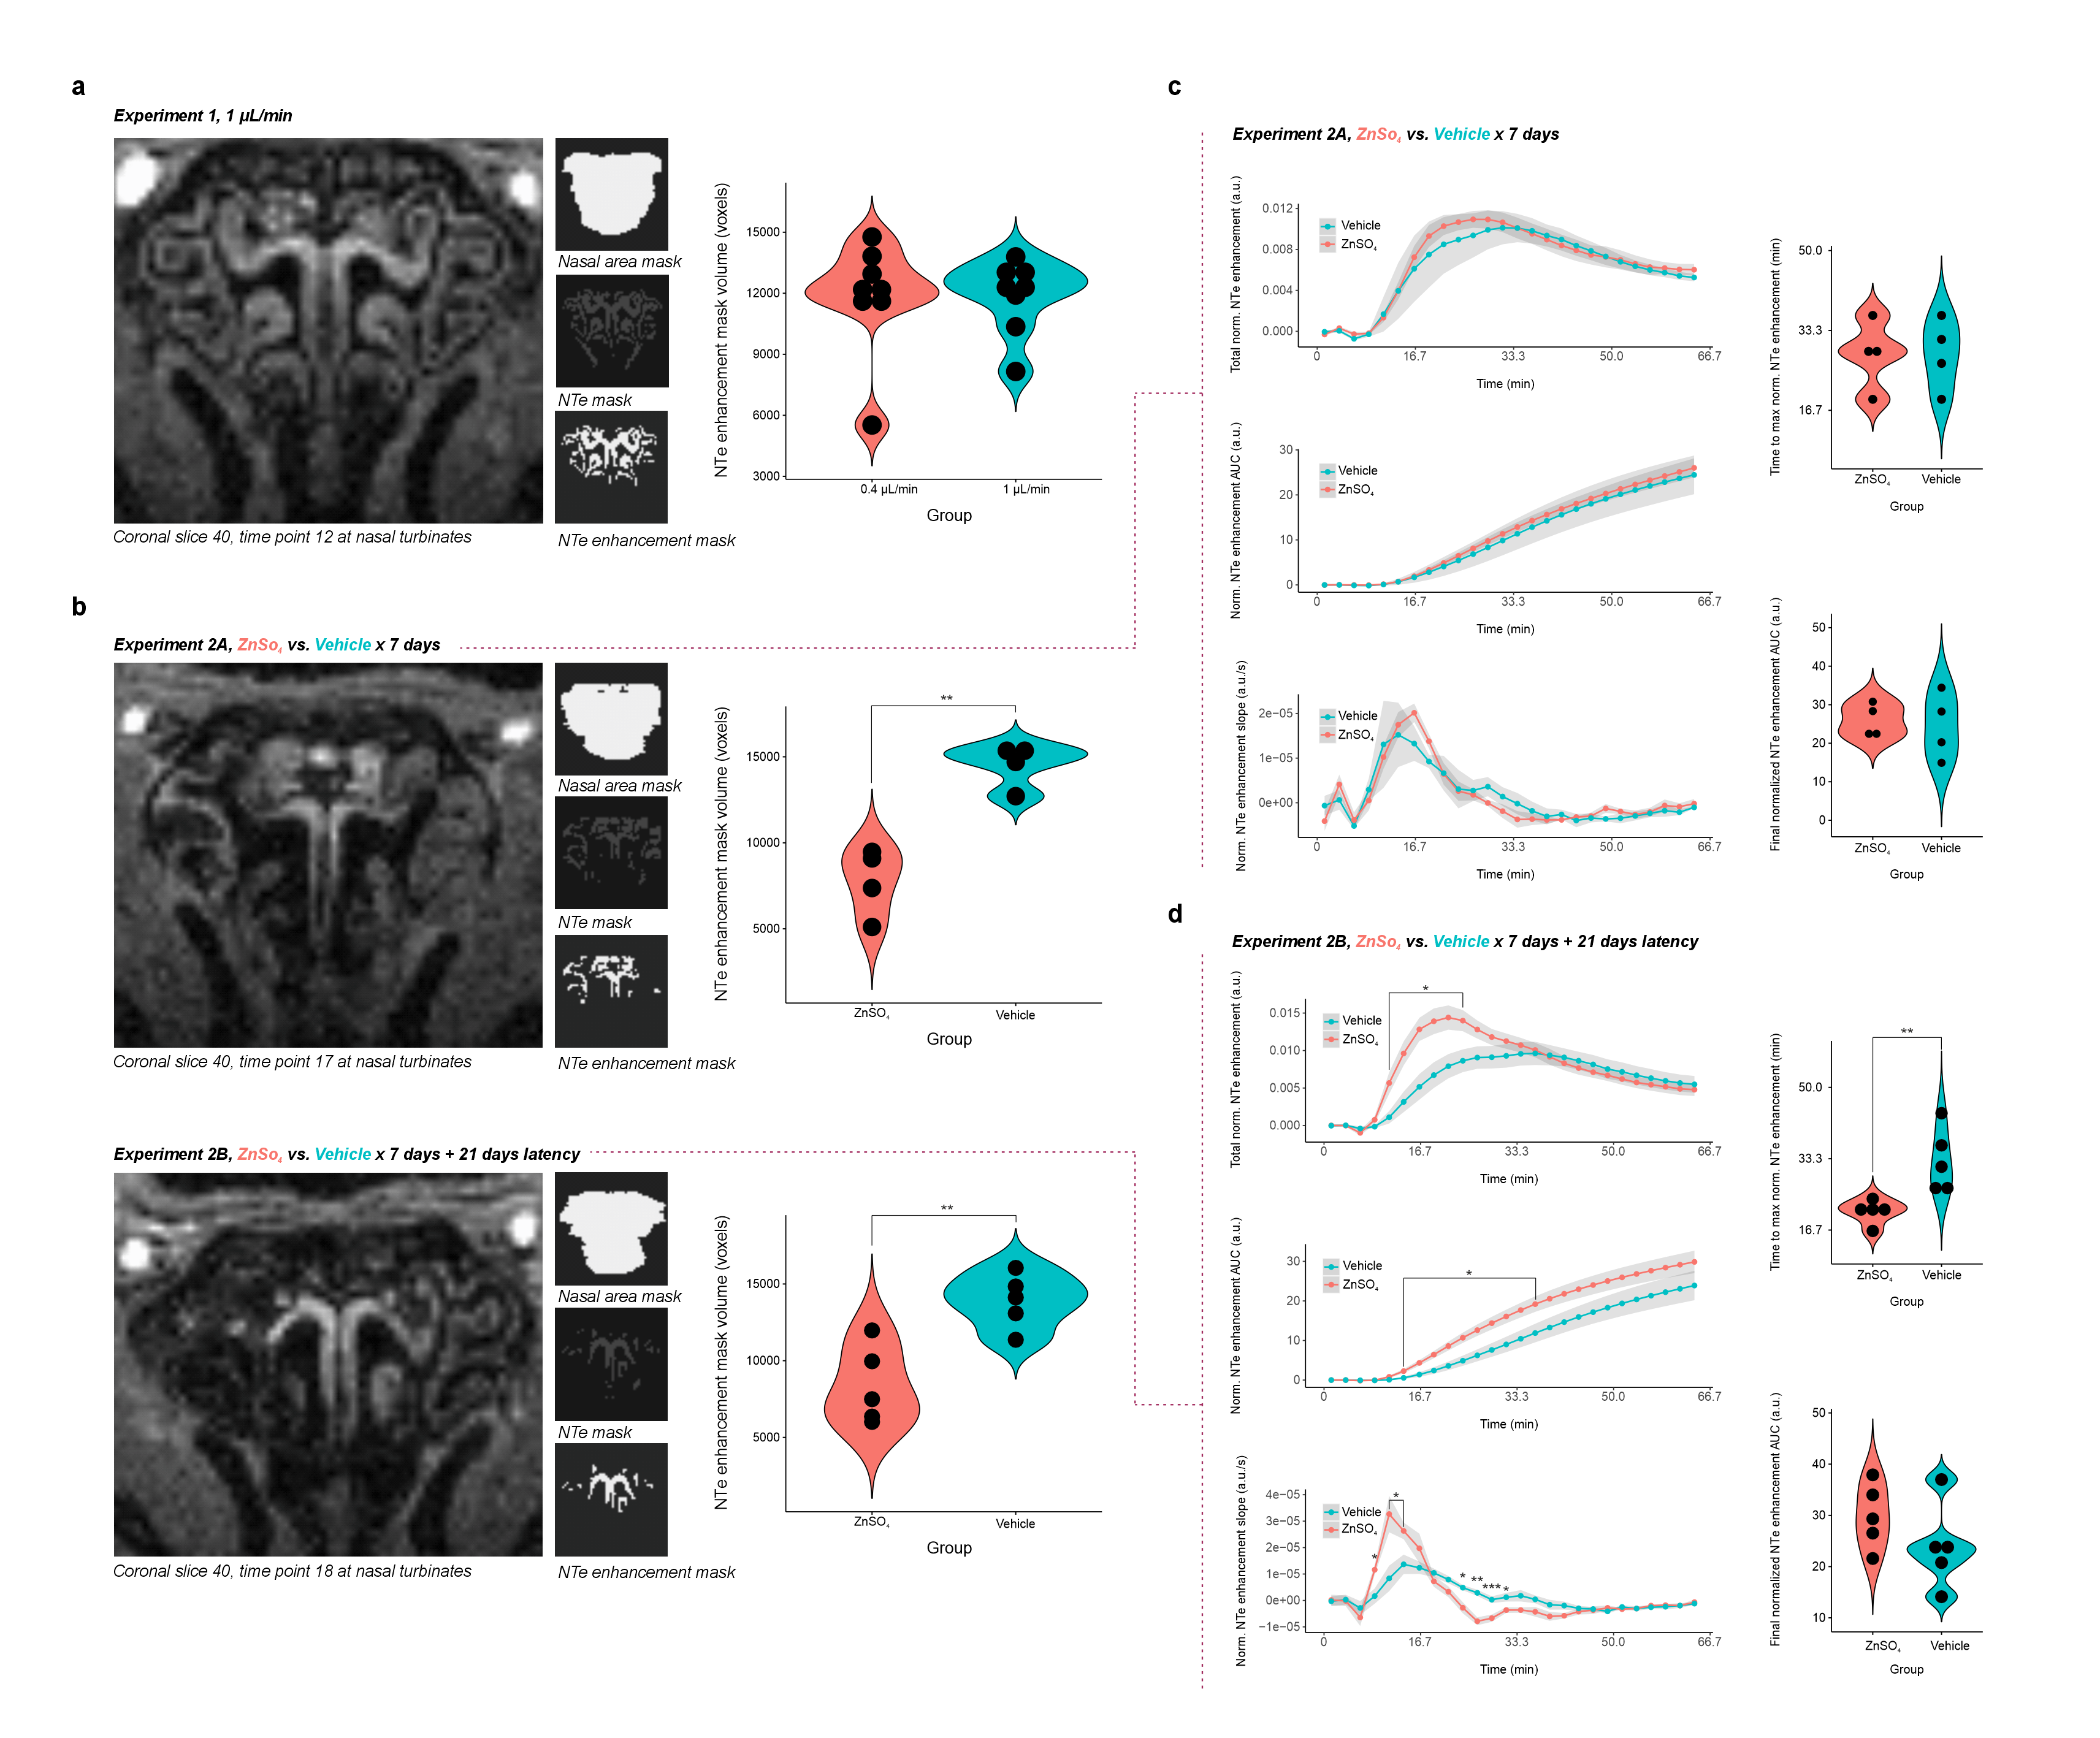
Imaging employed a 9.4-Tesla preclinical system (BioSpec Avance III, Bruker, Ettlingen, Germany) with a 2-channel Bruker CryoProbe Tx/Rx 1H quadrature coil. In Experiment 1, C57Bl/6J mice were anesthetized with ketamine/xylazine (100/20 mg/kg) and scanned for one hour with 3D FLASH (TE=1.5 ms, TR=10 ms, α=10°, FOV=150x200x100, 0.1-mm3 isotropic voxels, 2.5-min blocks) using a head-centered ROI including nasal turbinates. In Experiment 1, following 2 baseline acquisitions, gadolinium (10 µL 12.5 mM gadoterate meglumine Dotarem®, Guerbet LLC, Villepinte, France) was injected into the cisterna magna at 0.4 µL/min (N=8) or 1 µL/min (N=8) for 24 blocks of dynamic contrast enhancement (DCE). In Experiment 2, the same scan and gadolinium dosing (1 µL/min) protocols were applied to mice pretreated intranasally with 10 µL/d x 7d 10% ZnSO4 to damage nasal epithelial olfactory neurons or saline control to assess the influence of neuronal integrity on nasal enhancement dynamics after no (N=4/group) or 21-d (N=5/group) post-treatment interval (Fig. 1).Images were analyzed in MICE Toolkit (Nonpi Medical AB, Umeå, Sweden) with in-house MATLAB scripting. Motion-corrected18,19 DICOMs were time-averaged for use in regional masking or baseline-subtracted into a DCE series denoised by PCA along the time axis and filtered to remove voxels at <300% contrast vs. background. Manual segmentation of the nasal area with automatic Otsu multi-step thresholding20 generated masks for the nasal turbinates (NTe), over which preprocessed enhancement at each of 26 time points was summed (Fig. 2).
Statistics were calculated in R (v. 4.3.1)21 using ANOVA on coefficients of linear mixed models for outcomes rank-transformed22 in case of significant residual Shapiro-Wilk test23. Post-hoc t-tests or Wilcoxon tests were Benjamini-Hochberg-corrected24.
Results
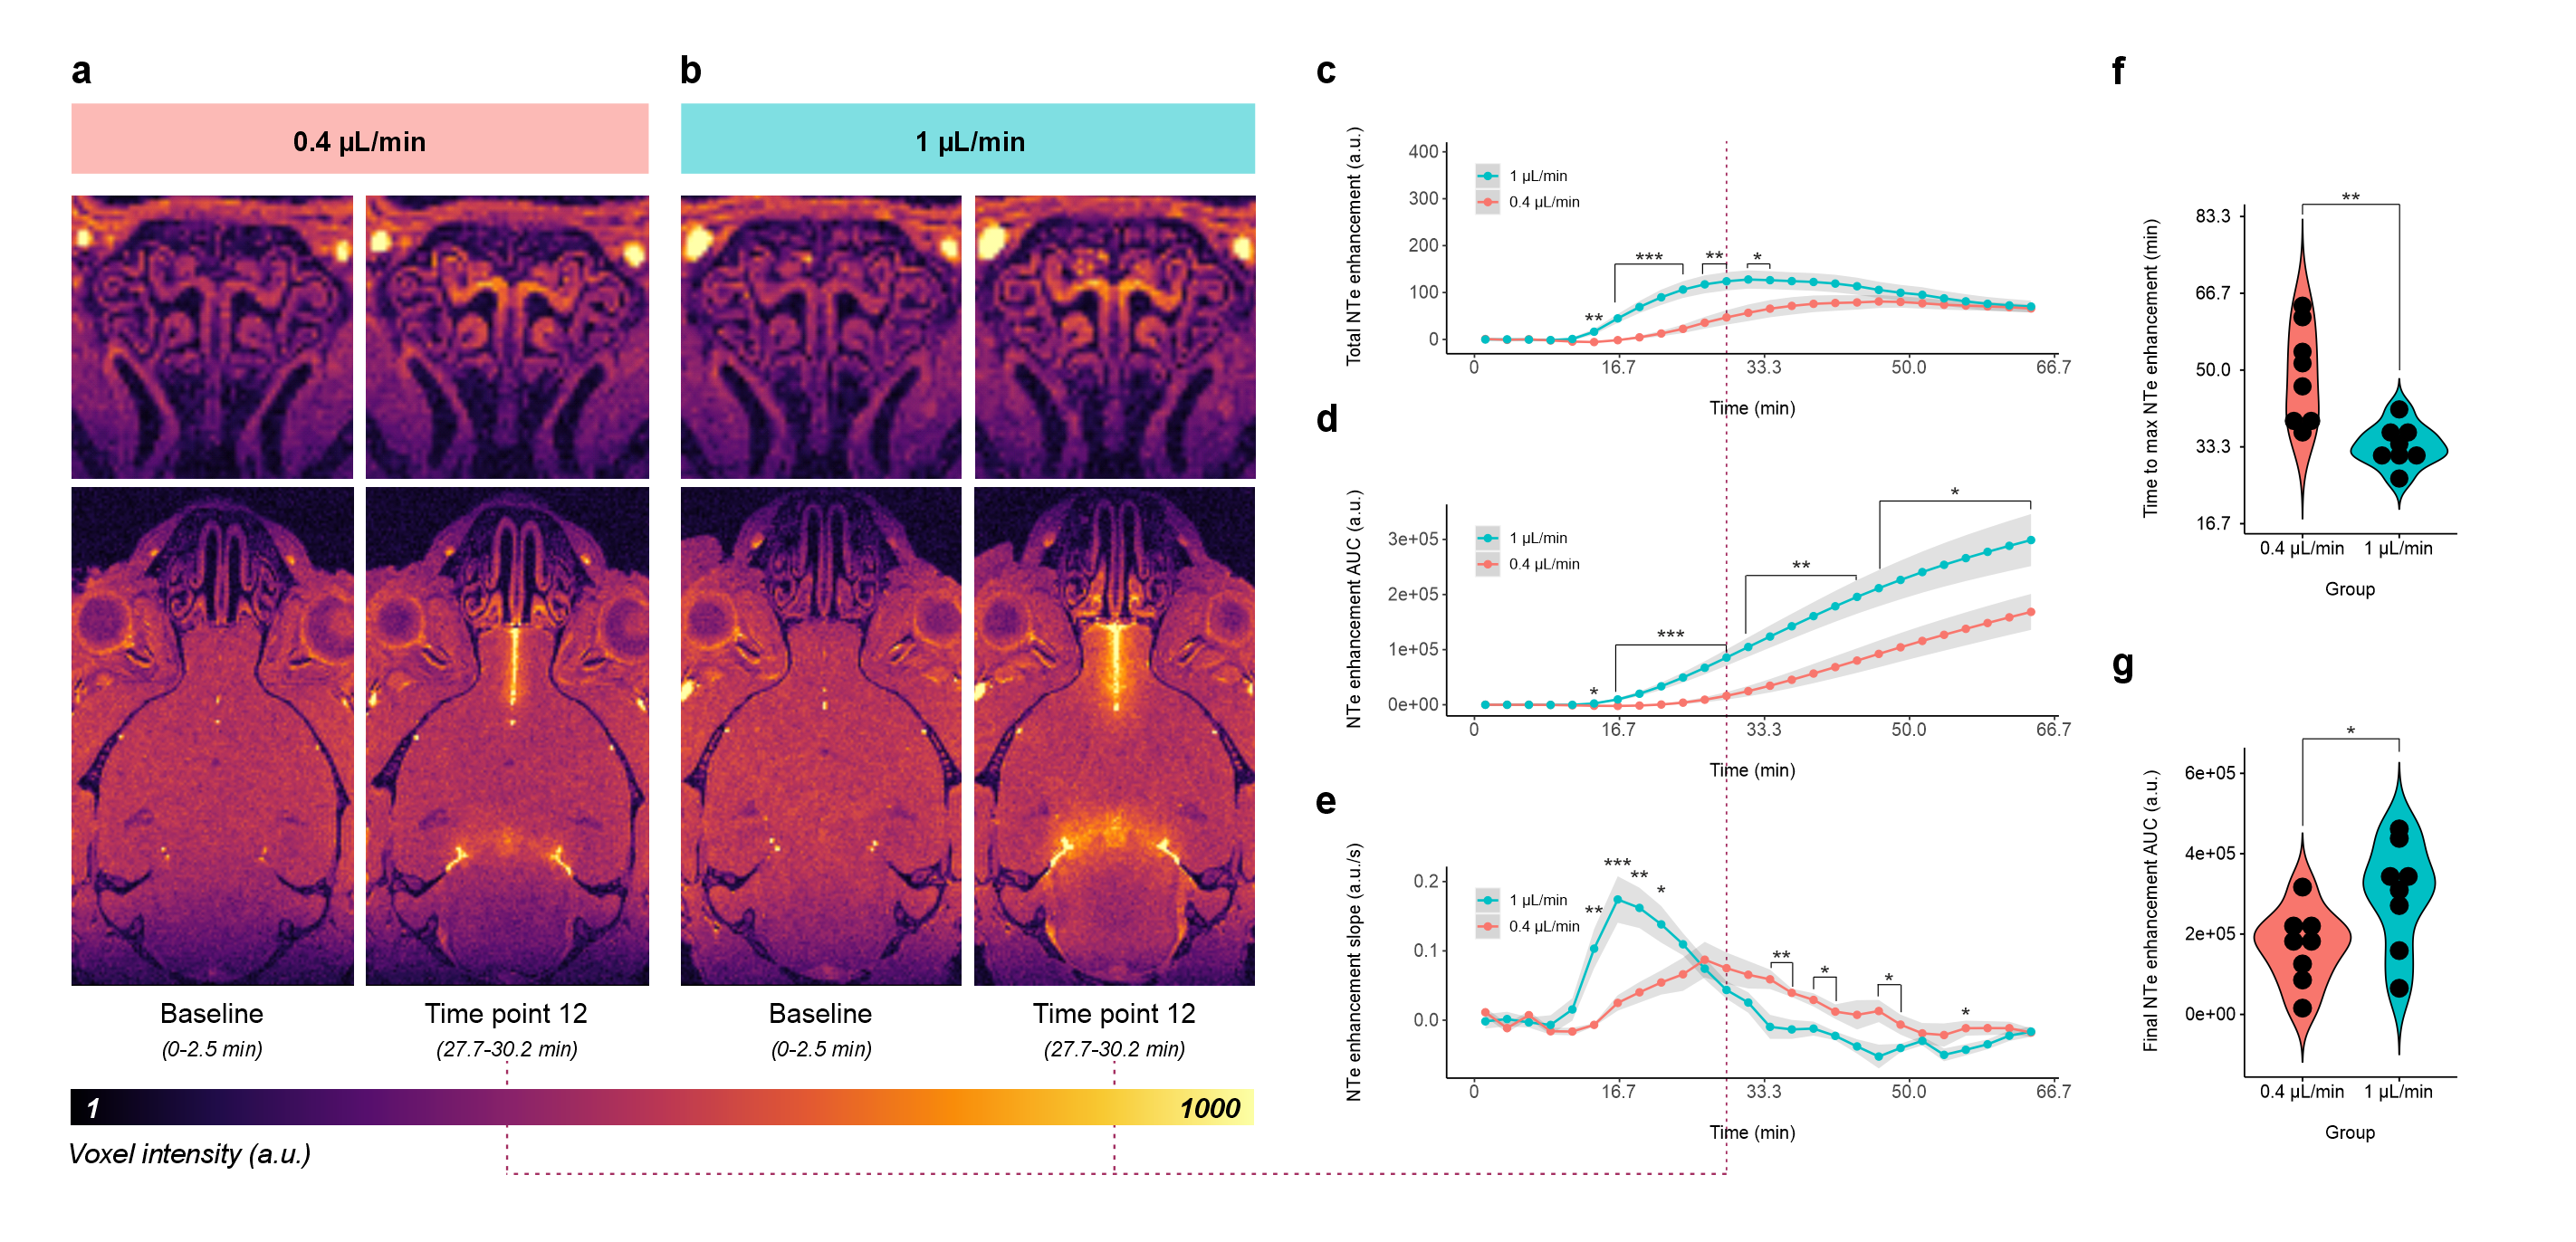
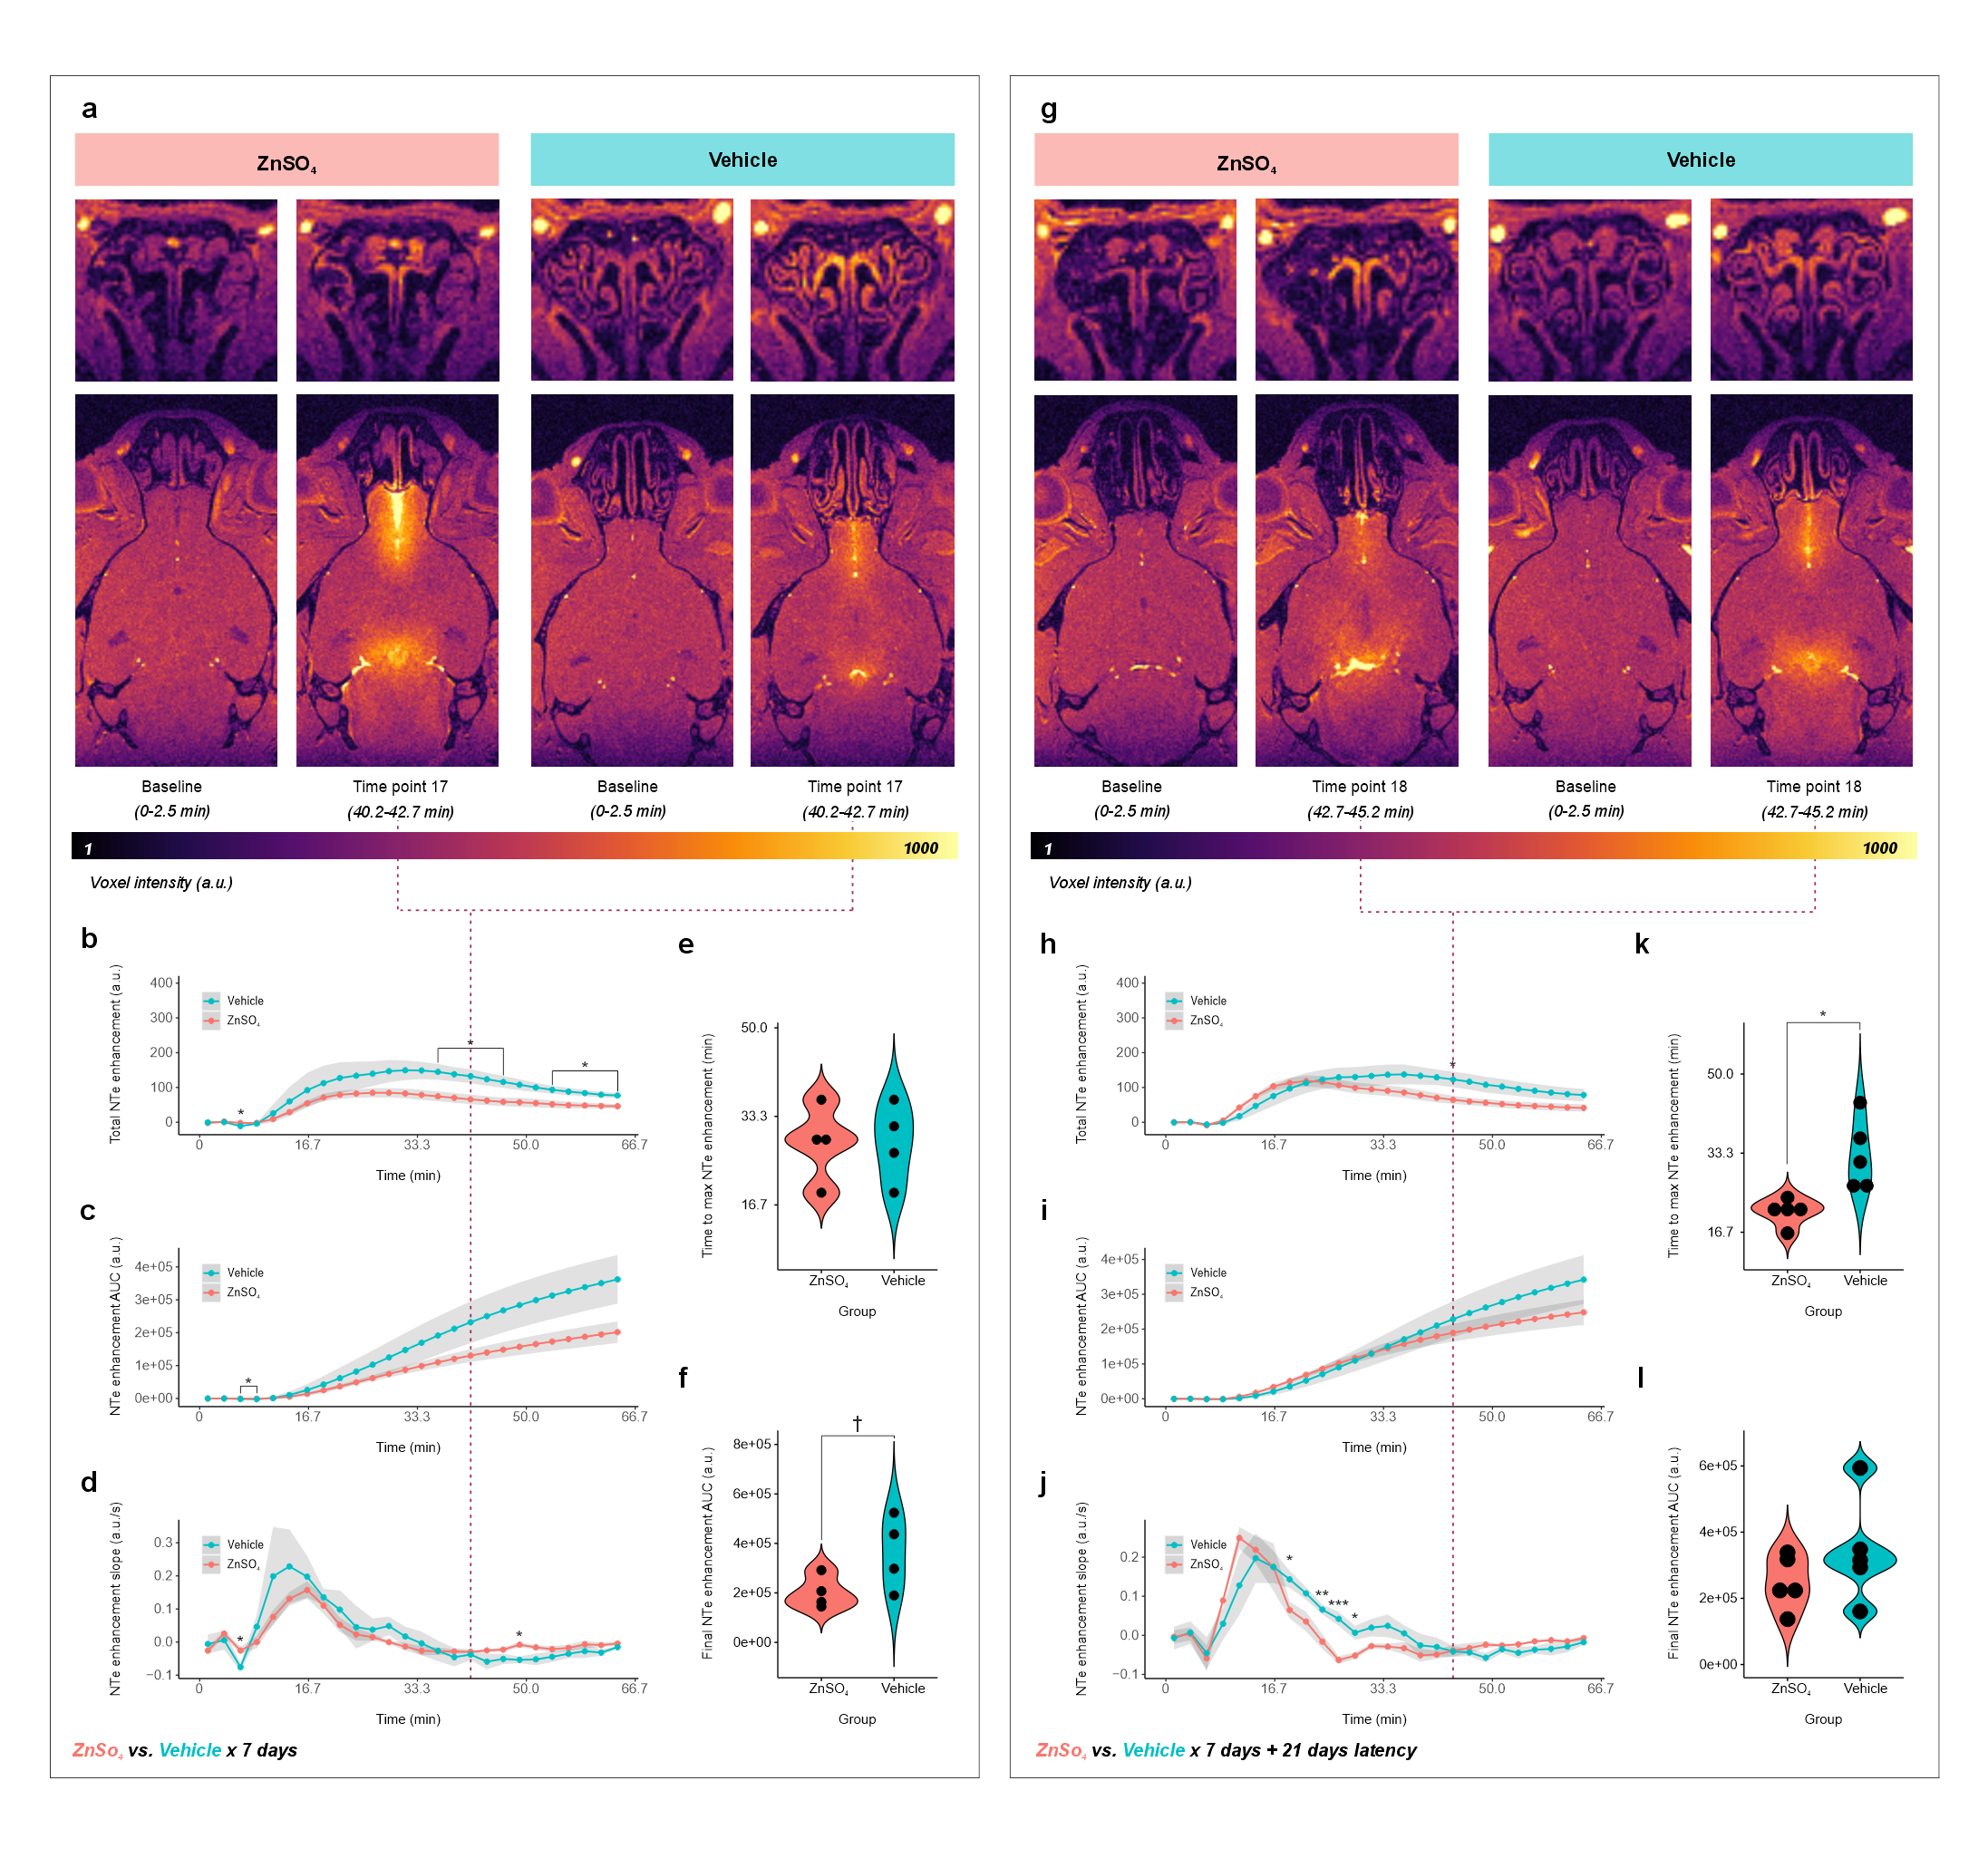
Mice demonstrated increased NTe signal enhancement within minutes of gadolinium injection into the cisterna magna (Fig. 3-5), with significant time coefficients on all study models. Injection-rate effects were seen for NTe enhancement and area under the curve (AUC) and slope thereof; rate*time interactions, for NTe enhancement AUC (F1,398=16.4995, p<10-4) and slope (F1,398=26.1920, p<10-6). Higher injection rate resulted in faster peak (F1,14=14.3, p=0.002) and greater cumulative (F1,14=5.147, p=0.04) NTe enhancement with increased NTe enhancement and AUC relative to the lower-rate group at several time points (Fig. 3).ZnSO4 treatment*time but not treatment demonstrated marginal and significant effects, respectively, on NTe enhancement (F1,198=3.6341, p=0.06) and AUC thereof (F1,198=36.1948, p<10-8), with ZnSO4-treated mice showing reduced NTe enhancement relative to vehicle control at several time points (Fig. 4b). 21 days from treatment end, treatment*time effects were seen for NTe enhancement (F1,248=17.4627, p<10-4) and AUC thereof (F1,248=12.4432, p=0.0005), with ZnSO4-treated mice demonstrating faster peak NTe enhancement (F1,8=11.52, p=0.009) (Fig. 4).
ZnSO4-treated mice demonstrated lower NTe enhancement mask volumes than control, consistent with epithelial damage (Exp. 2A 7762±1992 vs. 14530±1255 voxels, F1,6=33.05, p=0.001; 2B 8360±2544 vs. 13892±1778 voxels, F1,8=15.88, p=0.004). When NTe enhancement statistics were normalized by these differential mask volumes, ZnSO4-treated mice showed faster enhancement vs. vehicle only after 21 days (F1,8=11.52, p=0.009), with treatment*time effects on normalized NTe enhancement (F1,248=9.6674, p=0.002) and AUC thereof (F1,248=19.547, p<10-4); treatment effects, on AUC (F1,8=5.735, p=0.04) and slope (F1,8=6.4841, p=0.03); and increased NTe enhancement and AUC w.r.t. vehicle at several time points (Fig. 5).
Conclusions
This high-field in vivo demonstration of live-MR-imaging contrast agent motion from cisterna magna to nasal turbinates in ketamine/xylazine-anesthetized mice suggests that NTe efflux of CSF:- Increases in magnitude and speed following injection rate challenge of 1 µL/min vs. 0.4 µL/min;
- Demonstrates disruptions up to 21 days following olfactory neuronal ablation by intranasal ZnSO4;
- Increases in magnitude and speed vs. control when normalized by NTe volume at 21 days after ZnSO4.
Taken together, our findings demonstrate the utility of functional nasal mucosal pathways for adaptive efflux of gadolinium-based CSF tracer injected into the cisterna magna of the living brain.
Acknowledgements
This work was funded by the Knut and Alice Wallenberg Foundation (F2015/2112; I.L.) and Crafoordska Stiftelsen. Lund University Bioimaging Centre (LBIC), Lund University, is gratefully acknowledged for providing experimental resources. The dark brown mouse in Figure 1 was recolored and cropped from "mouse-dark gray," while the syringe was cropped from "syringe," both by Servier (https://smart.servier.com/) and licensed under CC-BY 3.0 Unported (https://creativecommons.org/licenses/by/3.0/). The rodent cisterna magna injection image in Figure 1 was inspired by Ramos M., Bechet N., Battistella R., Pavan C., Xavier A.L.R., Nedergaard M., and Lundgaard I. Cisterna magna injection in rats to study glymphatic function. In: Astrocytes: Methods and Protocols. Barbara Di Benedetto, ed. 2018. New York, NY, USA: Humana Press. Characteristically enlightening discussion with Christian Habeck, Ph.D., of Columbia University Medical Center regarding potential statistical approaches, and with Tekla Kylkilahti of the Lund University Faculty of Medicine regarding figure clarity, is gratefully acknowledged. Plotting and statistics code are available at https://github.com/kswanberg/DCE_MRI_Time_Series_Stats.
References
1. Jessen, N. A., Munk, A. S., Lundgaard, I. & Nedergaard, M. The Glymphatic System: A Beginner's Guide. Neurochem Res 40, 2583-2599 (2015). https://doi.org/10.1007/s11064-015-1581-6
2. Spera, I., Cousin, N., Ries, M., Kedracka, A., Castillo, A., Aleandri, S., Vladymyrov, M., Mapunda, J. A., Engelhardt, B., Luciani, P., Detmar, M. & Proulx, S. T. Open pathways for cerebrospinal fluid outflow at the cribriform plate along the olfactory nerves. EBioMedicine 91, 104558 (2023). https://doi.org/10.1016/j.ebiom.2023.104558
3. Brady, M., Rahman, A., Combs, A., Venkatraman, C., Kasper, R. T., McQuaid, C., Kwok, W. E., Wood, R. W. & Deane, R. Cerebrospinal fluid drainage kinetics across the cribriform plate are reduced with aging. Fluids Barriers CNS 17, 71 (2020). https://doi.org/10.1186/s12987-020-00233-0
4. Louveau, A., Smirnov, I., Keyes, T. J., Eccles, J. D., Rouhani, S. J., Peske, J. D., Derecki, N. C., Castle, D., Mandell, J. W., Lee, K. S., Harris, T. H. & Kipnis, J. Structural and functional features of central nervous system lymphatic vessels. Nature 523, 337-341 (2015). https://doi.org/10.1038/nature14432
5. Nabeshima, S., Reese, T. S., Landis, D. M. & Brightman, M. W. Junctions in the meninges and marginal glia. J Comp Neurol 164, 127-169 (1975). https://doi.org/10.1002/cne.901640202
6. Weed, L. H. Studies on Cerebro-Spinal Fluid. No. III : The pathways of escape from the Subarachnoid Spaces with particular reference to the Arachnoid Villi. J Med Res 31, 51-91 (1914).
7. Yoffey, J. M. & Drinker, C. K. Some observations on the lymphatics of the nasal mucous membrane in the cat and monkey. J Anat 74, 45-52 43 (1939).
8. Bradbury, M. W. & Westrop, R. J. Factors influencing exit of substances from cerebrospinal fluid into deep cervical lymph of the rabbit. J Physiol 339, 519-534 (1983). https://doi.org/10.1113/jphysiol.1983.sp014731
9. Erlich, S. S., McComb, J. G., Hyman, S. & Weiss, M. H. Ultrastructural morphology of the olfactory pathway for cerebrospinal fluid drainage in the rabbit. J Neurosurg 64, 466-473 (1986). https://doi.org/10.3171/jns.1986.64.3.0466
10. Kida, S., Pantazis, A. & Weller, R. O. CSF drains directly from the subarachnoid space into nasal lymphatics in the rat. Anatomy, histology and immunological significance. Neuropathol Appl Neurobiol 19, 480-488 (1993). https://doi.org/10.1111/j.1365-2990.1993.tb00476.x
11. Cai, X., Qiao, J., Kulkarni, P., Harding, I. C., Ebong, E. & Ferris, C. F. Imaging the effect of the circadian light-dark cycle on the glymphatic system in awake rats. Proc Natl Acad Sci USA 117, 668-676 (2020). https://doi.org/10.1073/pnas.1914017117
12. Stokes, C., White, E. F., Toddes, S., Bens, N., Kulkarni, P. & Ferris, C. F. Whole CNS 3D Cryo-Fluorescence Tomography Shows CSF Clearance along Nasal Lymphatics, Spinal Nerves, and Lumbar/Sacral Lymph Nodes. J Imaging 9 (2023). https://doi.org/10.3390/jimaging9020045
13. Gakuba, C., Gaberel, T., Goursaud, S., Bourges, J., Di Palma, C., Quenault, A., Martinez de Lizarrondo, S., Vivien, D. & Gauberti, M. General Anesthesia Inhibits the Activity of the "Glymphatic System." Theranostics 8, 710-722 (2018). https://doi.org/10.7150/thno.19154
14. Decker, Y., Kramer, J., Xin, L., Muller, A., Scheller, A., Fassbender, K. & Proulx, S. T. Magnetic resonance imaging of cerebrospinal fluid outflow after low-rate lateral ventricle infusion in mice. JCI Insight 7 (2022). https://doi.org/10.1172/jci.insight.150881
15. Stanton, E. H., Persson, N. D. A., Gomolka, R. S., Lilius, T., Sigurethsson, B., Lee, H., Xavier, A. L. R., Benveniste, H., Nedergaard, M. & Mori, Y. Mapping of CSF transport using high spatiotemporal resolution dynamic contrast-enhanced MRI in mice: Effect of anesthesia. Magn Reson Med 85, 3326-3342 (2021). https://doi.org/10.1002/mrm.28645
16. Ahn, J. H., Cho, H., Kim, J. H., Kim, S. H., Ham, J. S., Park, I., Suh, S. H., Hong, S. P., Song, J. H., Hong, Y. K., Jeong, Y., Park, S. H. & Koh, G. Y. Meningeal lymphatic vessels at the skull base drain cerebrospinal fluid. Nature 572, 62-66 (2019). https://doi.org/10.1038/s41586-019-1419-5
17. Pizzo, M. E., Wolak, D. J., Kumar, N. N., Brunette, E., Brunnquell, C. L., Hannocks, M. J., Abbott, N. J., Meyerand, M. E., Sorokin, L., Stanimirovic, D. B. & Thorne, R. G. Intrathecal antibody distribution in the rat brain: surface diffusion, perivascular transport and osmotic enhancement of delivery. J Physiol 596, 445-475 (2018). https://doi.org/10.1113/JP275105
18. Klein, S., Staring, M., Murphy, K., Viergever, M. A. & Pluim, J. P. elastix: a toolbox for intensity-based medical image registration. IEEE Trans Med Imaging 29, 196-205 (2010). https://doi.org/10.1109/TMI.2009.2035616
19. Shamonin, D. P., Bron, E. E., Lelieveldt, B. P., Smits, M., Klein, S., Staring, M. & Alzheimer's Disease Neuroimaging, I. Fast parallel image registration on CPU and GPU for diagnostic classification of Alzheimer's disease. Front Neuroinform 7, 50 (2013). https://doi.org/10.3389/fninf.2013.00050
20. Otsu, N. A threshold selection method from gray-level histograms. IEEE Transactions on Systems, Man, and Cybernetics 9, 62-66 (1979).
21. R Core Team. R: A Language and Environment for Statistical Computing. R Foundation for Statistical Computing, Vienna, Austria. https://www.R-project.org/ (2023).
22. Conover, W. J. & Iman, R. L. Rank Transformations as a Bridge between Parametric and Nonparametric Statistics. Am Stat 35, 124-129 (1981). https://doi.org/Doi 10.2307/2683975
23. Royston, P. An extension of Shapiro and Wilk's W test for normality to large samples. Applied Statistics 31, 115–124 (1982). https://doi.org/doi:10.2307/2347973
24. Benjamini, Y. & Hochberg, Y. Controlling the False Discovery Rate - a Practical and Powerful Approach to Multiple Testing. J R Stat Soc B 57, 289-300 (1995). https://doi.org/DOI 10.1111/j.2517-6161.1995.tb02031.x
Figures