0993
Effect of visual stimulation on cerebrospinal fluid flow is impaired in glaucoma patients1Department of Ophthalmology, New York University Grossman School of Medicine, New York, NY, United States, 2Department of Biomedical Engineering, Tandon School of Engineering, New York University, New York, NY, United States, 3Wills Eye Hospital, Philadelphia, PA, United States, 4Sidney Kimmel Medical College of Thomas Jefferson University, Philadelphia, PA, United States, 5Department of Biomedical Engineering, Drexel University, Philadelphia, PA, United States, 6Department of Radiology, New York University Grossman School of Medicine, New York, NY, United States
Synopsis
Keywords: Neurofluids, Neurofluids
Motivation: Glaucoma is an age-related neurodegenerative disease of the visual system. Recent studies suggested that glaucoma may lead to changes in cerebrospinal fluid (CSF) dynamics, which can be influenced by neural activity. However, it remains unclear how the CSF dynamics is altered in glaucoma.
Goal(s): To test whether the impact of visual stimulation on CSF inflow is impaired in glaucoma.
Approach: We used visually-evoked BOLD fMRI responses to compare the coupling between BOLD activity and CSF inflow across healthy individuals and glaucoma patients.
Results: Our findings indicate that the influence of visual stimulation on CSF inflow decreases with glaucoma severity.
Impact: Our findings suggest that CSF inflow is altered in glaucoma. Future studies should investigate whether this reduced impact of visual stimulation on CSF inflow is due to impaired neural activity or impaired interaction between cerebrovascular activity and CSF dynamics.
Introduction
Glaucoma is an age-related neurodegenerative disease that can lead to irreversible blindness1,2. Recent studies have indicated potential links between neurodegenerative diseases and cerebrospinal fluid (CSF) dynamics3,4, which can be driven by visual stimulation5. Nevertheless, such an impact has not been studied in glaucoma patients. Thus, our study aims to investigate the impact of visual stimulation on CSF flow in glaucoma patients using functional MRI.Methods
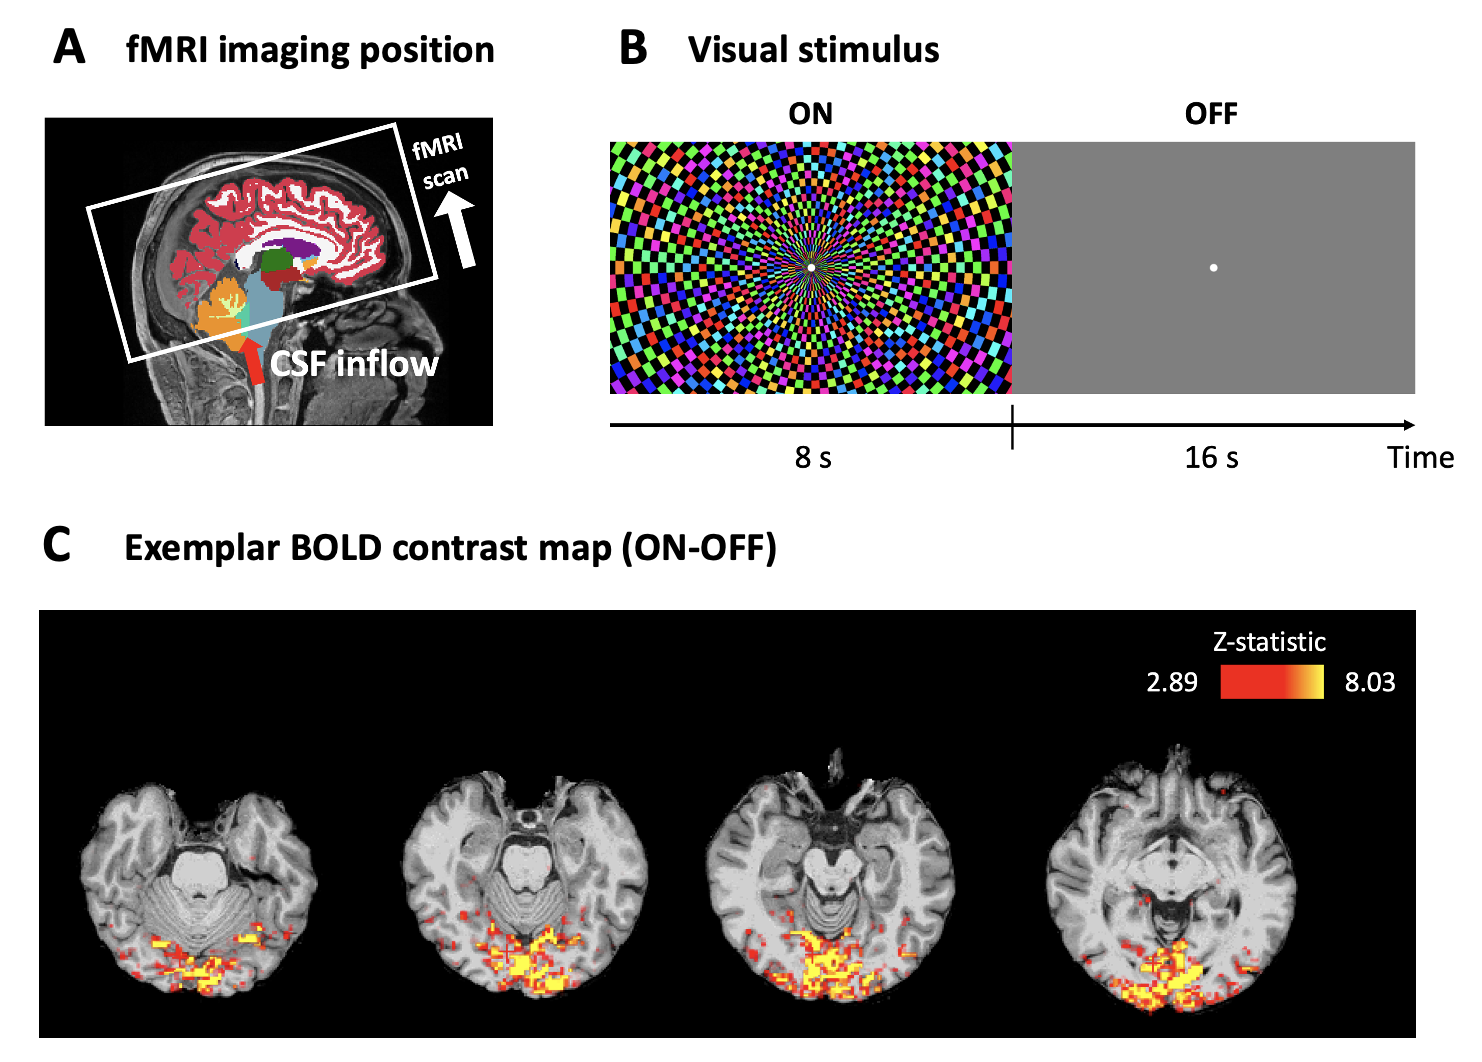
Eighteen early glaucoma patients [age= 66.00±1.89 years (mean±S.E.M.); 27.78% male], twenty-four advanced glaucoma patients [age= 66.63±1.36 years; 54.17% male] and twenty-three healthy controls [age= 64.52±1.59 years; 39.13% male] underwent clinical ophthalmic testing using spectral-domain optical coherence tomography (Cirrus HD-OCT; Zeiss, Dublin, CA, USA), and the Humphrey visual field perimetry via the Swedish Interactive Thresholding Algorithm 24-2 standard (Zeiss, Dublin, CA, USA). The categorization of early versus advanced stages was determined based on visual field mean deviation (MD), using a cut-off of -6.0 dB. Then subjects underwent anatomical MRI (voxel size=0.8×0.8×0.8 mm3) and functional MRI (voxel size=2.3×2.3×2.3 mm3) inside a 3-Tesla Siemens Prisma MRI scanner. For functional MRI, we collected two runs of functional MR images using a gradient-echo echo-planar imaging (EPI) sequence (1 run= 5 min, TR/TE= 1000/32.60 ms). We placed the first imaging slice at the bottom of the fourth ventricle to detect incoming CSF flow (Figure 1a)6. During fMRI scan, flickering checkerboard visual stimuli were presented on a full screen (Figure 1b) for the purpose of inducing large-scale neural activity (Figure 1c).The fMRI data was motion-corrected without spatial or temporal smoothing and registered to the individual’s structural template. Then we extracted the blood-oxygenation-level-dependent (BOLD) signals from the visual cortex mask (hOc1-hOc4v) as well as the fourth ventricle mask which we manually delineated from the first slice of fMRI imaging. We removed the linear trend and obtained the percentage change of BOLD signals for each voxel of masks across time. We also obtained from the clinical ophthalmic tests each individual’s intraocular pressure (IOP), visual field MD, and OCT’s optic nerve head cup-to-disc ratio (C/D), neuroretinal rim area, peripapillary retinal nerve fiber layer (pRNFL) thickness, and macular ganglion cell-inner plexiform layer (mGCIPL) thickness for associations with MRI measurements.
Results
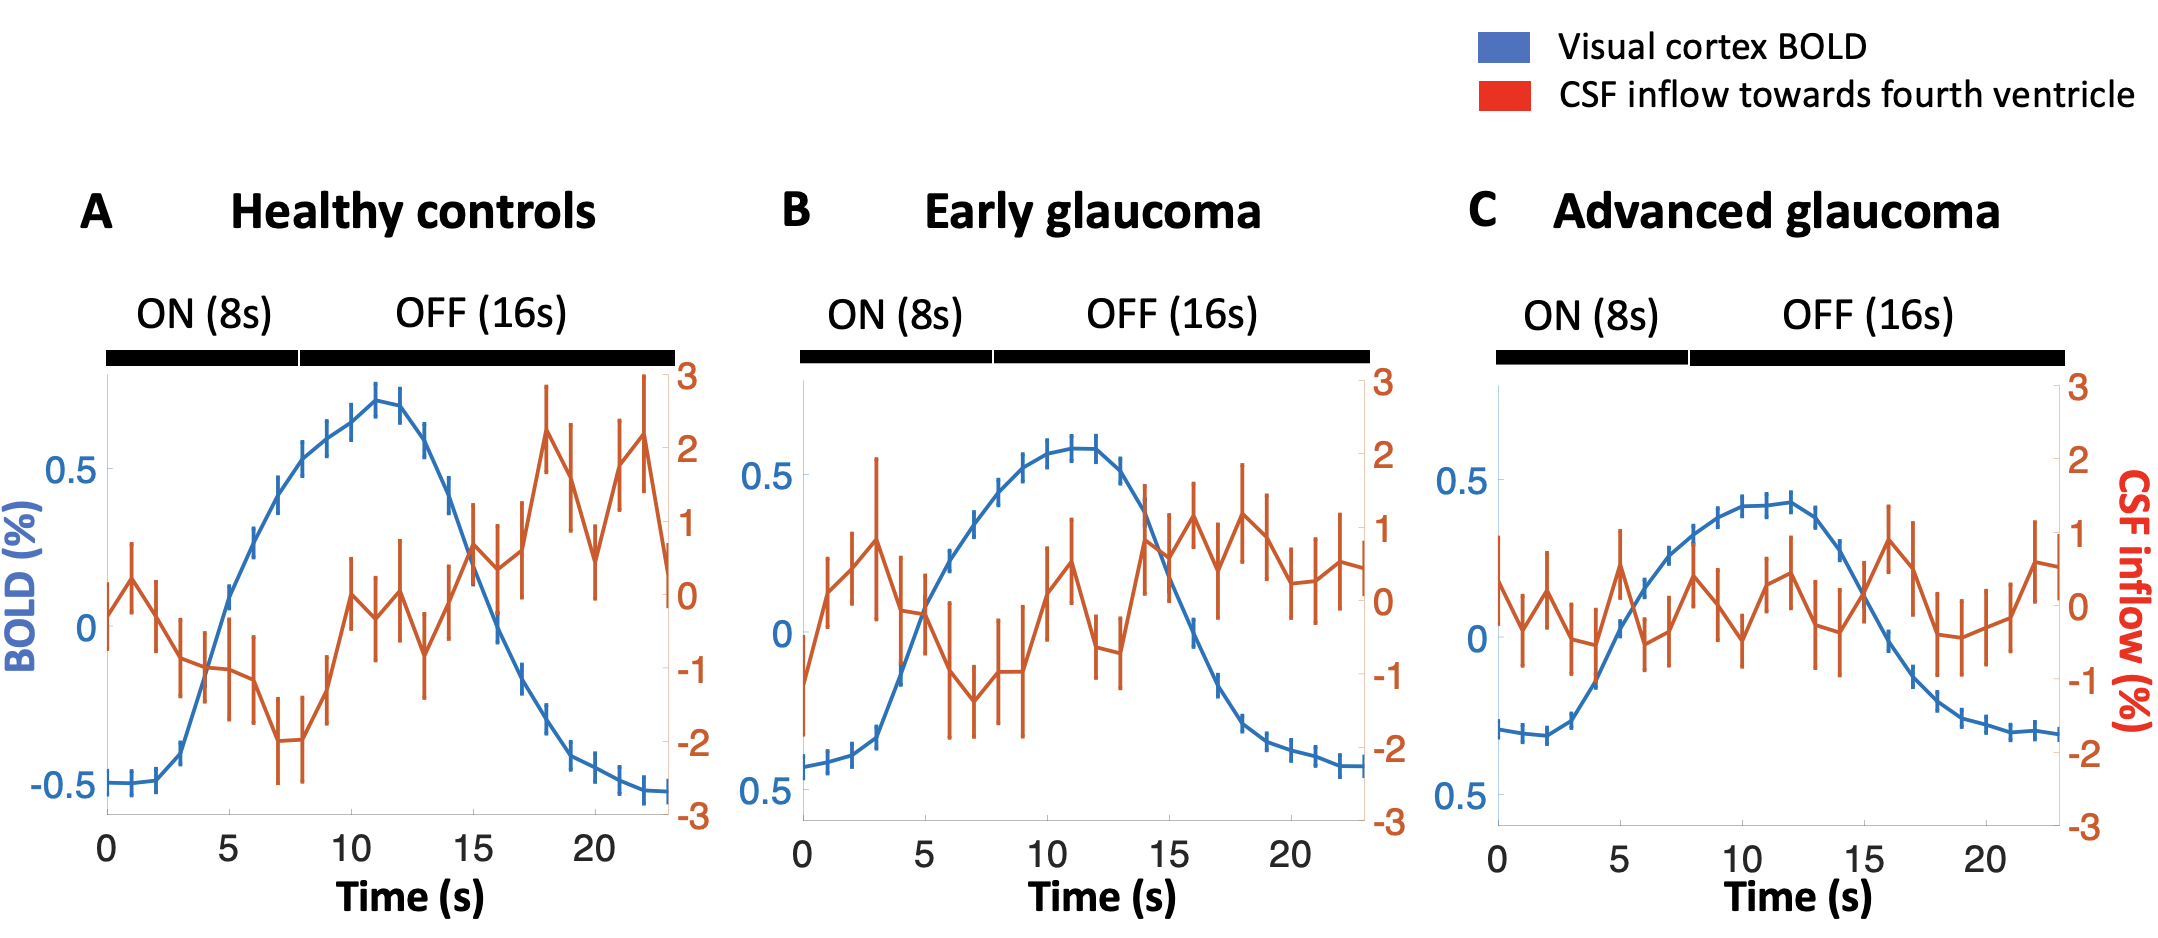
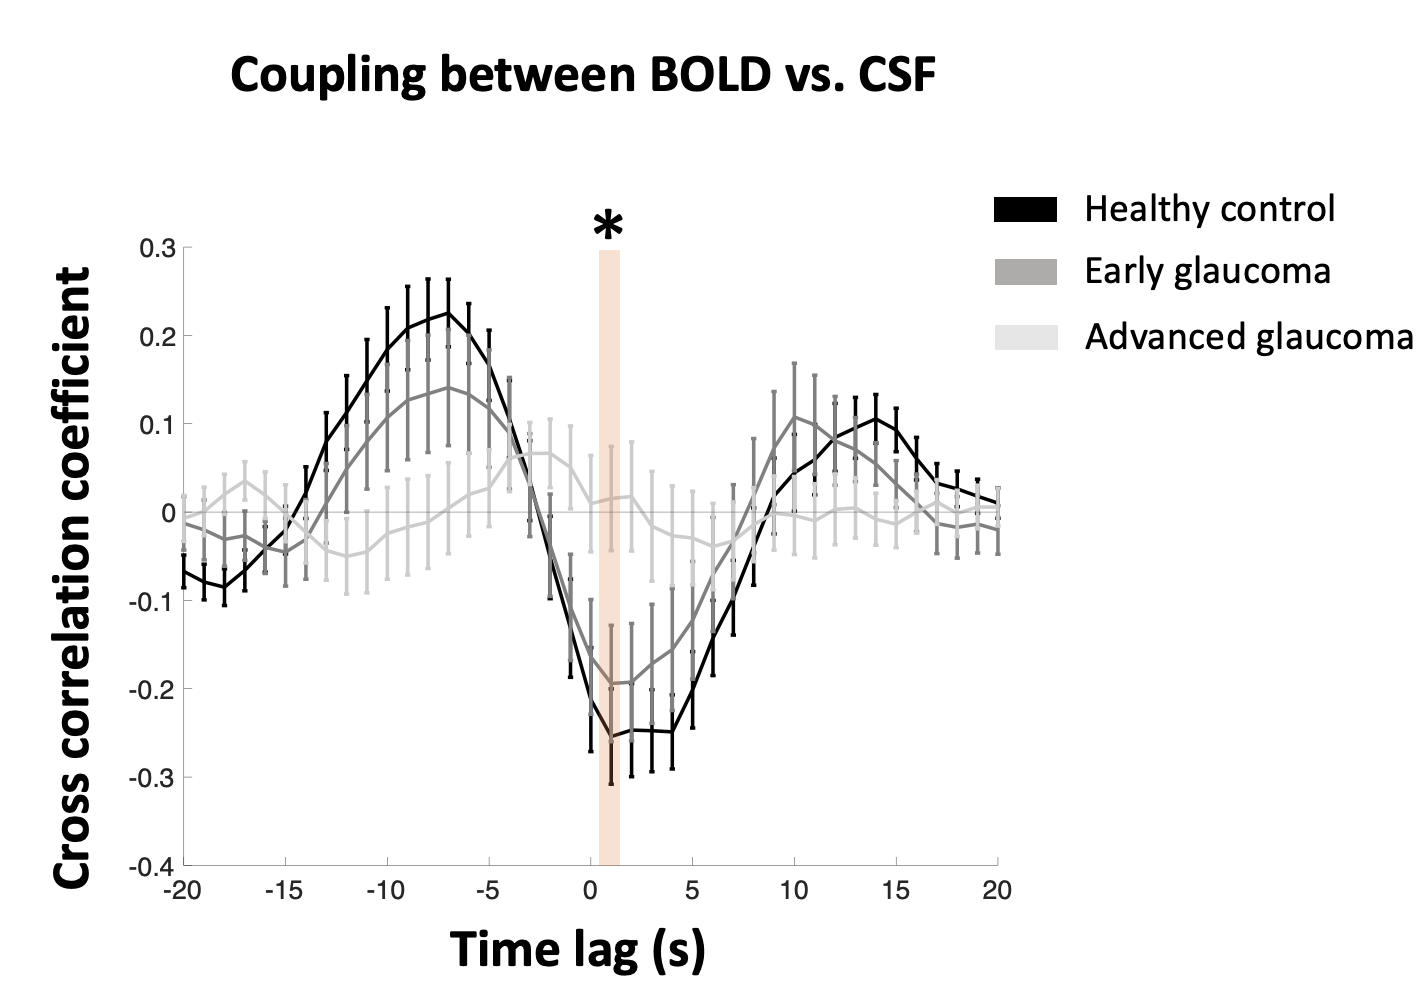
We first investigated whether the stimulation-induced BOLD signal in the visual cortex would lead to anticorrelated CSF inflow in both healthy older adults and glaucoma individuals. Consistent with a recent study in young adults5, in our healthy individuals, the CSF inflow signal was gradually suppressed when the stimulus was presented (1~8 seconds after stimulus onset; decreasing trend across 1~8 seconds, F(1,22)=7.711, P=0.011). The CSF inflow signal reached its lowest value at 7 seconds after stimulus onset (T(22)=-3.471, P=0.002, one-sample t-test). Following this, the CSF inflow signal gradually began to increase until 14 seconds after stimulus offset (increasing trend across 1~14 seconds after stimulus offset, F(1,22)=11.068, P=0.003), reaching its peak value at 10 seconds after stimulus offset (T(22)=-3.858, P<0.001, one-sample t-test). However, these stimulus-locked CSF inflow patterns became weakened in early (decreasing trend across 1~8 seconds after stimulus onset, F(1,17)=4.952, P=0.040; increasing trend across 1~14 seconds after stimulus offset, F(1,17)=1.705, P=0.209) and advanced glaucoma patients (decreasing trend across 1~8 seconds after stimulus onset, F(1,23)=0.190, P=0.667; increasing trend across 1~14 seconds after stimulus offset, F(1,23)=0.021, P=0.886), indicating that the influence of BOLD activity on CSF inflow is reduced in glaucoma (Figure 2).Next, we investigated the temporal relationship between visual cortex BOLD signal and CSF inflow signal by calculating the cross-correlation between two signals. The results showed that the CSF inflow signal exhibits the strongest negative correlation with the BOLD signal at a lag of 1 second (Figure 3). The absolute value of the correlation coefficient, which reflects coupling between the BOLD and CSF inflow signals, gradually decreased among early and advanced glaucoma patients (linear trend, F(1,62)=11.178, P=0.001; main effect of group, F(2,62)=6.102, P=0.004; healthy control vs early glaucoma, P>0.05; healthy control vs advanced glaucoma, P=0.004; early vs advanced glaucoma, P=0.054, Bonferroni-corrected).
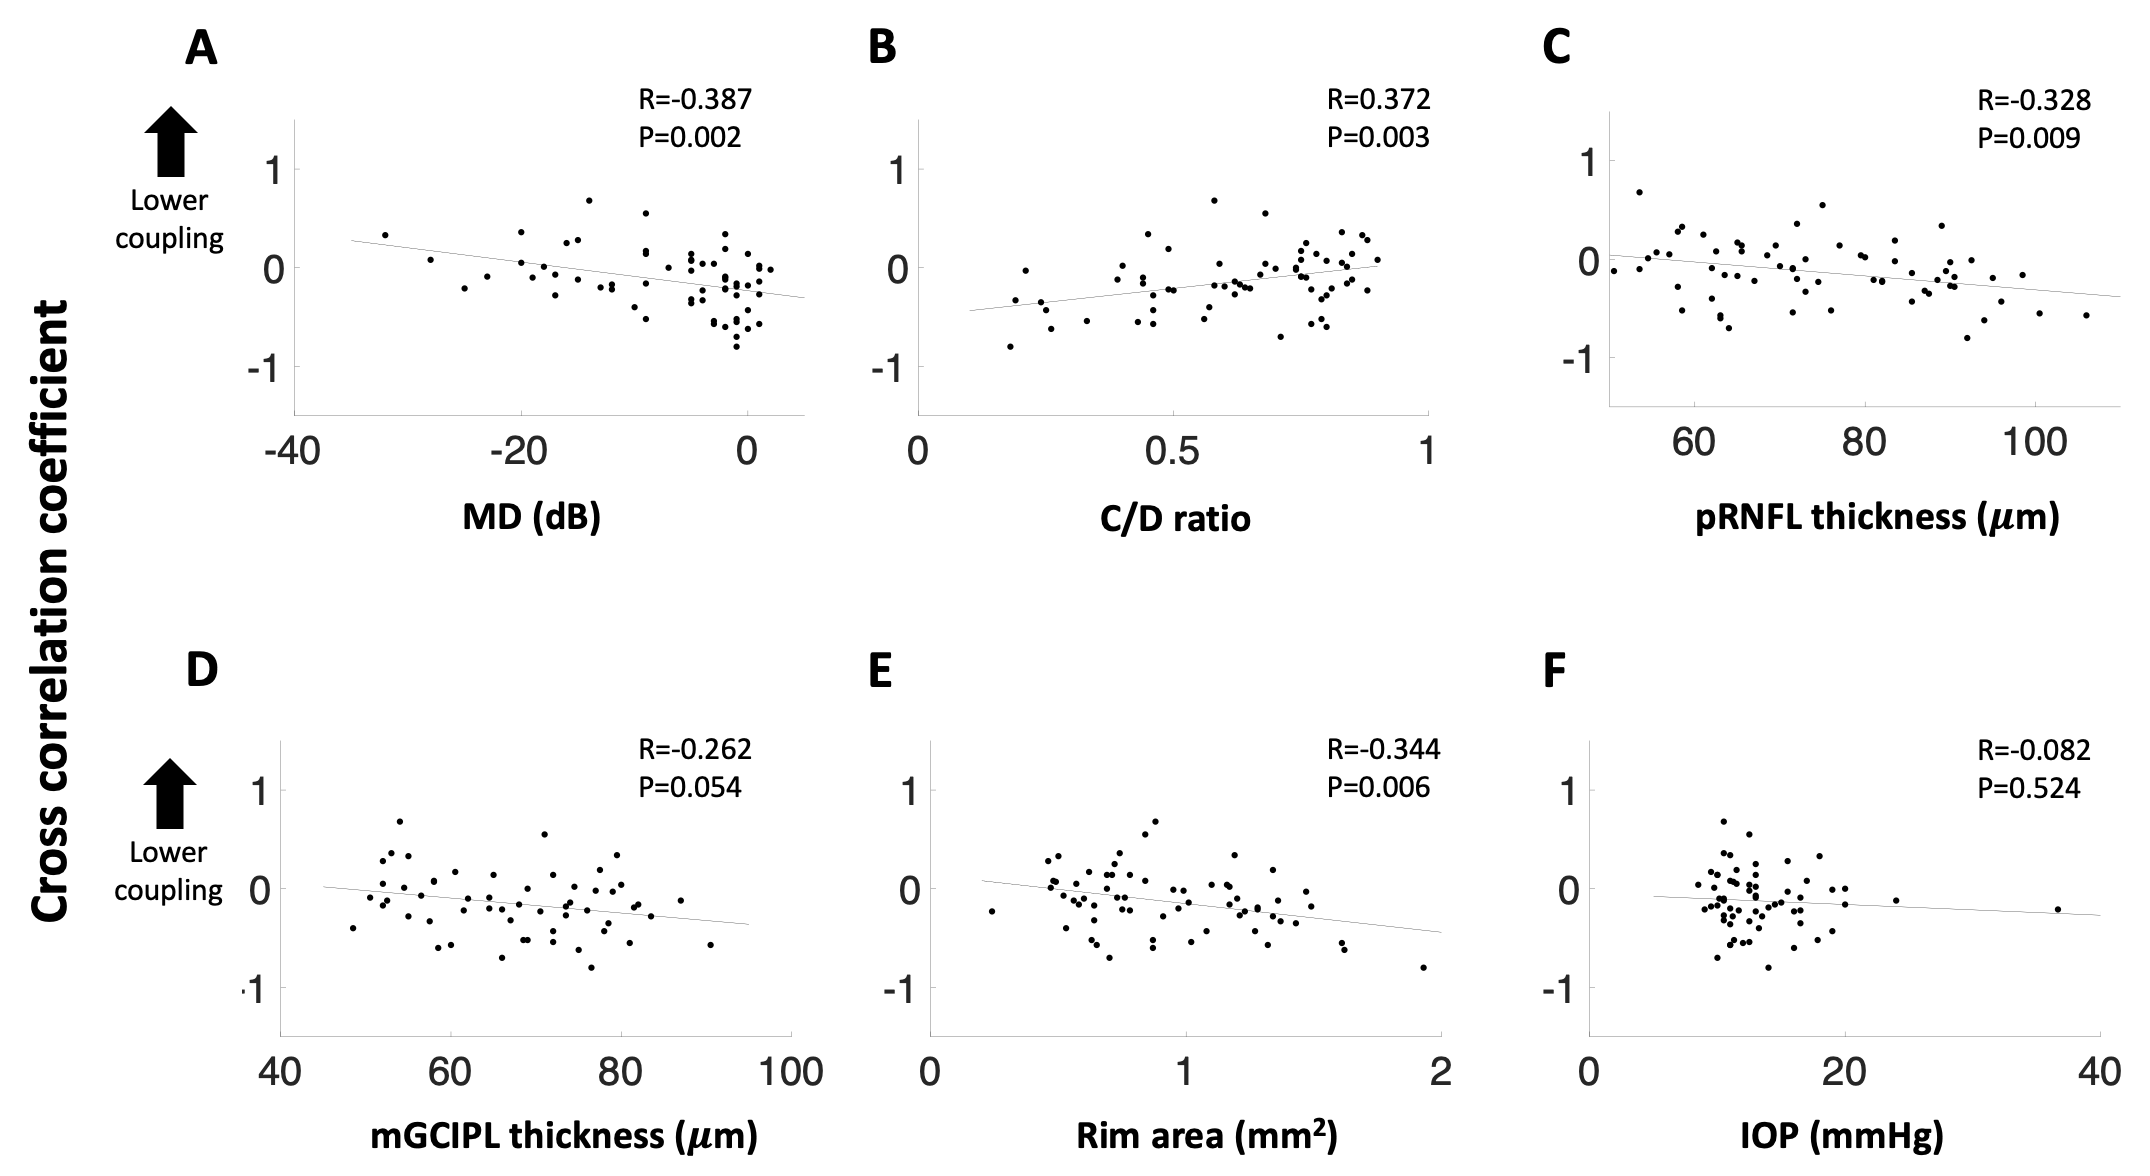
Additionally, the clinical ophthalmic measures were correlated with the coupling between the BOLD and CSF inflow signals (Figure 4). Specifically, reduced coupling was associated with smaller values of MD (P=0.002), pRNFL thickness (P=0.009), mGCIPL thickness (P=0.054), rim area (P=0.006), and a higher C/D ratio (P=0.003), but not with IOP (P=0.524).
Discussion and Conclusion
Our study shows that the stimulus-locked CSF inflow signals are reduced in glaucoma. As glaucoma severity increases, the coupling between the BOLD and CSF inflow signals decreases. This finding offers a novel perspective of the glaucoma pathogenesis, suggesting that glaucoma involves alterations in the CSF dynamics apart from neurodegeneration along the visual pathway.Acknowledgements
This work is supported in part by the National Institutes of Health R01-EY028125, R01-EY013178, and P41-EB017183 (Bethesda, Maryland), BrightFocus Foundation G2016030, G2019103, and G2021001F (Clarksburg, Maryland), and an unrestricted grant from Research to Prevent Blindness to NYU Langone Health Department of Ophthalmology (New York, New York).References
1 Murphy, M. C. et al. Retinal Structures and Visual Cortex Activity are Impaired Prior to Clinical Vision Loss in Glaucoma. Sci Rep-Uk 6, doi:10.1038/srep31464 (2016).
2 Wostyn, P. & Killer, H. E. Normal-Tension Glaucoma: A Glymphopathy? Eye Brain 15, 37-44, doi:10.2147/EB.S401306 (2023).
3 Han, F. et al. Reduced coupling between cerebrospinal fluid flow and global brain activity is linked to Alzheimer disease-related pathology. PLoS Biol 19, e3001233, doi:10.1371/journal.pbio.3001233 (2021).
4 Han, F. et al. Decoupling of Global Brain Activity and Cerebrospinal Fluid Flow in Parkinson's Disease Cognitive Decline. Mov Disord 36, 2066-2076, doi:10.1002/mds.28643 (2021).
5 Williams, S. D. et al. Neural activity induced by sensory stimulation can drive large-scale cerebrospinal fluid flow during wakefulness in humans. PLoS Biol 21, e3002035, doi:10.1371/journal.pbio.3002035 (2023).
6 Fultz, N. E. et al. Coupled electrophysiological, hemodynamic, and cerebrospinal fluid oscillations in human sleep. Science 366, 628-631, doi:10.1126/science.aax5440 (2019).
Figures