0992
The effect of low frequency visual stimulation on CSF flow in the fourth ventricle measured with BOLD-fMRI1Radiology, Leiden University Medical Center, Leiden, Netherlands, 2Neurology, Massachusetts General Hospital, Boston, MA, United States
Synopsis
Keywords: Neurofluids, fMRI (task based), CSF flow, brain clearance
Motivation: Glymphatic clearance is impaired in neurodegenerative disease. Vasomotion has been suggested to drive CSF flow and influence clearance. Furthermore, low frequency sensory stimulation can enhance vasomotion. Whether low frequency visual stimulation can drive CSF flow in humans is still unclear.
Goal(s): To study the effect of different visual stimulation frequencies on BOLD signal and CSF flow.
Approach: 7T BOLD-fMRI scans were acquired in healthy volunteers watching a checkerboard flashing at 0.025, 0.05, or 0.1 Hz.
Results: Visual cortex BOLD responses clearly oscillated at the stimulation frequencies, with increased power at lower frequencies. CSF flow responses observed in the fourth ventricle, however, were modest.
Impact: This preliminary study confirms that BOLD responses can be evoked locally in the brain with low frequency visual stimulation, but that there is only modest effect on ventricular CSF flow.
Introduction
Impaired brain clearance is thought to play a major role in the pathophysiology of neurodegenerative diseases such as Alzheimer’s disease and cerebral amyloid angiopathy.1 Perivascular spaces are cerebrospinal fluid (CSF)-filled spaces that surround arterioles in the brain, and have been suggested to serve as important clearance pathways.2 A recently recognized driving force of perivascular clearance is vasomotion,3 which is defined as spontaneous, low-frequency (~0.1 Hz) changes in vessel diameter. Vasomotion can be tuned and enhanced in the mouse visual cortex through repeated visually-evoked neurovascular coupling,4 which has shown to increase fluorescent tracer clearance.3 In humans asleep during MRI, it was shown that slow oscillations in gray matter BOLD signal were coupled to oscillations in fourth ventricle CSF flow.5 Recently, Williams et al.,6 have shown that visual stimulation can induce fourth ventricle CSF flow. Together, these studies indicate that vessel diameter changes in the brain can induce CSF flow, thereby possibly promoting waste efflux from the brain. It is however still unclear whether driving vessel diameter changes at the intrinsic low vasomotion frequency may increase CSF flow oscillations, and thus be a novel approach to promote brain clearance in future clinical studies. Here, we therefore studied the effect of low-frequency visual stimulation on fourth ventricle CSF flow.Methods
Image acquisition - Eight healthy volunteers gave written informed consent and were scanned on a 7T MRI scanner (Philips) with a head transmit-coil and a 32-channel receive coil. After a 3D T1-weighted scan was acquired, an fMRI stack was planned such that the first slice intersects the fourth ventricle - to measure CSF inflow effects – and such that it encompasses the visual cortex. The fMRI gradient-echo EPIs were acquired with the following parameters: TR/TE: 470/22 ms; flip angle: 40◦; matrix: 256x256; 18 slices, 2.5 mm3 isotropic resolution, multiband factor 2 and a total scan duration of 5 minutes. Four fMRI scans were acquired, during which the volunteers were presented with a screen displaying an 8 Hz-flickering checkerboard flashing at different on/off frequencies: 0.1Hz (5s on/5s off), 0.05Hz, 0.025Hz or no visual stimulation.Image processing – Affine coregistration between the EPIs and the 3D T1-weighted scan was done with Elastix.7 The other pre-processing steps – brain segmentation, EPI motion correction, EPI slice time-correction, and signal retrieval from the neuromorphometrics atlas (visual cortex and whole cortical gray matter) - were done with SPM12. The fourth ventricle signal was retrieved by manual delineation on uncorrected fMRI scans. The signals were subsequently filtered (demeaned, detrended and low-pass filtered [<0.15 Hz]) and area under the - filtered - curve (AUC) was calculated as the sum of the absolute values. Cross-correlations were performed between ‑25 and +25 TR lags.
Results
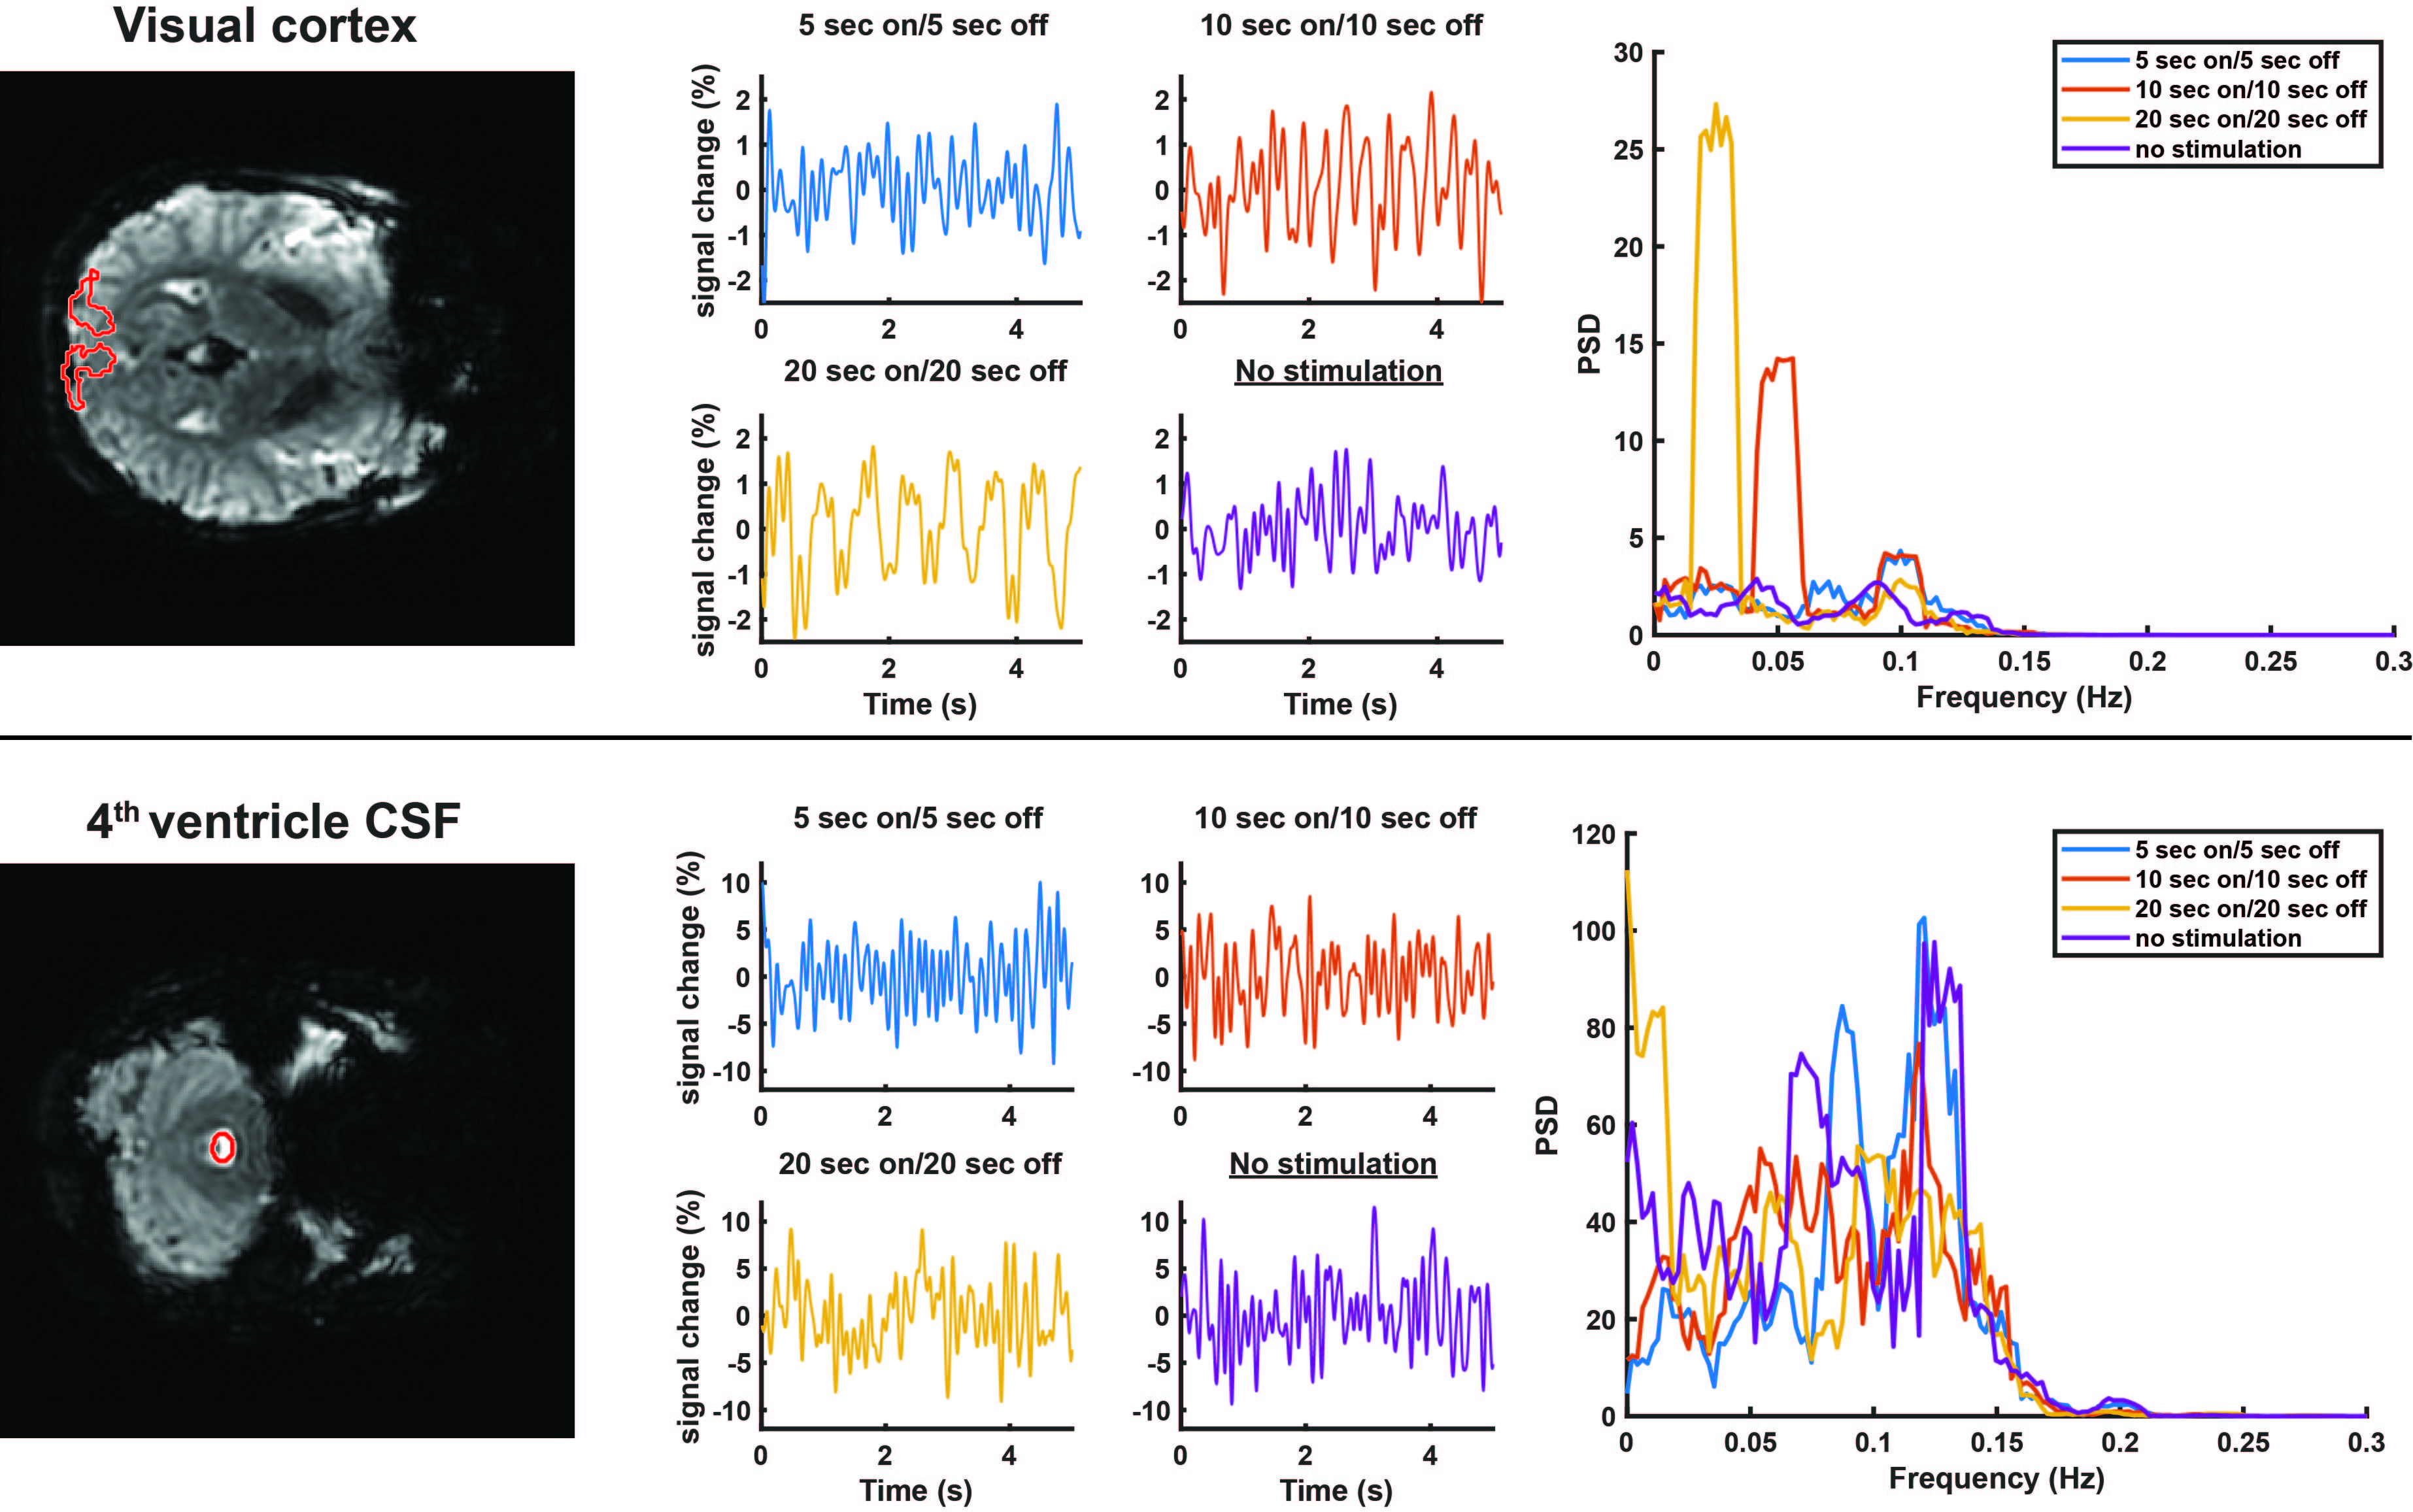
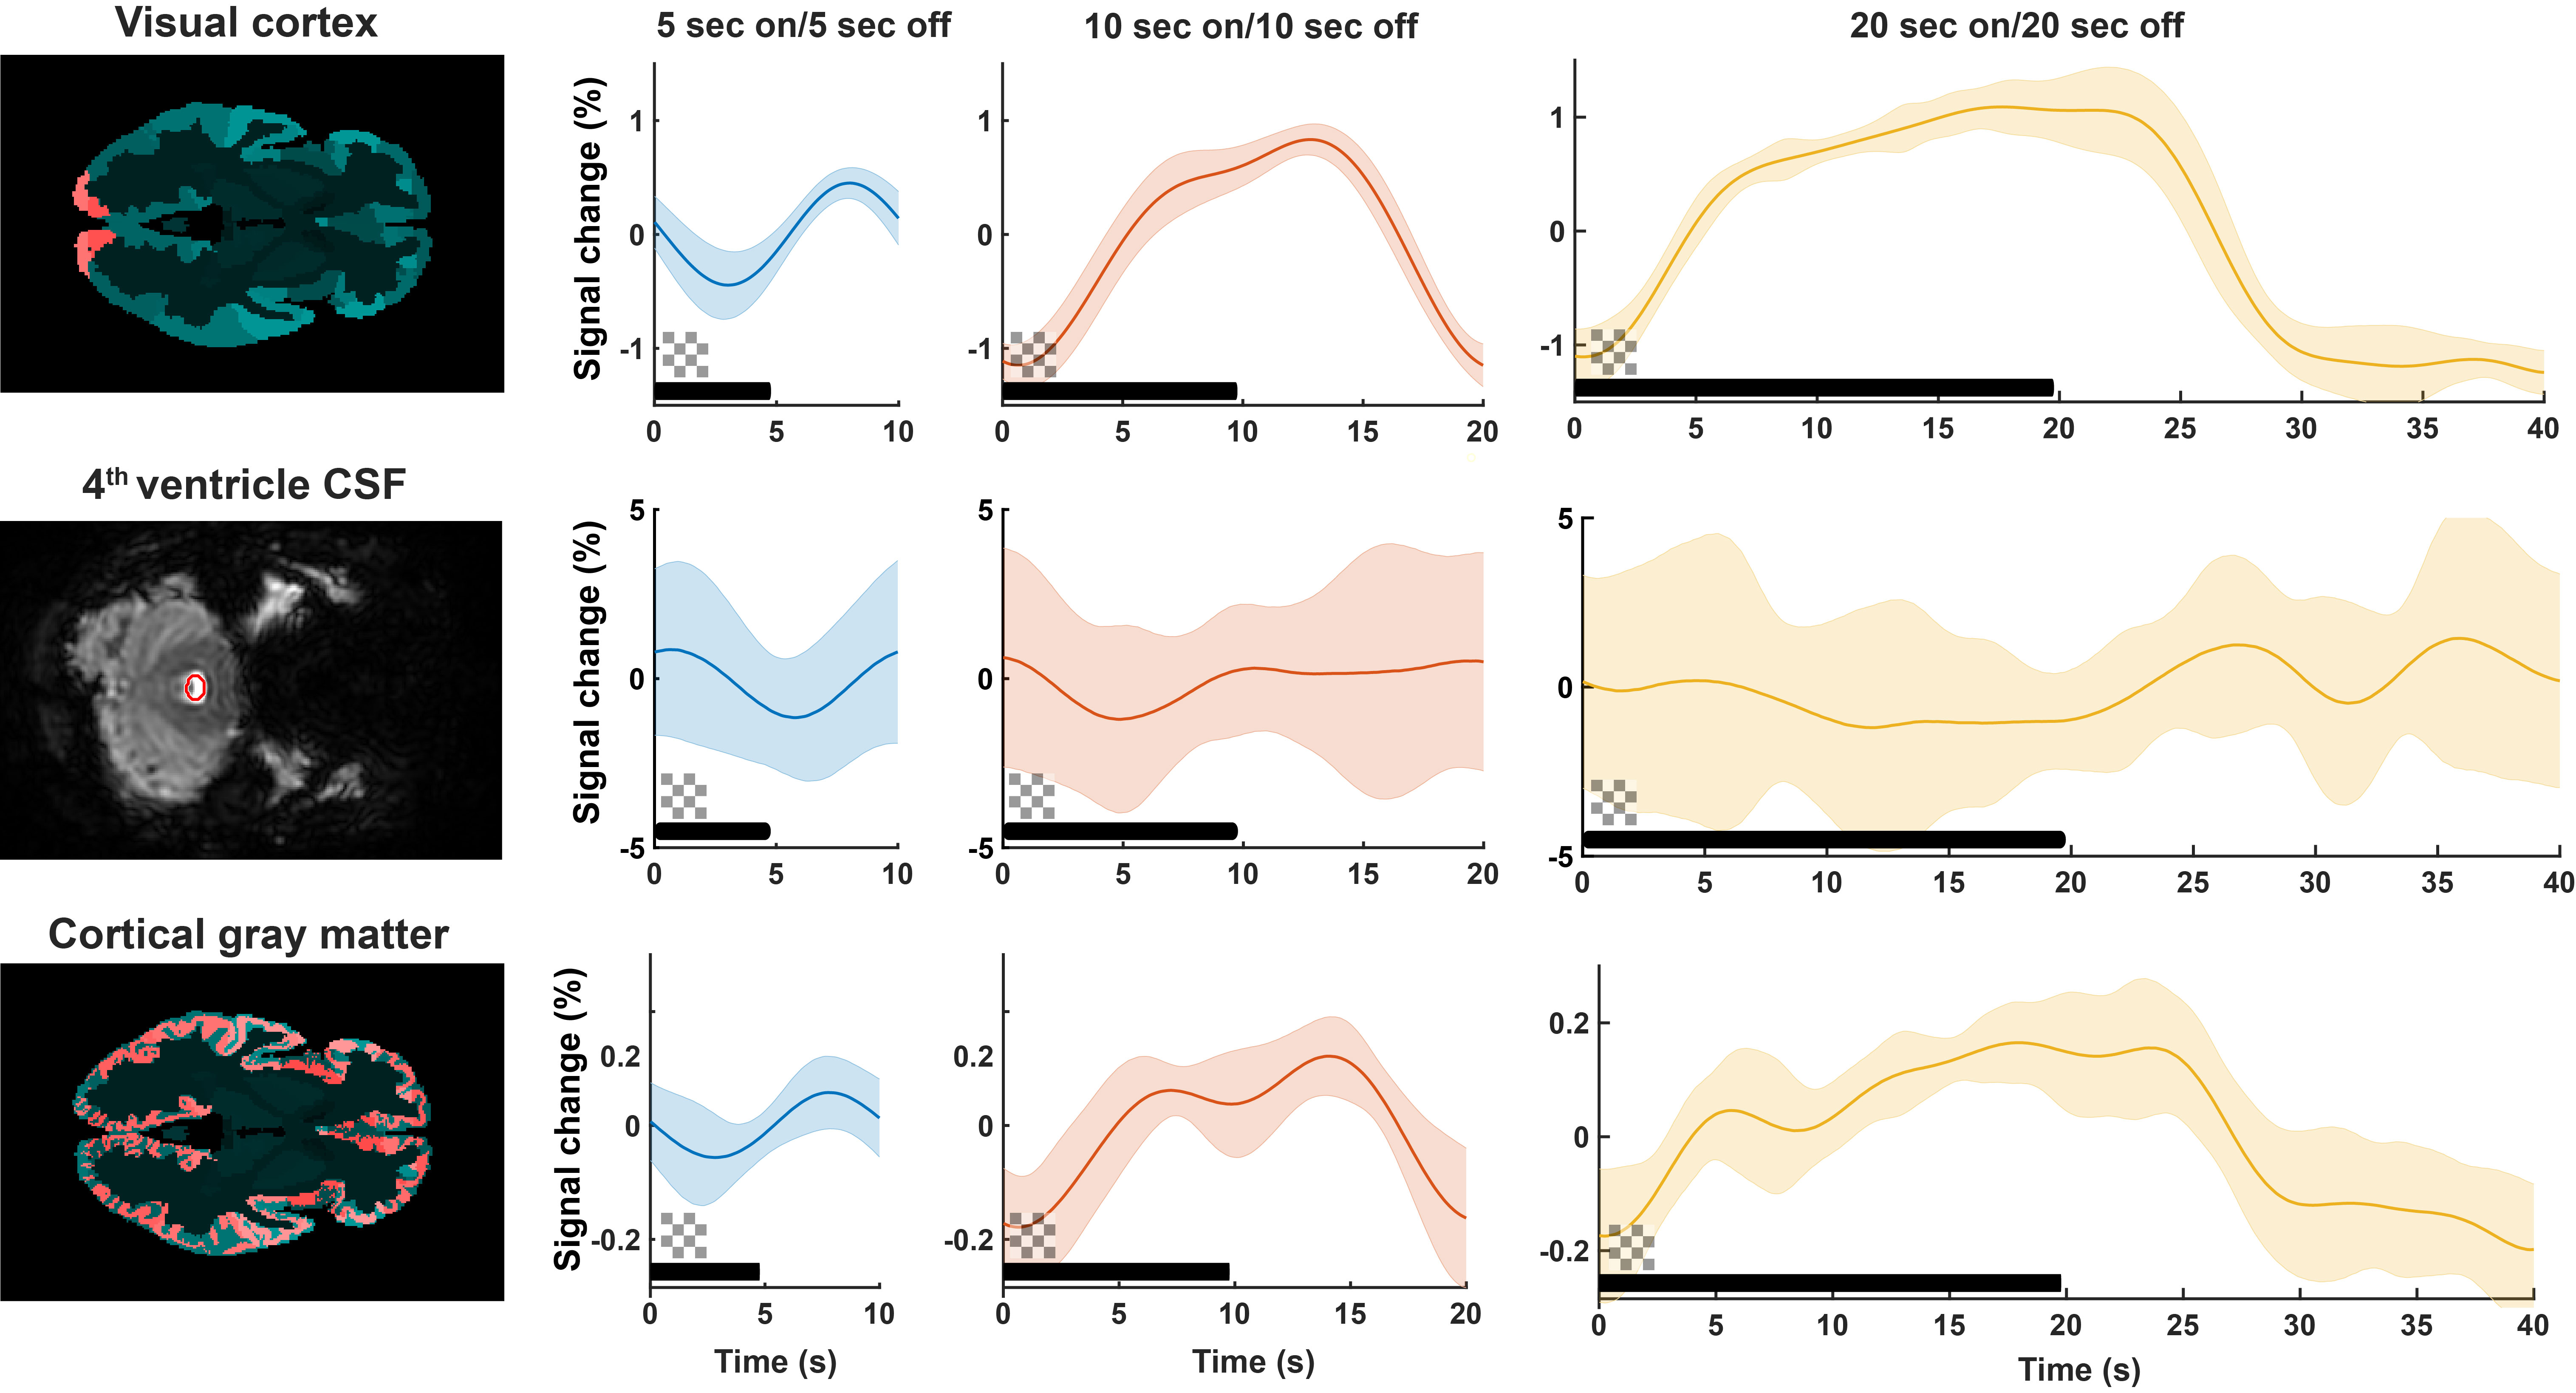
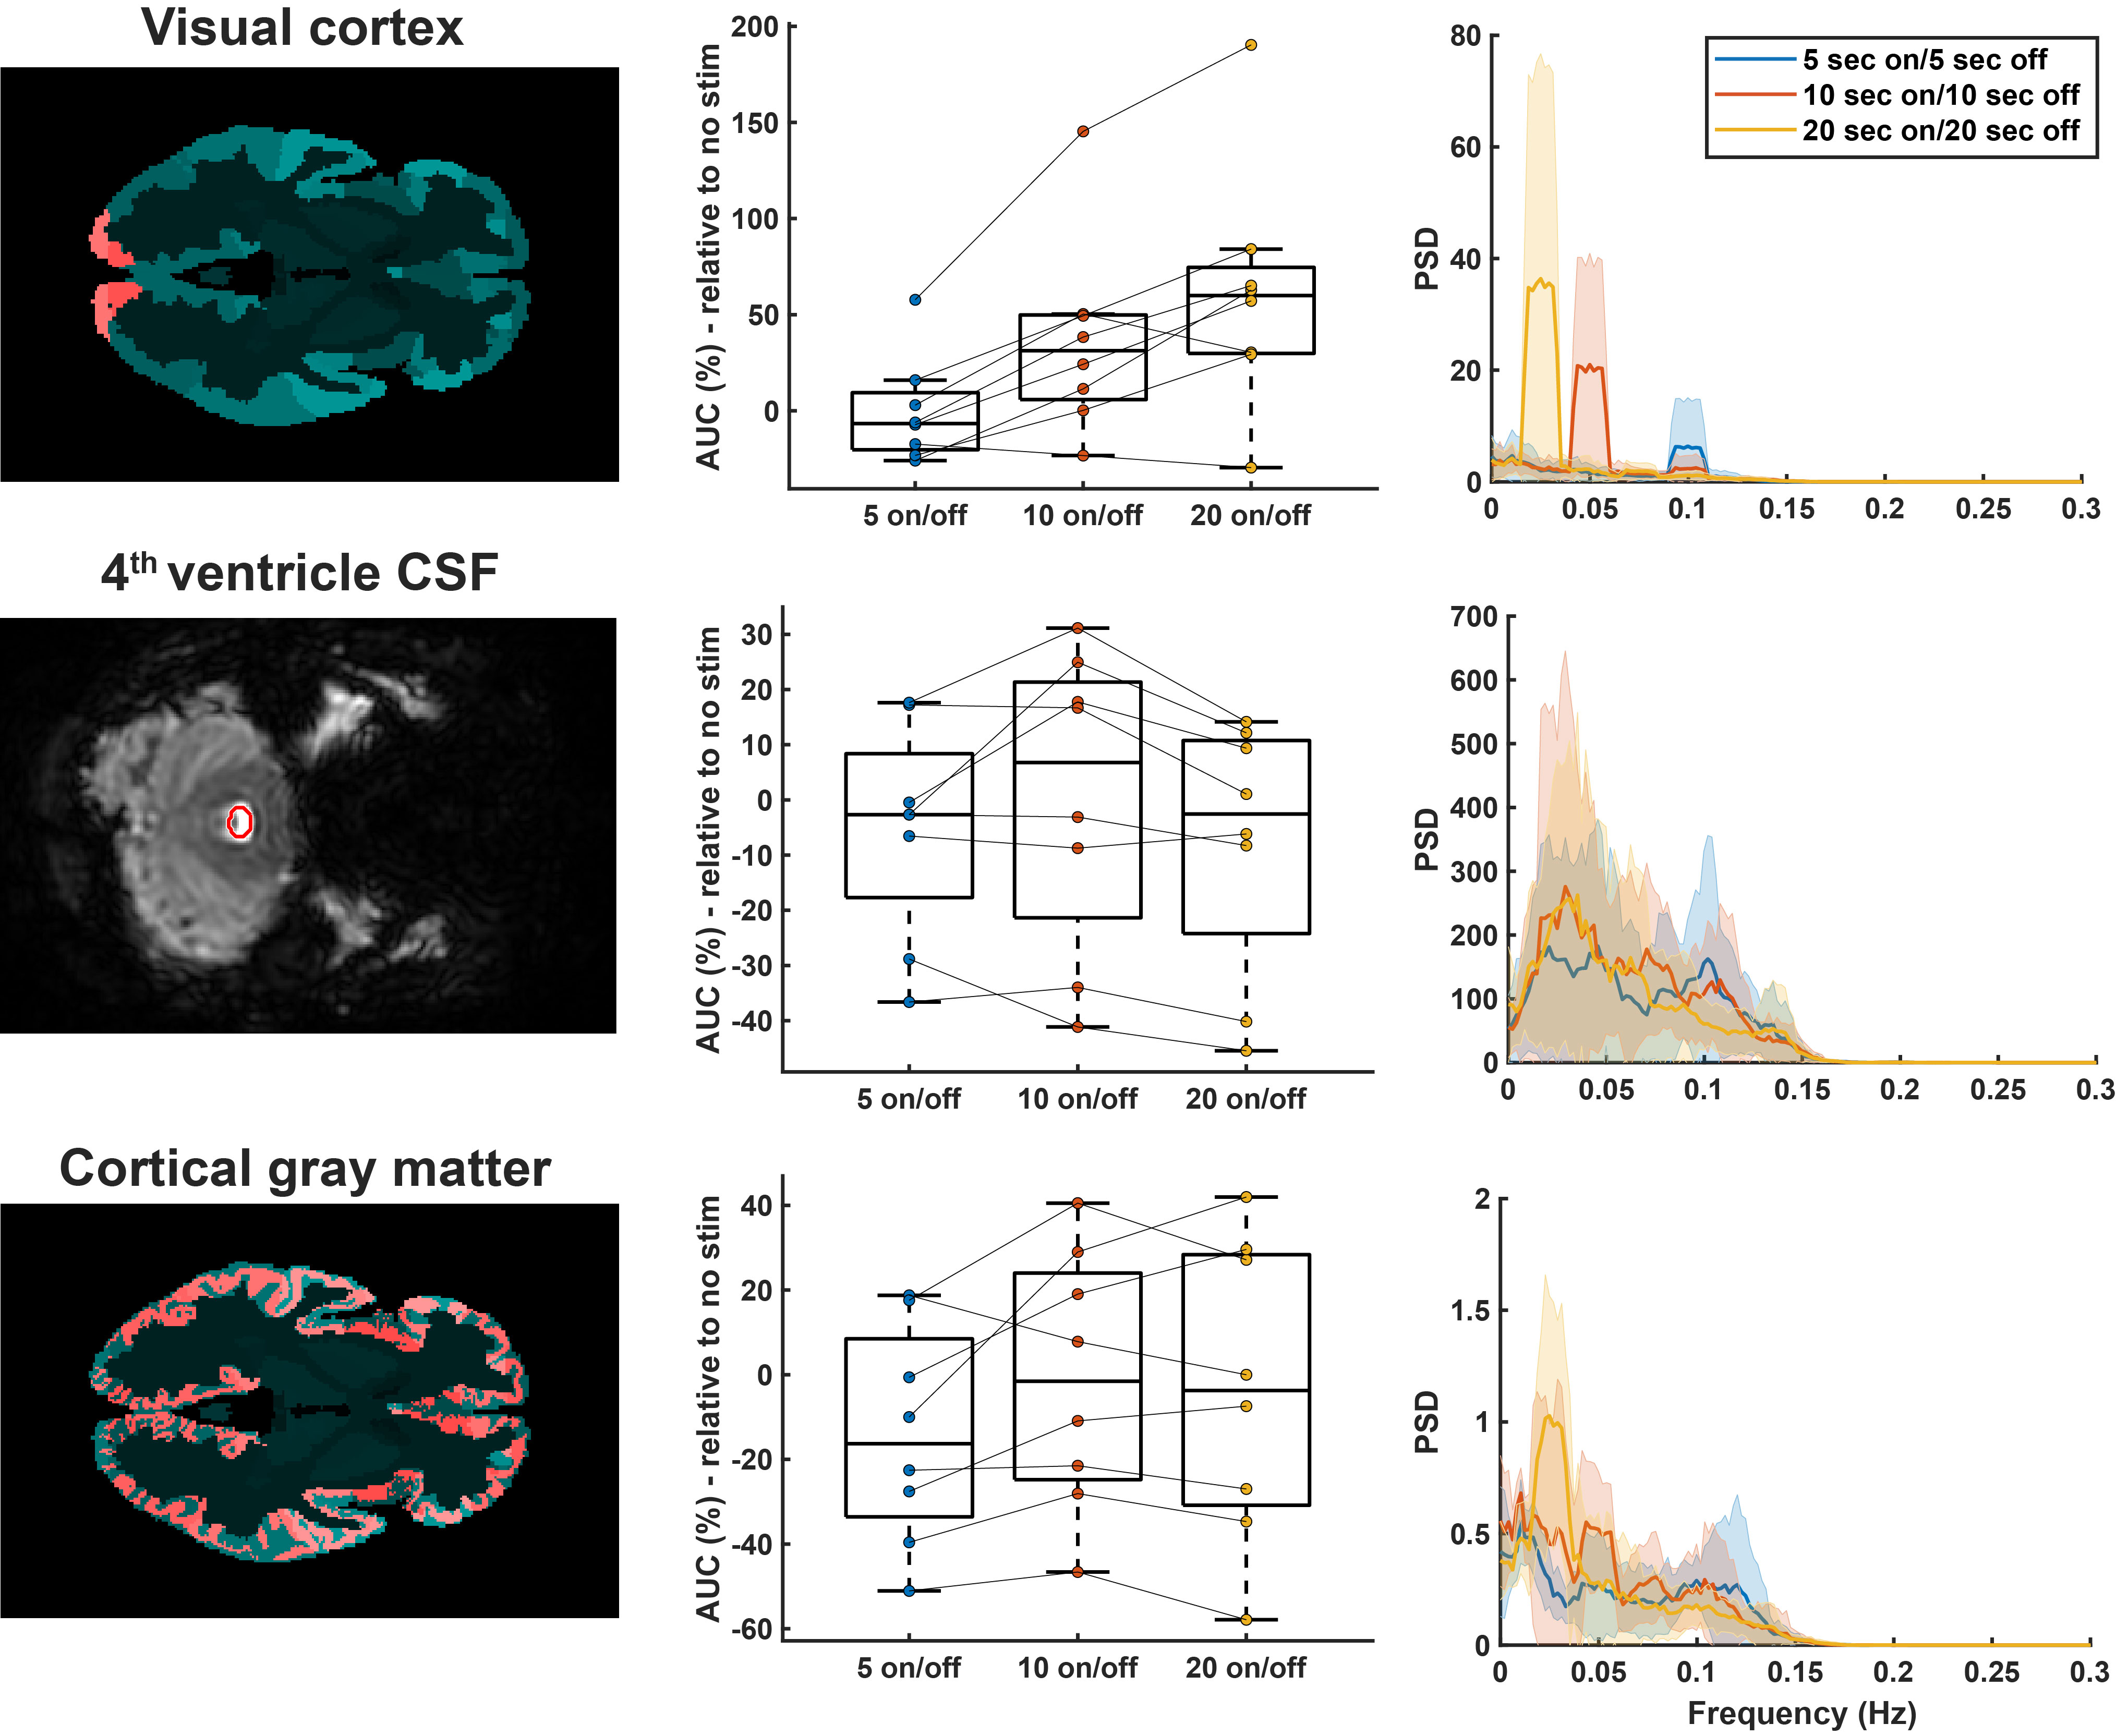
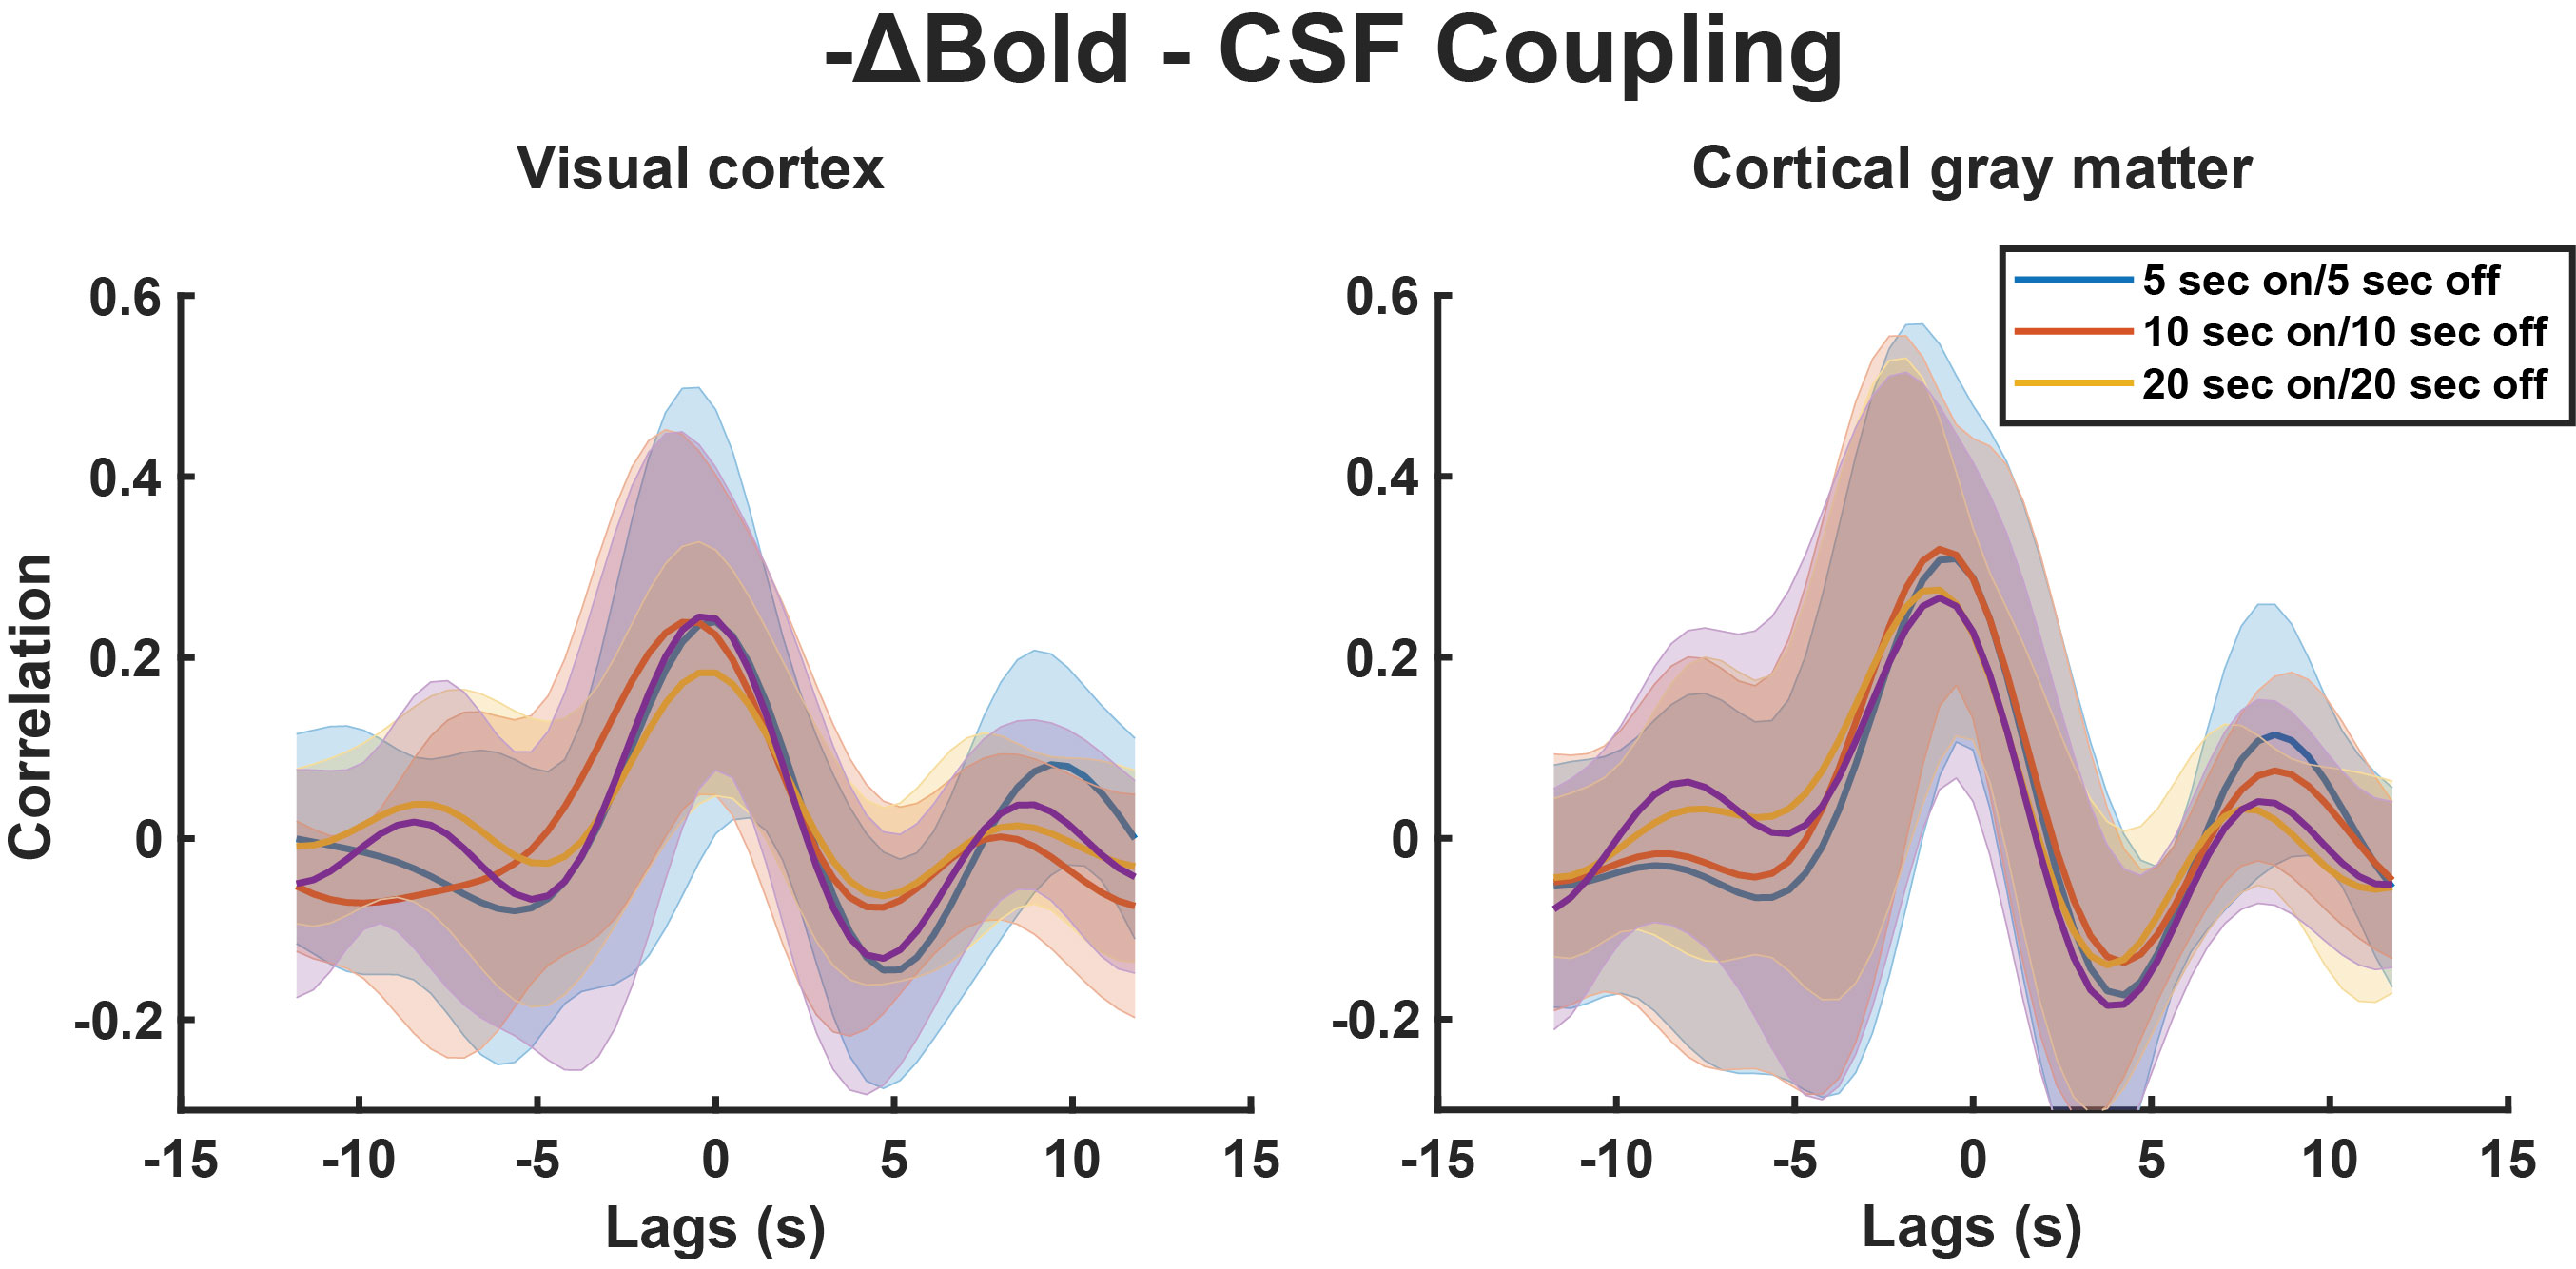
A representative example dataset is shown in figure 1. In the visual cortex, the filtered time-profiles show gray matter BOLD signal oscillations that follow those of the visual stimulation paradigm. This is, however, not clear in the ventricular CSF signal. Figure 2 shows averaged signals from the visual cortex and fourth ventricle over all volunteers and all runs. At lower frequencies, higher peak signal changes can be observed (from 0.5% at 0.1 Hz to 1.1% at 0.025 Hz). The CSF signal roughly follows the expected anti-correlation with the cortical BOLD signal (BOLD signal down, CSF signal up), but is noisy. The whole cortical gray matter was also analyzed for comparison. To determine which stimulation paradigm results in the largest signal fluctuations, the AUC and average power was plotted (figure 3), showing that lower frequencies result in higher AUC in the visual cortex, but no clear patterns in the whole cortical gray matter or CSF. Lastly, figure 4 shows that cross-correlation between cortical and CSF signals is not significantly altered by the visual stimulation.Discussion
This findings from this preliminary study suggest that between 0.025 – 0.1 Hz, visual cortex BOLD responses are higher at lower stimulation frequencies. The effects of the visual stimulation are nearly undetectable in the fourth ventricle, however, which is in contrast to Williams et al.6 who measured CSF signal changes around 10% in response to visual stimulation. Next steps include increasing the sample size and analyzing different ventricular regions to study if power or ventricular region could underlie the discrepancy with previous work.Conclusion
Somewhat unexpectedly, the findings from this preliminary study suggest that driving vessel diameter changes in the visual cortex at the vasomotion frequency in the human brain does not clearly increase CSF flow oscillations in the fourth ventricle. Ongoing work is focused on exploring other stimulation approaches and analysis of different CSF compartments.Acknowledgements
This work was supported by Alzheimer Nederland (WE.25-2020-05 to SvV and 77522 to LvdW).References
1. Mawuenyega, K. G. et al. Decreased clearance of CNS β-amyloid in Alzheimer’s disease. Science (1979) 330, 1774 (2010).
2. Iliff, J. J. et al. A paravascular pathway facilitates CSF flow through the brain parenchyma and the clearance of interstitial solutes, including amyloid β. Sci Transl Med 4, 147ra111 (2012).
3. van Veluw, S. J. et al. Vasomotion as a Driving Force for Paravascular Clearance in the Awake Mouse Brain. Neuron 105, 549-561.e5 (2020).
4. Munting, L. P. et al. Spontaneous vasomotion propagates along pial arterioles in the awake mouse brain like stimulus-evoked vascular reactivity. J Cereb Blood Flow Metab. 10, 1752-1763 (2023).
5. Fultz, N. E. et al. Coupled electrophysiological, hemodynamic, and cerebrospinal fluid oscillations in human sleep. Science 366, 628–631 (2019).
6. Williams, S. D. et al. Neural activity induced by sensory stimulation can drive large-scale cerebrospinal fluid flow during wakefulness in humans. PLoS Biol 21, e3002035 (2023).
7. Klein, S., Staring, M., Murphy, K., Viergever, M. A. & Pluim, J. P. W. elastix: a toolbox for intensity-based medical image registration. IEEE Trans Med Imaging 29, 196–205 (2010).
Figures