0991
Dynamic measurement of concurrent BOLD and brain tissue displacement quantification in vivo at 7T using motion-encoded stimulated-echo EPI1Harvard-MIT Health Sciences and Technology, Massachusetts Institute of Technology, Cambridge, MA, United States, 2Athinoula A. Martinos Center for Biomedical Imaging, Massachusetts General Hospital, Charlestown, MA, United States, 3Department of Physics, Carleton University, Ottawa, ON, Canada, 4University of Ottawa Institute of Mental Health Research, Royal Ottawa Mental Health Centre, Ottawa, ON, Canada, 5Department of Radiology, Harvard Medical School, Boston, MA, United States, 6Max Planck Institute for Biological Cybernetics, Tübingen, Germany, 7Department of Electrical Engineering and Computer Science, Massachusetts Institute of Technology, Cambridge, MA, United States
Synopsis
Keywords: Neurofluids, High-Field MRI, Tissue Characterization, Diffusion Acquisition, fMRI Analysis, Multi-Contrast
Motivation: Understanding the spatiotemporal relationships between blood volume changes, tissue displacement, and CSF flow is important for elucidating brain waste clearance mechanisms, and measuring these compartments concurrently would enable effective analysis.
Goal(s): To demonstrate the feasibility of leveraging both magnitude-valued and phase-valued data to measure BOLD fMRI and tissue motion simultaneously.
Approach: We apply a combination of computer simulations and in vivo imaging with visual stimulation using the Displacement Encoding with Stimulated Echoes (DENSE) pulse sequence.
Results: DENSE magnitude-valued data show significant response to visual stimulation in the visual cortex, while the phase-valued data show typical cardiac-gated motion in both cortex and brainstem.
Impact: BOLD fMRI can be acquired simultaneously with brain tissue displacement quantification using the DENSE pulse sequence, enabling future spatiotemporal analyses of concurrent blood volume changes, tissue displacement, and CSF flow for understanding waste clearance mechanisms.
Introduction
Blood, tissue, and CSF dynamics may interact to support glymphatic function and brain waste clearance.1,2 Previous human MRI studies investigating these relationships have measured either tissue motion3–10 or blood volume dynamics,11–14 but concurrent measurement would clarify regional spatiotemporal interactions between these compartments. Here, we propose extending the Displacement Encoding with Stimulated Echoes (DENSE) method15 by extracting BOLD-fMRI from the magnitude-valued data, which can serve as a proxy for blood volume dynamics,16 and tissue motion from the phase-valued data. While the DENSE method has been used extensively to quantify tissue displacement with the phase component,17–21 the magnitude component carries T2 weighting that is sensitive to the BOLD contrast, similar to spin-echo BOLD techniques. However, DENSE uses stimulated echoes, and stimulated-echo BOLD is not commonly used and thus not thoroughly understood.22,23 As a proof-of-concept, we first establish the feasibility of stimulated-echo BOLD using simulations and in vivo, and then show simultaneous cardiac-related tissue motion using both the magnitude and phase components of DENSE data. This method has potential for investigating how blood and tissue dynamics may affect CSF flow via cardiac fluctuation and neurovascular coupling mechanisms.24–27 Our findings are also relevant for understanding dynamic partial volume effects in fMRI due to tissue displacement during activation.28Methods
To understand the vessel-size sensitivity of the STE-BOLD signal, Monte Carlo simulations in ten random 2D vessel networks were performed at 7T (2% CBV, 1-μm2/ms diffusion coefficient, 80% baseline venous SO2, 100% activated venous SO2).29,30 Realistic T1 and T2 for tissue at 7T were used.31,32 For all simulations, TE was 54ms and mixing times ranged between 50-500ms. A pure spin-echo simulation was used for comparison.Four healthy volunteers participated after providing written informed consent following our institutional review board-approved protocol. Data were acquired on a 7T Siemens Magnetom Terra using a home-built 64-channel head array coil.33 DENSE EPI data were acquired with velocity encoding (Venc=1.3mm/s) in the Head-Foot direction with interleaved Venc=0 acquisitions for subtraction of background phase offsets. Coil-dependent phase offsets were corrected online using ASPIRE34. Other DENSE sequence parameters included: 2-mm isotropic voxels, 3-s TR, 54-ms TE, 50-ms mixing time, and a 90° excitation flip angle. The temporal resolution of the velocity data was 6 s. Oblique-axial slices were centered on the calcarine sulcus and pons. Single-shot gradient-echo BOLD-weighted EPI was acquired for comparison (2-mm isotropic, 2-s TR, 22-ms TE). Each run included a flickering white noise visual stimulus, presented for 24 s on and 36 s off, for a total of 5 trials.
DENSE images were analyzed within-run in native EPI space, with motion correction using AFNI and automated phase unwrapping.17,35 For magnitude analyses, baseline was defined separately for motion encoded and non-encoded frames. Each slice of the DENSE images was retrospectively assigned to a time within the cardiac cycle using recordings from an external fingertip piezoelectric device, and median phase values were calculated in each slice separately. Velocity is the primary measure of interest given the single mixing time used. Regions of interest were defined on a MEMPRAGE structural scan then resampled to EPI space. FSL FEAT was used to estimate voxelwise visual responses.36 Cardiac cycle coherence of velocities was estimated using the R2 value between even and odd heartbeats.37
Results
Simulations show that STE-BOLD has microvascular weighting like that of SE-BOLD, especially at the short mixing time used (Figure 1). In vivo, the STE-BOLD response to visual stimulation is noticeable across participants, though peak signal changes are lower overall compared to GRE-BOLD after averaging multiple DENSE runs, as expected (Figure 2). Cardiac-related motion is present in the brainstem, in a pattern similar to our previous work,38 and in visual cortex (Figure 3A). There is no appreciable trend of tissue motion with visual stimulation, likely due to a small effect size combined with insufficient precision with the DENSE parameters used (Figure 3B). Voxelwise analyses show significant STE-BOLD response to visual stimulation in the occipital cortex (p<0.05, Figure 4A). Velocity patterns are aligned to the cardiac cycle in the center of the brain and at CSF boundaries (Figure 4B).Discussion
Here, we demonstrate that concurrent BOLD and tissue motion quantification is feasible using the magnitude-valued and phase-valued data,39,40 respectively, acquired using the DENSE method. Moreover, we show that STE-BOLD is sensitive to the microvascular hemodynamics that may be responsible for brain tissue expansion and displacement.4,18–20,41 Simultaneity of these measurements allows for valuable intercompartment analyses between blood, tissue, and CSF, and their interactions.11 This is particularly valuable when studying dynamics that are not trial-locked, such as fluctuations occurring in the resting state or during sleep (Figure 5).Acknowledgements
We would like to thank Estee Perelgut, Sarah Richter and Kyle Droppa for their help with subject recruitment and MRI scanning support, Azma Mareyam and Dr. John Kirsch for 7T hardware support. This work was supported in part by the NIH NIBIB (P41-EB030006, T32-EB1680), by the BRAIN Initiative (NIH NINDS grants U19-NS123717 and U19-NS128613), and by the MGH/HST Athinoula A. Martinos Center for Biomedical Imaging; and was made possible by the resources provided by NIH Shared Instrumentation Grant S10-OD023637.
References
1. Iliff, J. J. et al. A paravascular pathway facilitates CSF flow through the brain parenchyma and the clearance of interstitial solutes, including amyloid β. Sci. Transl. Med. 4, 147ra111 (2012).
2. Kedarasetti, R. T. et al. Functional hyperemia drives fluid exchange in the paravascular space. Fluids Barriers CNS 17, 52 (2020).
3. Wolf, K. et al. CSF Flow and Spinal Cord Motion in Patients With Spontaneous Intracranial Hypotension: A Phase Contrast MRI Study. Neurology 100, e651–e660 (2023).
4. Itamar Terem et al. Revealing sub-voxel motions of brain tissue using phase-based amplified MRI (aMRI). Magn. Reson. Med. 80, 2549–2559 (2018).
5. Feinberg, D. A. & Mark, A. S. Human Brain Motion and Cerebrospinal Fluid Circulation Demonstrated with MR Velocity Imaging. Radiology 163, 793–799 (1987).
6. Poncelet, B. P., Wedeen, V. J., Weisskoff, R. M. & Cohen, M. S. Brain Parenchyma Motion: Measurement with Cine Echo-Planar MR Imaging. Radiology 185, 645–651 (1992).
7. Noam Alperin, Eric M. Vikingstad, Beatriz Gomez-Anson & David N. Levin. Hemodynamically independent analysis of cerebrospinal fluid and brain motion observed with dynamic phase contrast MRI. Magn. Reson. Med. (1996) doi:10.1002/mrm.1910350516.
8. Sebastian Hirsch et al. In vivo measurement of volumetric strain in the human brain induced by arterial pulsation and harmonic waves. Magn. Reson. Med. (2013) doi:10.1002/mrm.24499.
9. Dan Greitz et al. Pulsatile brain movement and associated hydrodynamics studied by magnetic resonance phase imaging. The Monro-Kellie doctrine revisited. Neuroradiology (1992) doi:10.1007/bf00596493.
10. Zhang, Z., Karasan, E., Gopalan, K., Liu, C. & Lustig, M. DiSpect: Displacement spectrum imaging of flow and tissue perfusion using spin-labeling and stimulated echoes. Magn. Reson. Med. 86, 2468–2481 (2021).
11. Fultz, N. E. et al. Coupled electrophysiological, hemodynamic, and cerebrospinal fluid oscillations in human sleep. Science 366, 628–631 (2019).
12. Yang, H.-C. S. et al. Coupling between cerebrovascular oscillations and CSF flow fluctuations during wakefulness: An fMRI study. J. Cereb. Blood Flow Metab. 271678X221074639 (2022).
13. Kim, J.-H., Im, J.-G. & Park, S.-H. Measurement of CSF pulsation from EPI-based human fMRI. Neuroimage 257, 119293 (2022).
14. Helakari, H. et al. Human NREM Sleep Promotes Brain-Wide Vasomotor and Respiratory Pulsations. J. Neurosci. 42, 2503–2515 (2022).
15. Anthony H. Aletras, Shujun Ding, Robert S. Balaban & Han Wen. DENSE: Displacement Encoding with Stimulated Echoes in Cardiac Functional MRI. J. Magn. Reson. 137, 247–252 (1999).
16. Pike, G. B. Quantitative functional MRI: concepts, issues and future challenges. Neuroimage 62, 1234–1240 (2012).
17. Michaela Soellinger, Andrea K. Rutz, Sebastian Kozerke & Peter Boesiger. 3D cine displacement-encoded MRI of pulsatile brain motion. Magn. Reson. Med. 61, 153–162 (2009).
18. Jacob Jan Sloots, Geert Jan Biessels & Jaco J.M. Zwanenburg. Cardiac and respiration-induced brain deformations in humans quantified with high-field MRI. Neuroimage 210, 116581 (2020).
19. Soroush Heidari Pahlavian, John N. Oshinski, Xiaodong Zhong, Francis Loth & Rouzbeh Amini. In-vivo Quantification of Cardiac-driven Brain Tissue Displacement and Strain Using Displacement-Encoding with Stimulated Echoes (DENSE) Magnetic Resonance Imaging. Journal of Biomechanical Engineering-transactions of The Asme 140, (2018).
20. Ayodeji L. Adams, Hugo J. Kuijf, Max A. Viergever, Peter R. Luijten & Jaco J.M. Zwanenburg. Quantifying cardiac-induced brain tissue expansion using DENSE. NMR Biomed. 32, e4050 (2019).
21. Xiaodong Zhong et al. Tracking brain motion during the cardiac cycle using spiral cine-DENSE MRI. Med. Phys. 36, 3413–3419 (2009).
22. Goerke, U., van de Moortele, P.-F. & Ugurbil, K. Enhanced relative BOLD signal changes in T(2)-weighted stimulated echoes. Magn. Reson. Med. 58, 754–762 (2007).
23. Goerke, U. & Möller, H. E. Transient signal changes in diffusion-weighted stimulated echoes during neuronal stimulation at 3T. J. Magn. Reson. Imaging 25, 947–956 (2007).
24. Mestre, H. et al. Flow of cerebrospinal fluid is driven by arterial pulsations and is reduced in hypertension. Nat. Commun. 9, 4878 (2018).
25. van Veluw, S. J. et al. Vasomotion as a driving force for paravascular clearance in the awake mouse brain. Neuron 105, 549-561.e5 (2020).
26. Iliff, J. J. et al. Cerebral arterial pulsation drives paravascular CSF-interstitial fluid exchange in the murine brain. J. Neurosci. 33, 18190–18199 (2013).
27. Williams, S. D. et al. Neural activity induced by sensory stimulation can drive large-scale cerebrospinal fluid flow during wakefulness in humans. PLoS Biol. 21, e3002035 (2023).
28. Zoraghi, M. et al. Simulating Local Deformations in the Human Cortex Due to Blood Flow-Induced Changes in Mechanical Tissue Properties: Impact on Functional Magnetic Resonance Imaging. Front. Neurosci. 15, 722366 (2021).
29. Berman AJL, Chausse J, Hartung G, Polimeni JR, Chen JJ. Simulating BOLD fMRI transverse relaxation at 3 T: How accurate is the infinite cylinder model of blood vessels? in Proc Intl Soc Mag Reson Med 4030 (2023).
30. Berman, A. J. L. et al. Gas-free calibrated fMRI with a correction for vessel-size sensitivity. Neuroimage 169, 176–188 (2018).
31. Uludağ, K., Müller-Bierl, B. & Uğurbil, K. An integrative model for neuronal activity-induced signal changes for gradient and spin echo functional imaging. Neuroimage 48, 150–165 (2009).
32. Khajehim, M. & Nasiraei Moghaddam, A. Investigating the spatial specificity of S2-SSFP fMRI: A Monte Carlo simulation approach. Magn. Reson. Imaging 37, 282–289 (2017).
33. Mareyam, A., Kirsch, J. E., Chang, Y., Madan, G. & Wald, L. L. A 64-Channel 7T array coil for accelerated brain MRI. in Proceedings of the International Society for Magnetic Resonance in Medicine (2020).
34. Eckstein, K. et al. Computationally Efficient Combination of Multi-channel Phase Data From Multi-echo Acquisitions (ASPIRE). Magn. Reson. Med. 79, 2996–3006 (2018).
35. Mullen, M. 2D and 3D Phase Unwrapping using SRNCP. (2023).
36. Woolrich, M. W., Ripley, B. D., Brady, M. & Smith, S. M. Temporal autocorrelation in univariate linear modeling of FMRI data. Neuroimage 14, 1370–1386 (2001).
37. Hermes, D., Wu, H., Kerr, A. B. & Wandell, B. A. Measuring brain beats: Cardiac-aligned fast functional magnetic resonance imaging signals. Hum. Brain Mapp. 44, 280–294 (2023).
38. Amelia Strom, Timothy G. Reese, Zijing Dong, Baarbod Ashenagar, Laura D. Lewis, Jonathan R. Polimeni. Effects of spatial resolution on brain tissue displacement estimates based on DENSE MRI at 7T. in Proceedings of the International Society for Magnetic Resonance in Medicine (2023).
39. Zong, X. & Lin, W. Quantitative phase contrast MRI of penetrating arteries in centrum semiovale at 7T. Neuroimage 195, 463–474 (2019).
40. Bianciardi, M., van Gelderen, P. & Duyn, J. H. Investigation of BOLD fMRI resonance frequency shifts and quantitative susceptibility changes at 7 T. Hum. Brain Mapp. 35, 2191–2205 (2014).
41. Causemann, M., Vinje, V. & Rognes, M. E. Human intracranial pulsatility during the cardiac cycle: a computational modelling framework. Fluids Barriers CNS 19, 84 (2022).
Figures
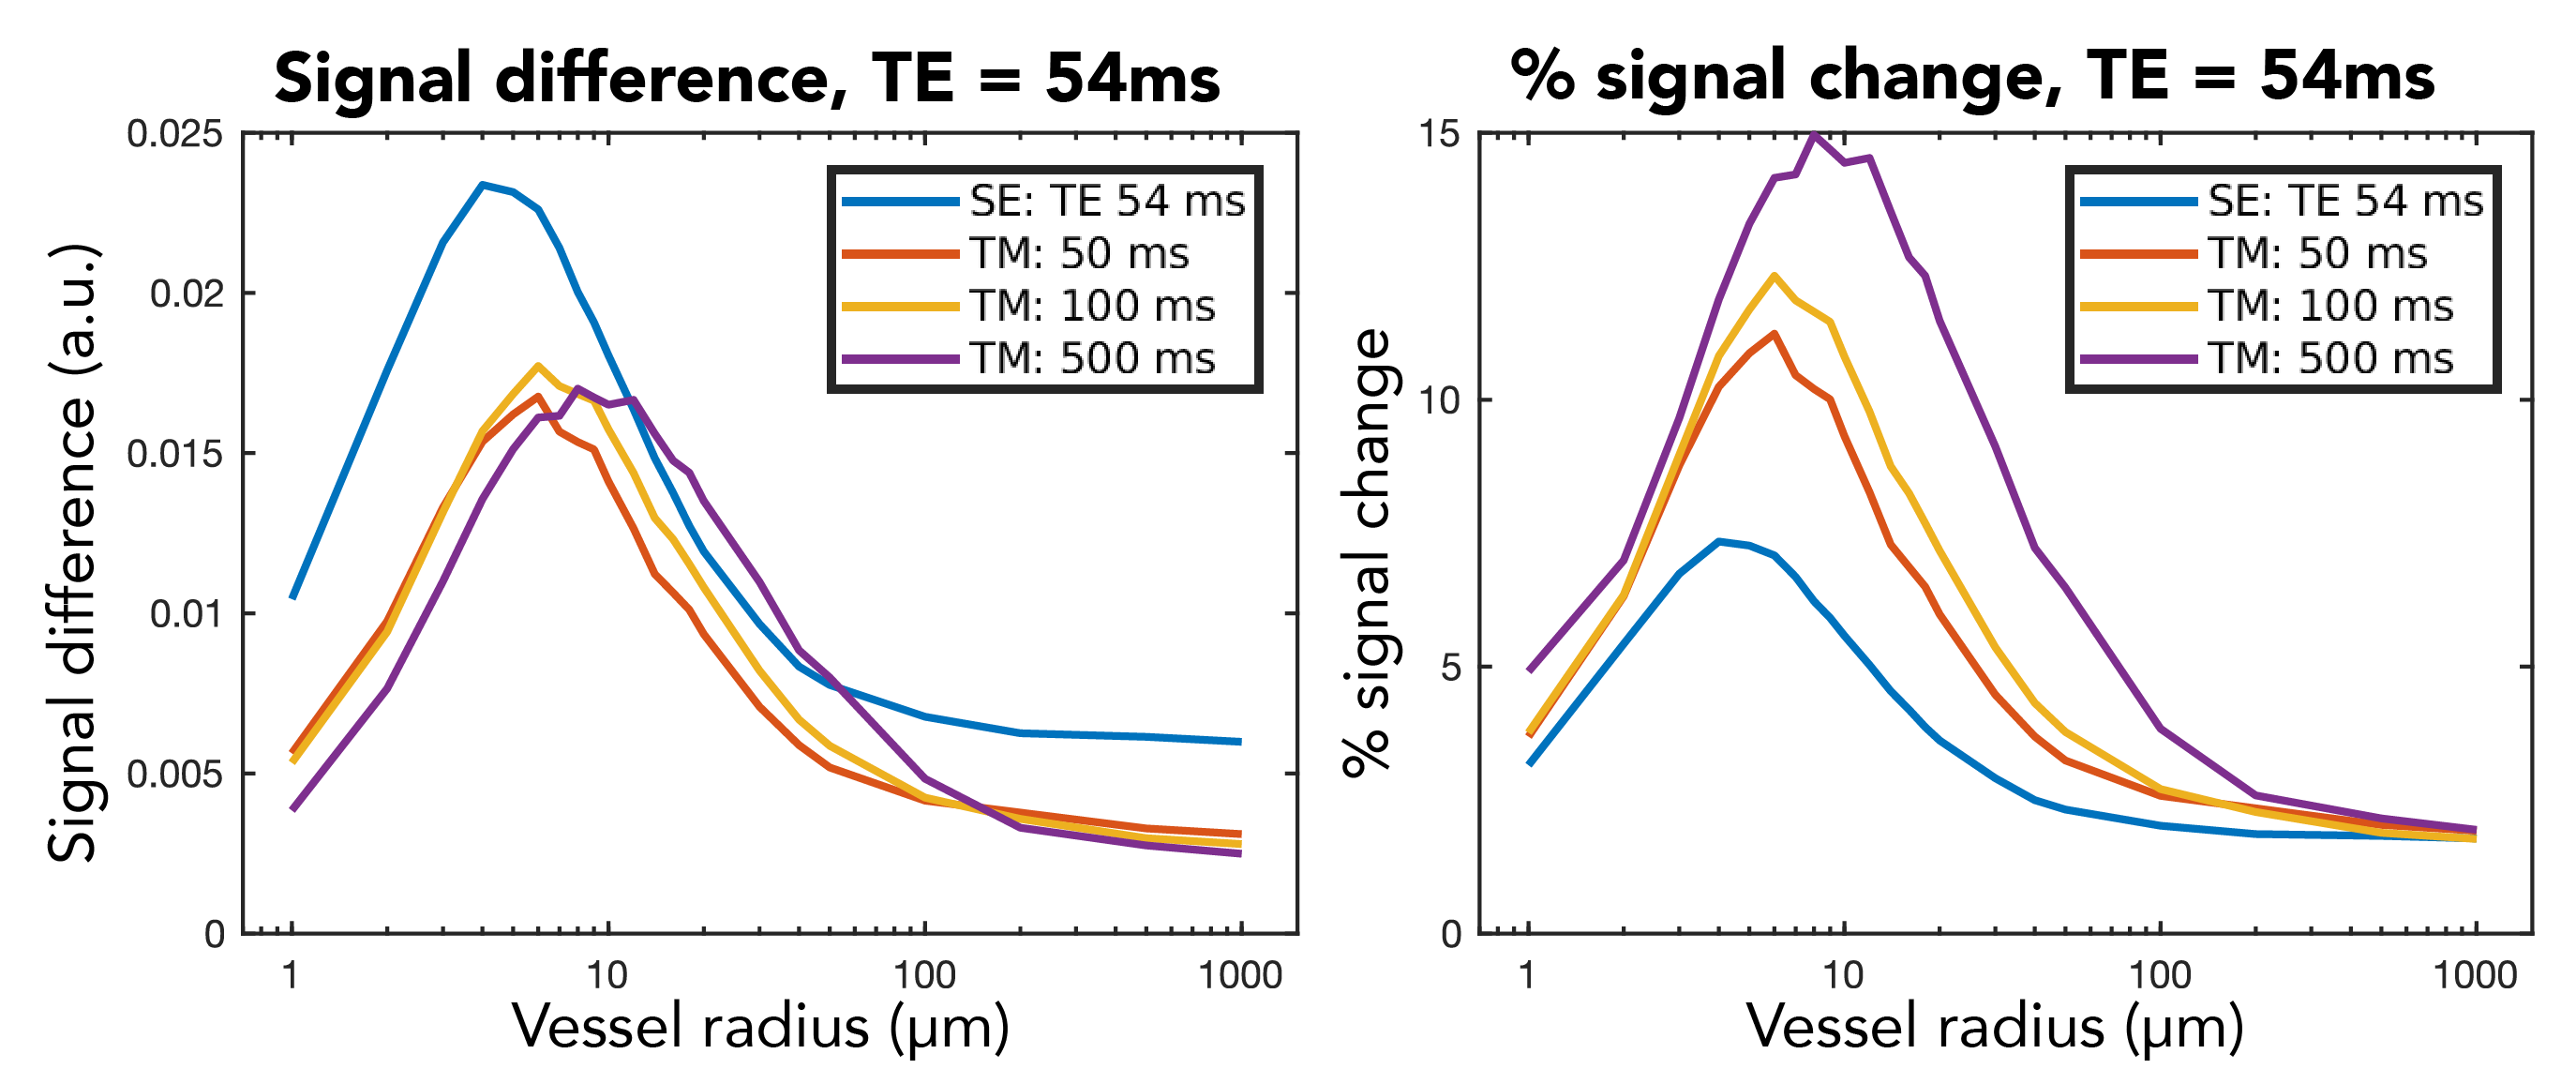
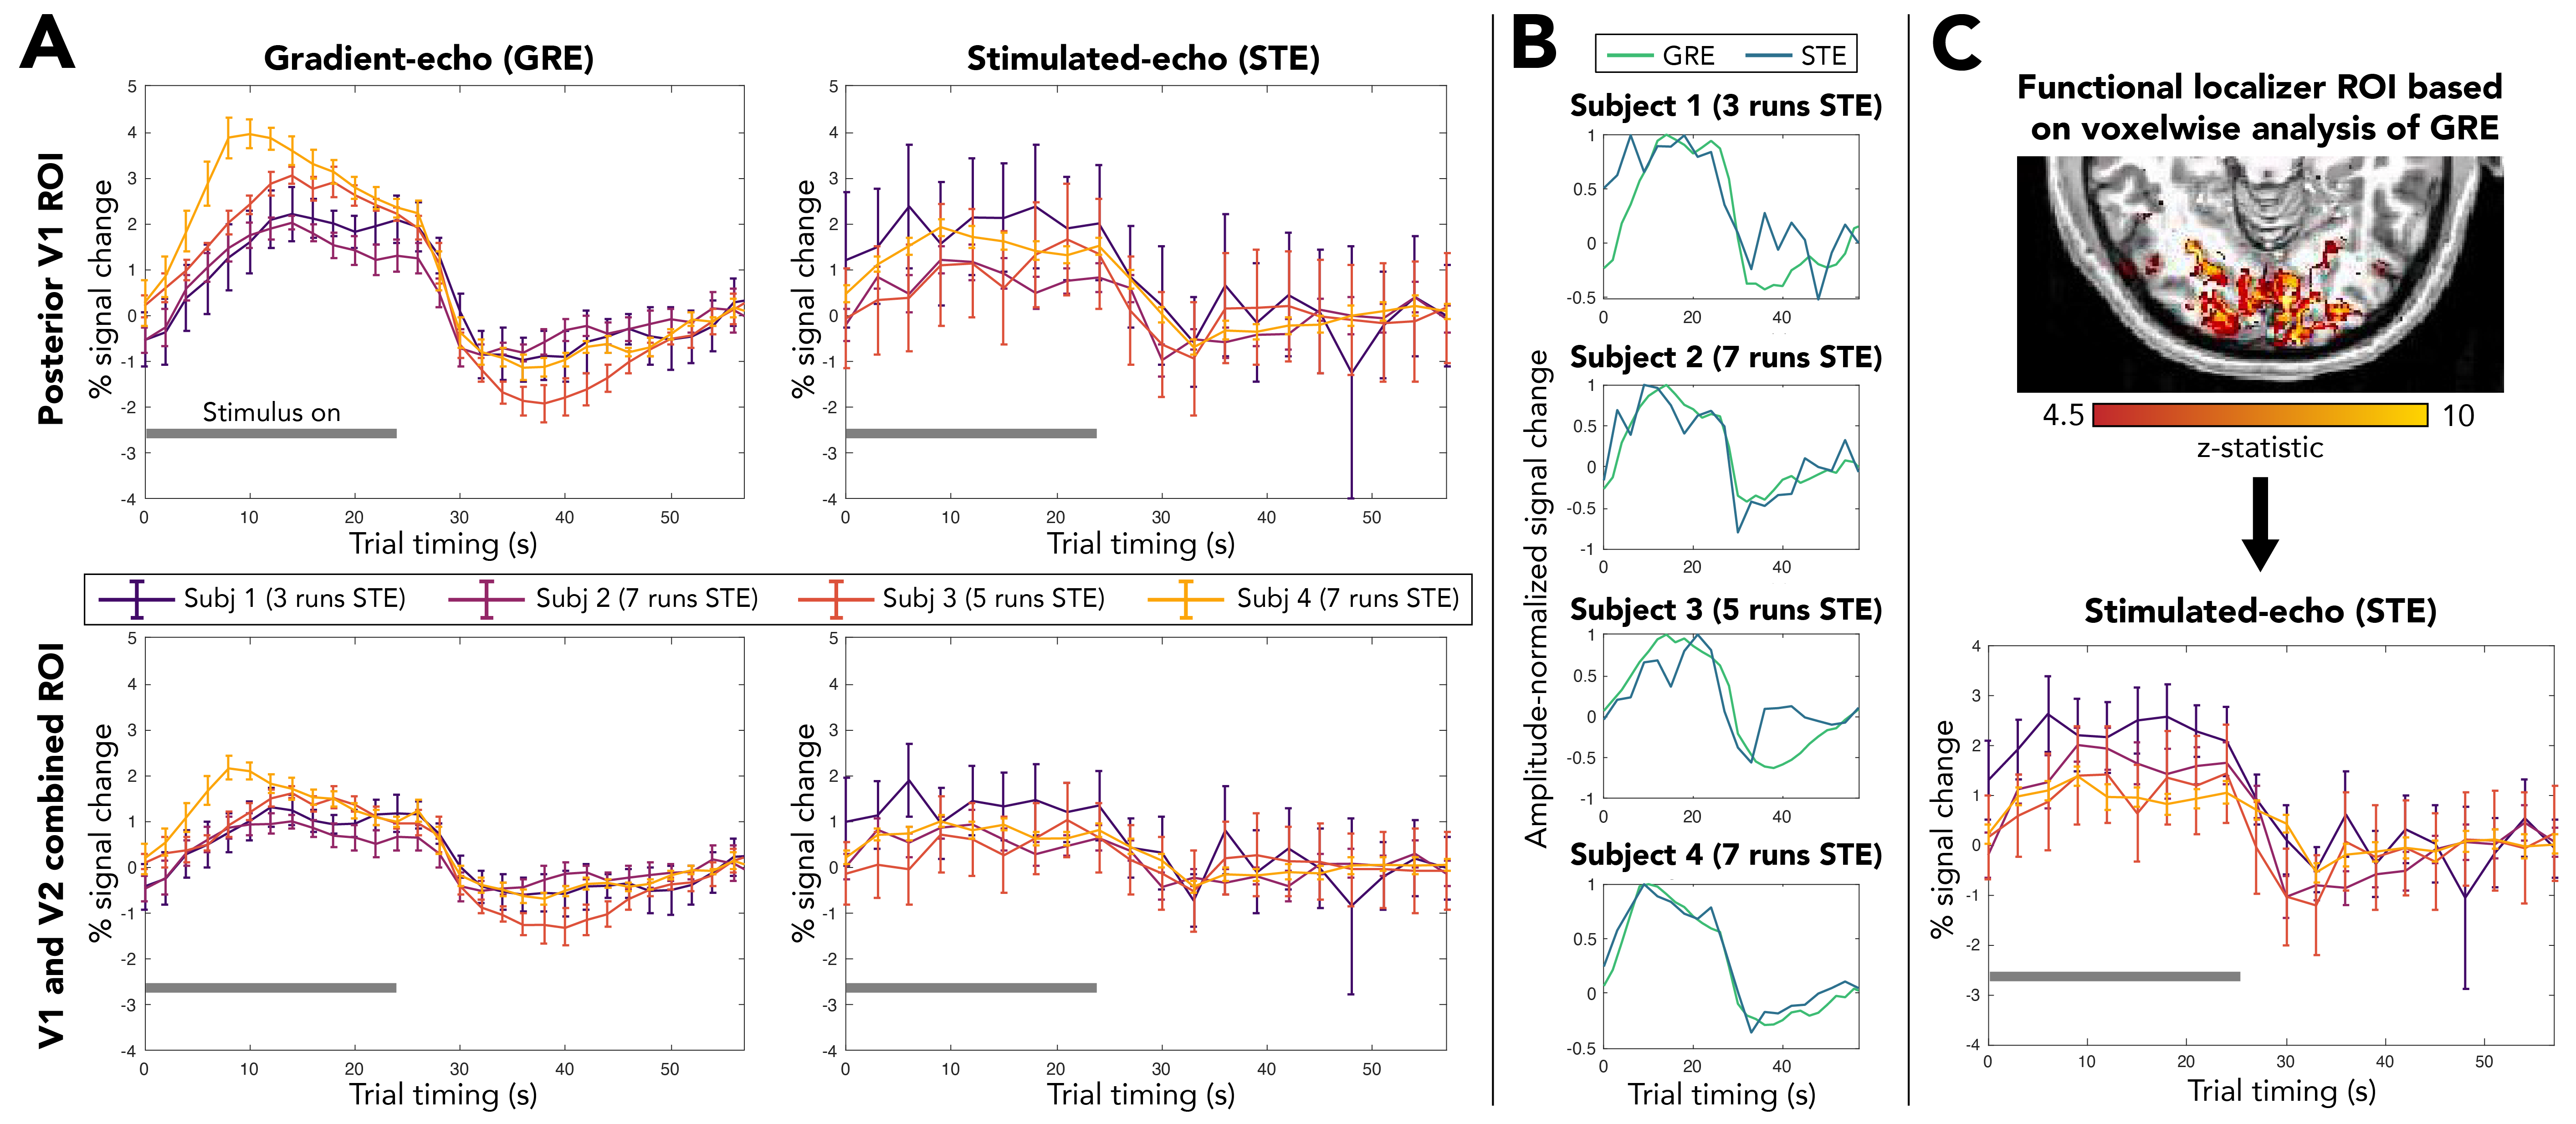
Figure 2. Stimulated-echo (STE) BOLD responses in vivo using DENSE, compared with standard gradient-echo (GRE) BOLD in individual subjects. (A) Trial-averaged responses for GRE and STE in visual cortex ROIs. All GRE traces are averaged over a single run. Note variable number of runs for STE. (B) Amplitude-normalized GRE and STE BOLD responses in posterior V1. The temporal features of the GRE and STE BOLD data are similar. (C) STE BOLD response in a localizer-defined ROI based on subject-specific GRE analysis. Error bars = standard error across trials (n=5 per run). Gray bar = stimulus on.
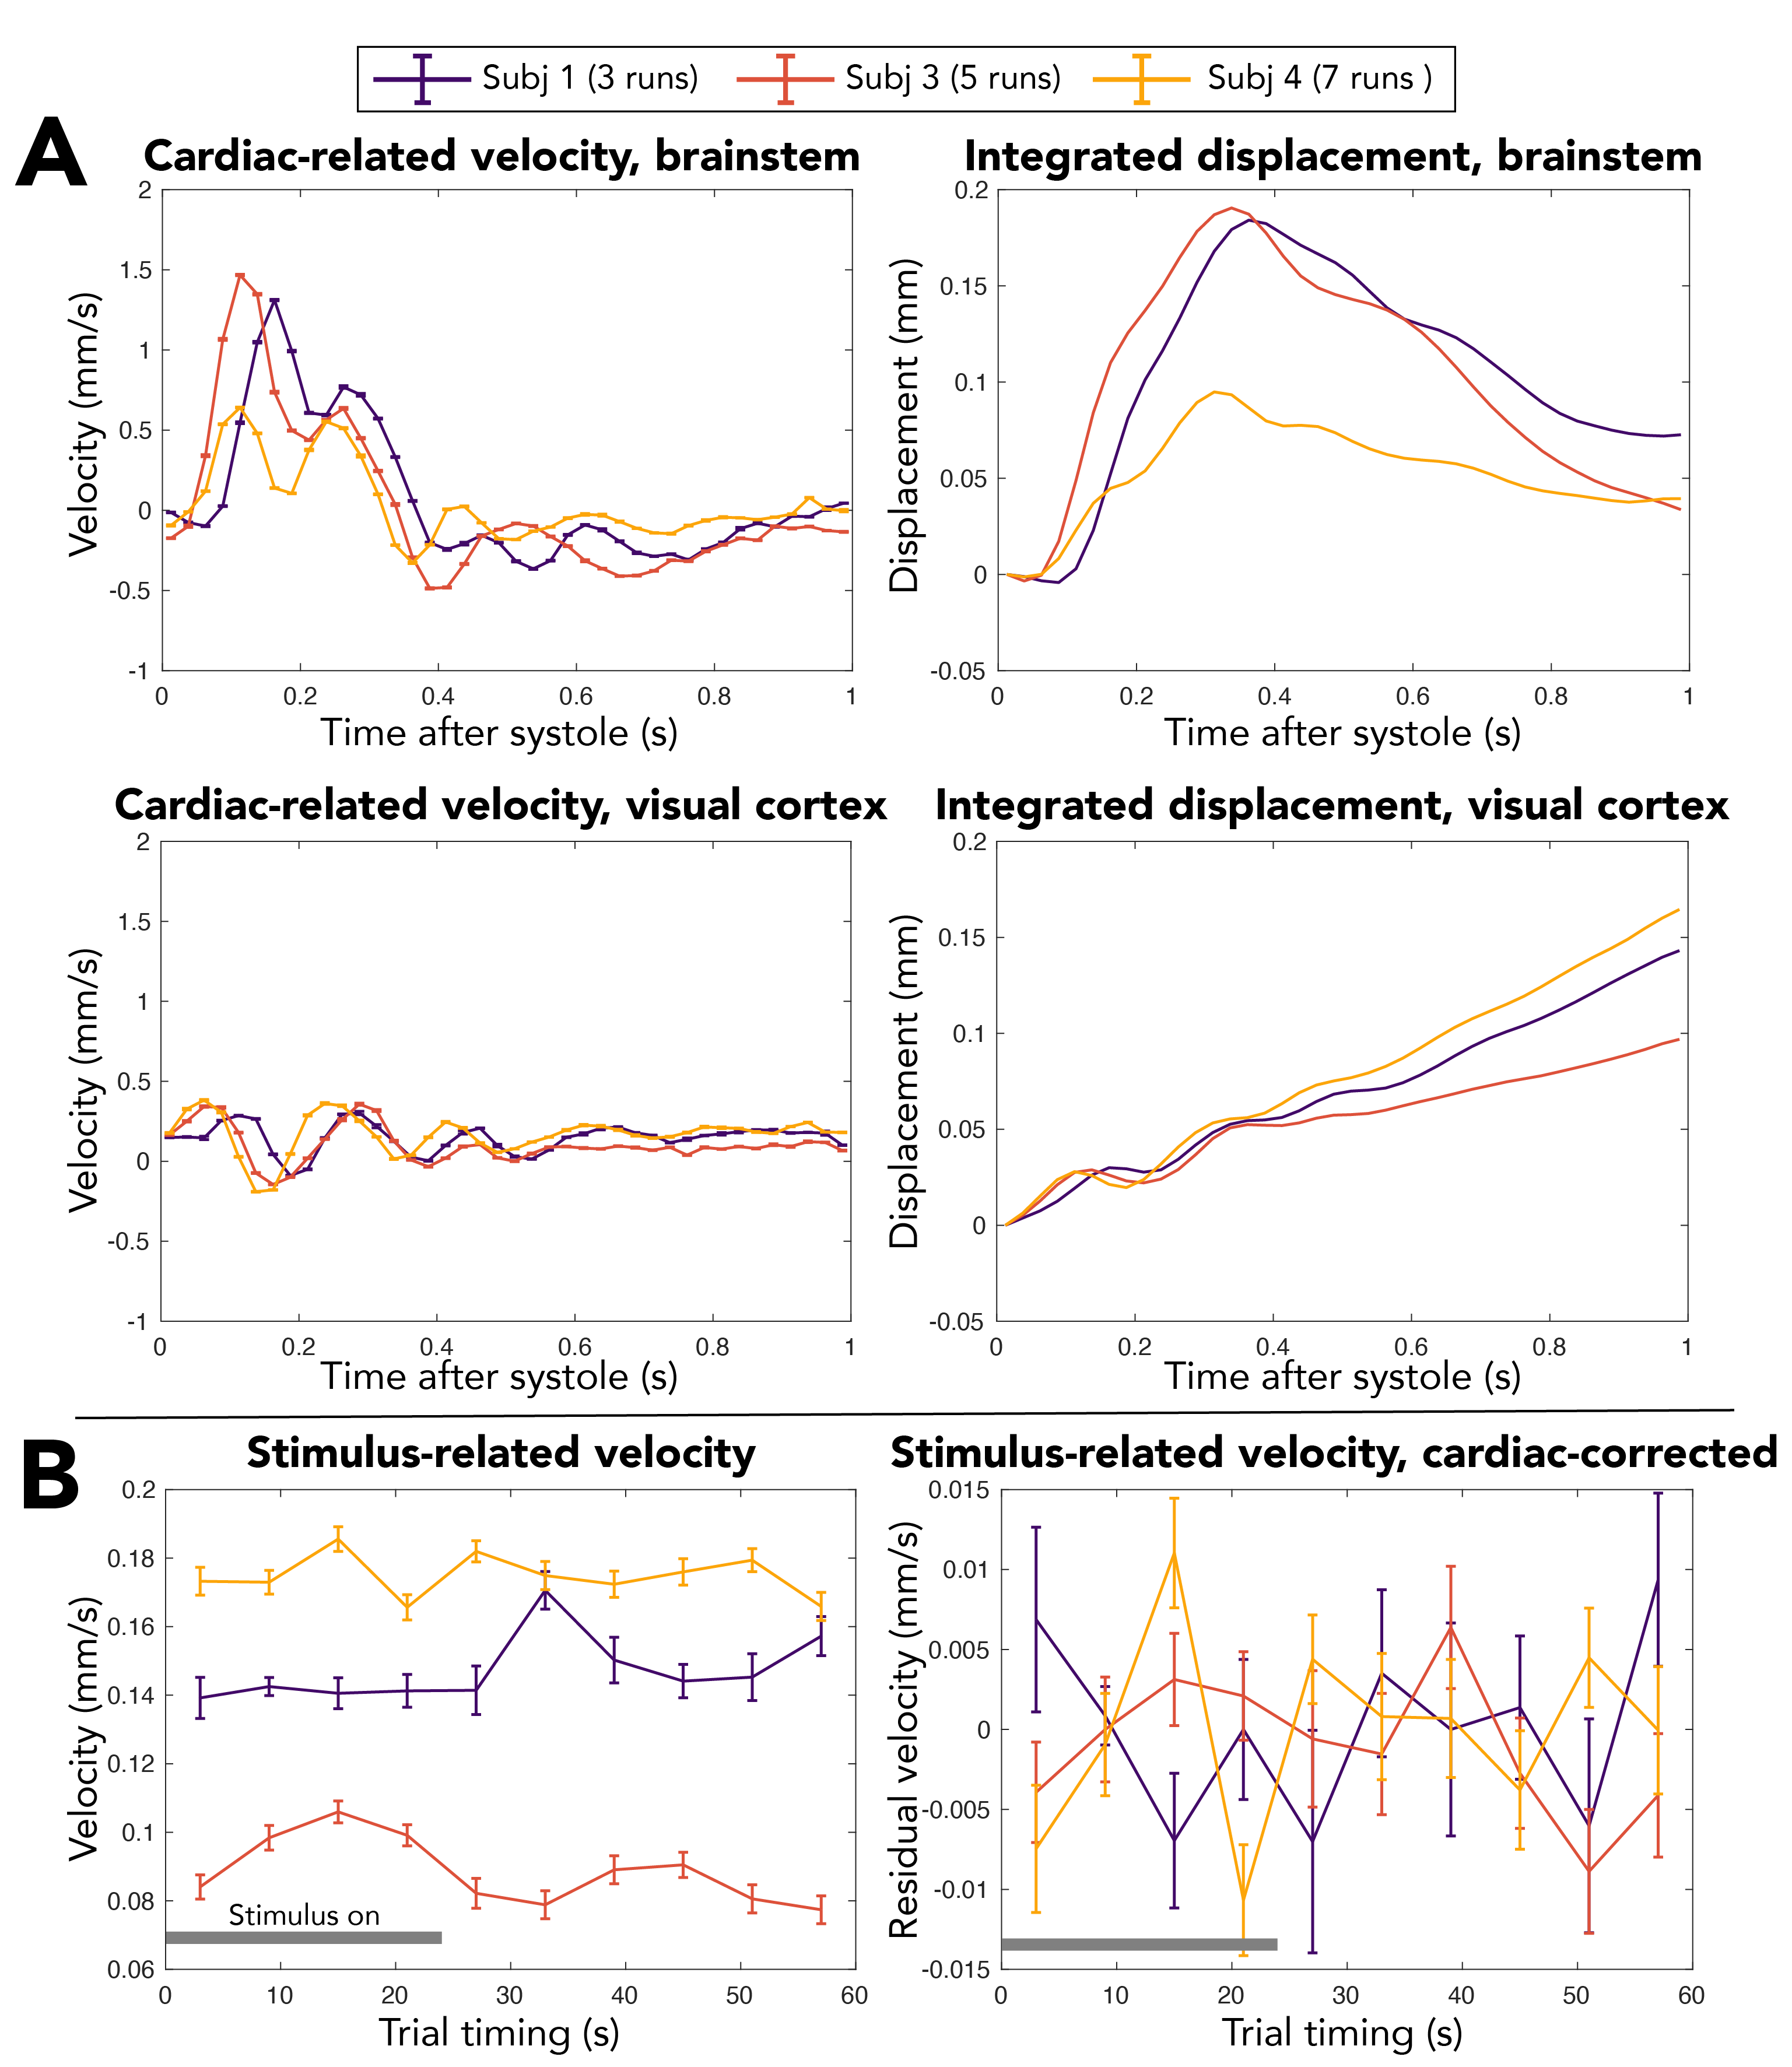
Figure 3. (A) Tissue velocity changes over the cardiac cycle in the superior brainstem and a visual cortex ROI defined based on the GRE BOLD analysis. Displacement plots are estimated by cumulative integration of the velocity traces. Peak displacements in the visual cortex after detrending were 8-18 μm. (B) Visual trial-averaged velocity changes before and after correcting for expected cardiac-related velocity. Subject 2 is excluded due to poor cardiac signal quality. Error bars = standard error across cycles. Positive velocity = Head-to-Foot direction. Gray bar = stimulus on.
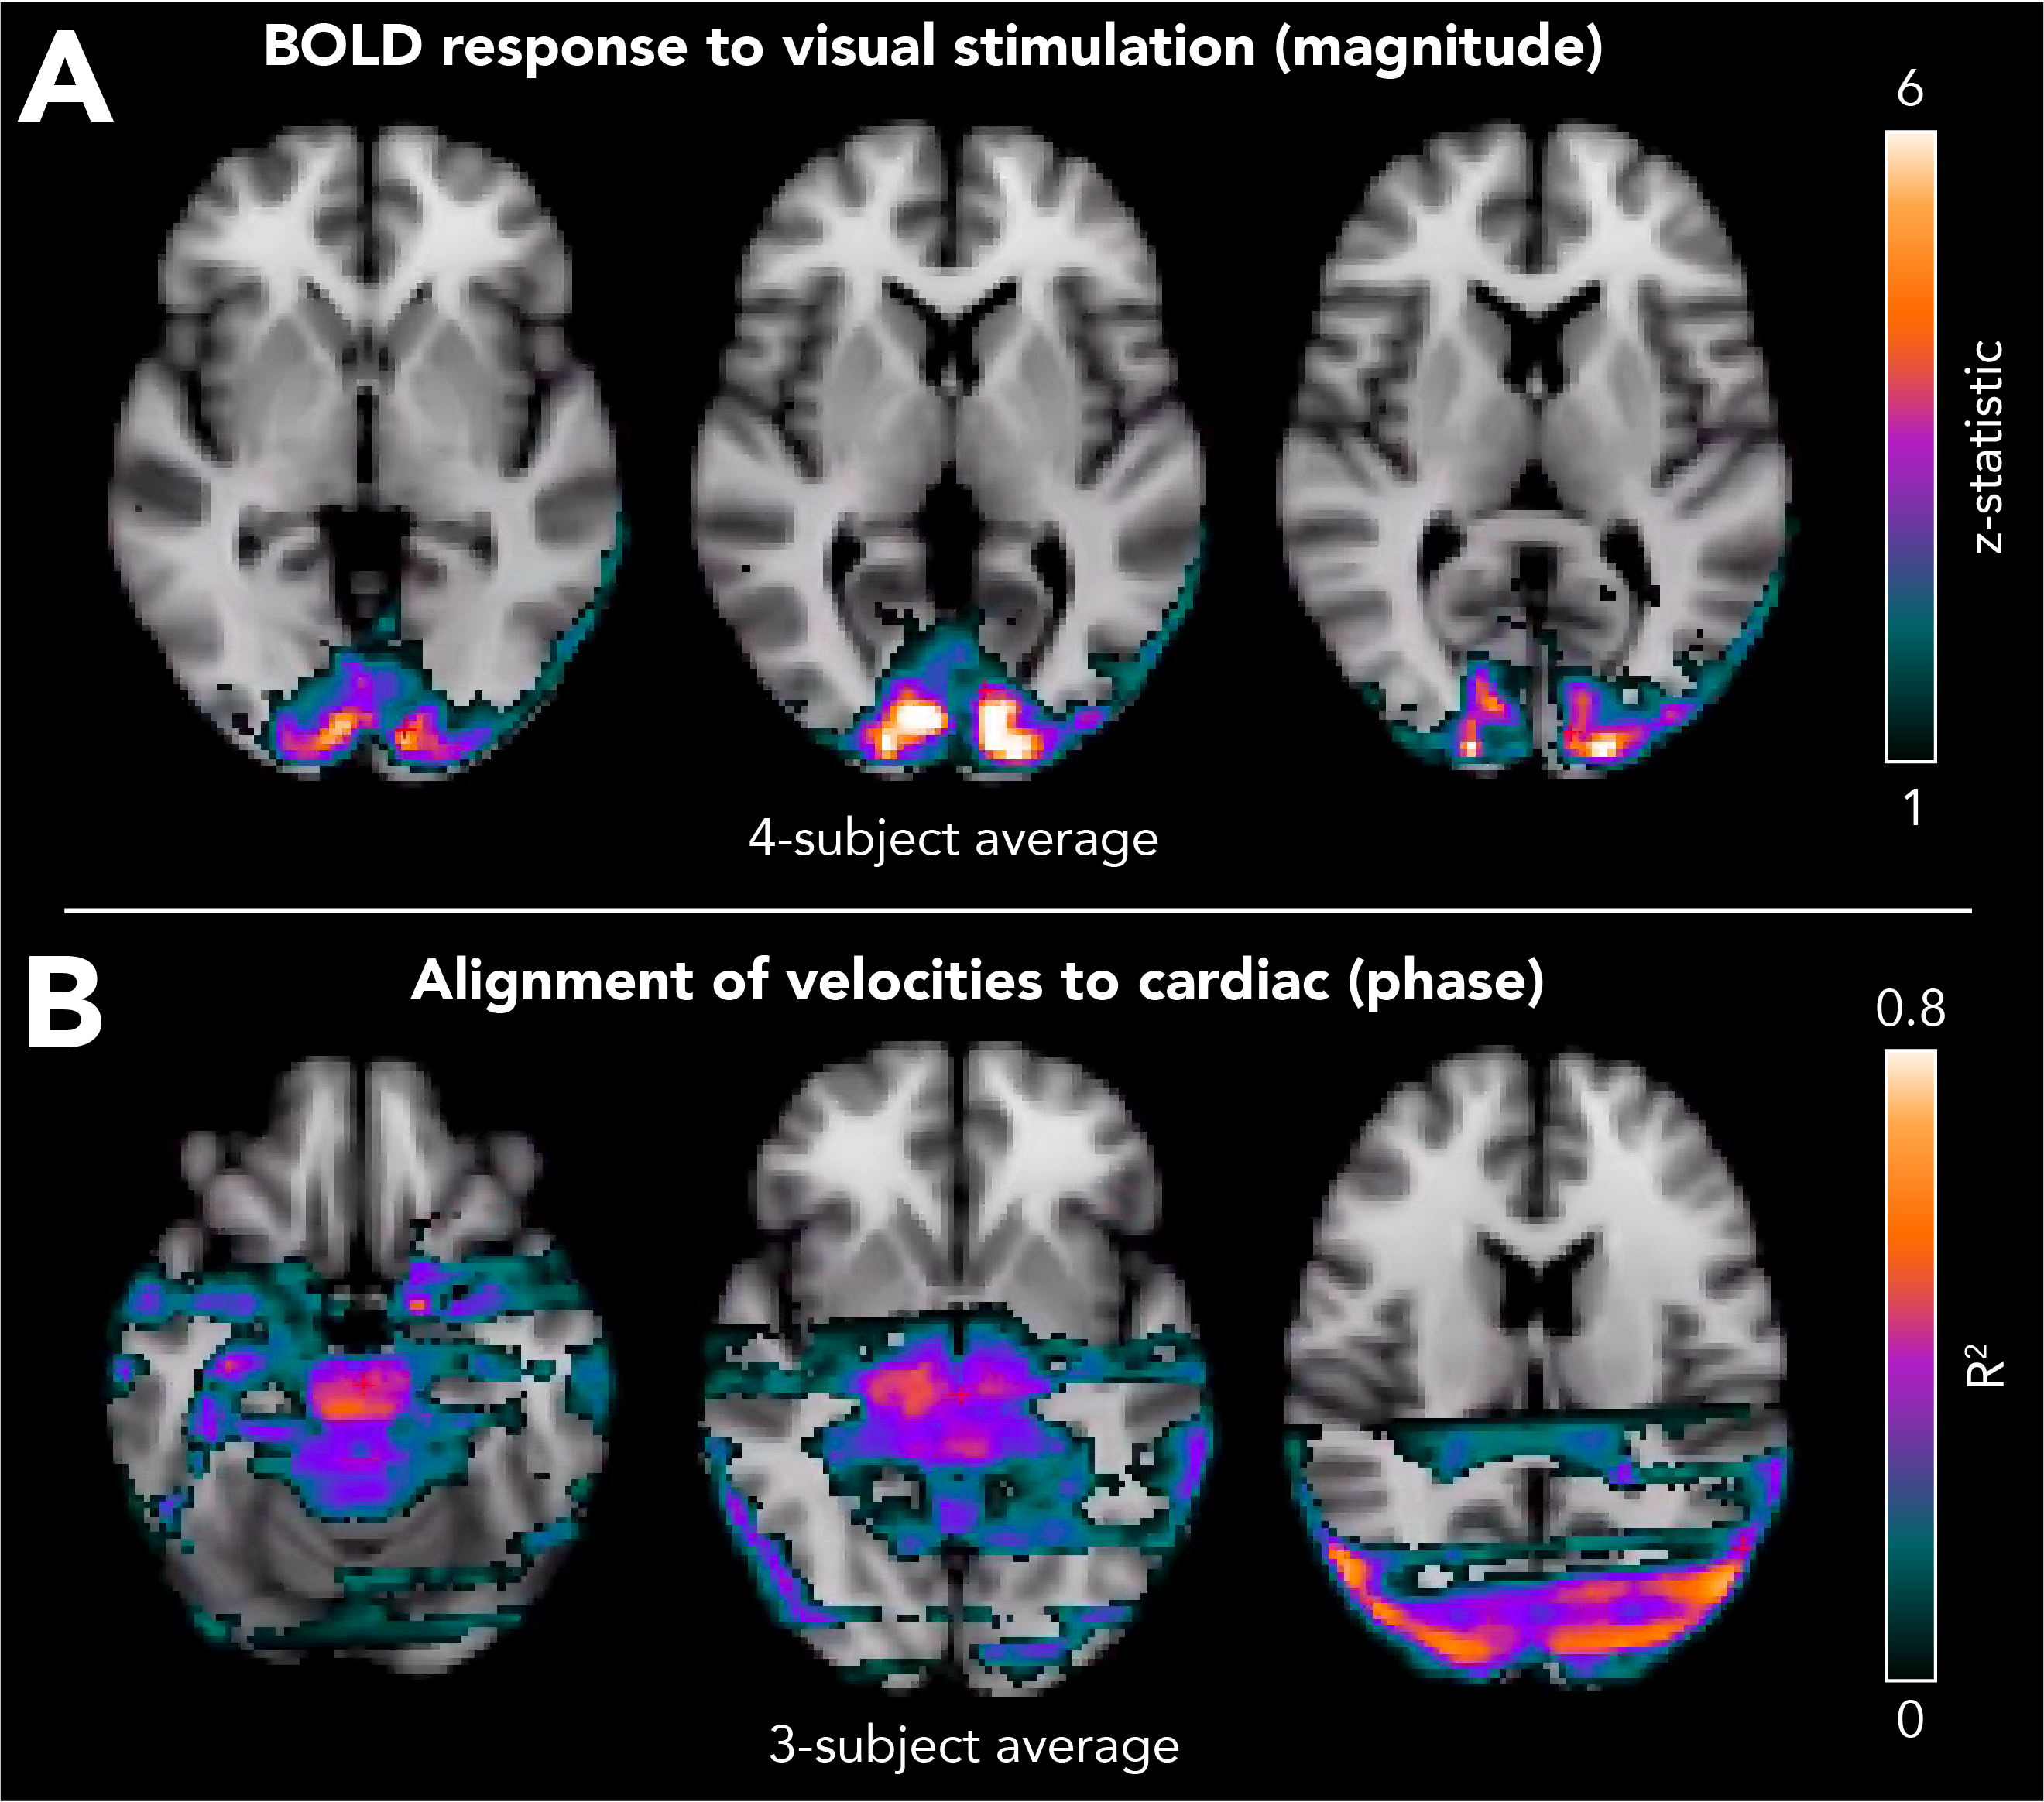
Figure 4. Spatial maps of (A) STE-BOLD response to visual stimulation estimated from the magnitude component, and (B) velocity signal coherence with the cardiac cycle estimated from the phase component of the same data. The coefficient of determination (R2), which estimates the reliability of cardiac-related time series over even vs odd heartbeats, was used to locate voxels where velocity changes were associated with the cardiac cycle. Higher R2 indicates systematic, cardiac-locked velocity changes. The striping effect is due to slice timing differences.
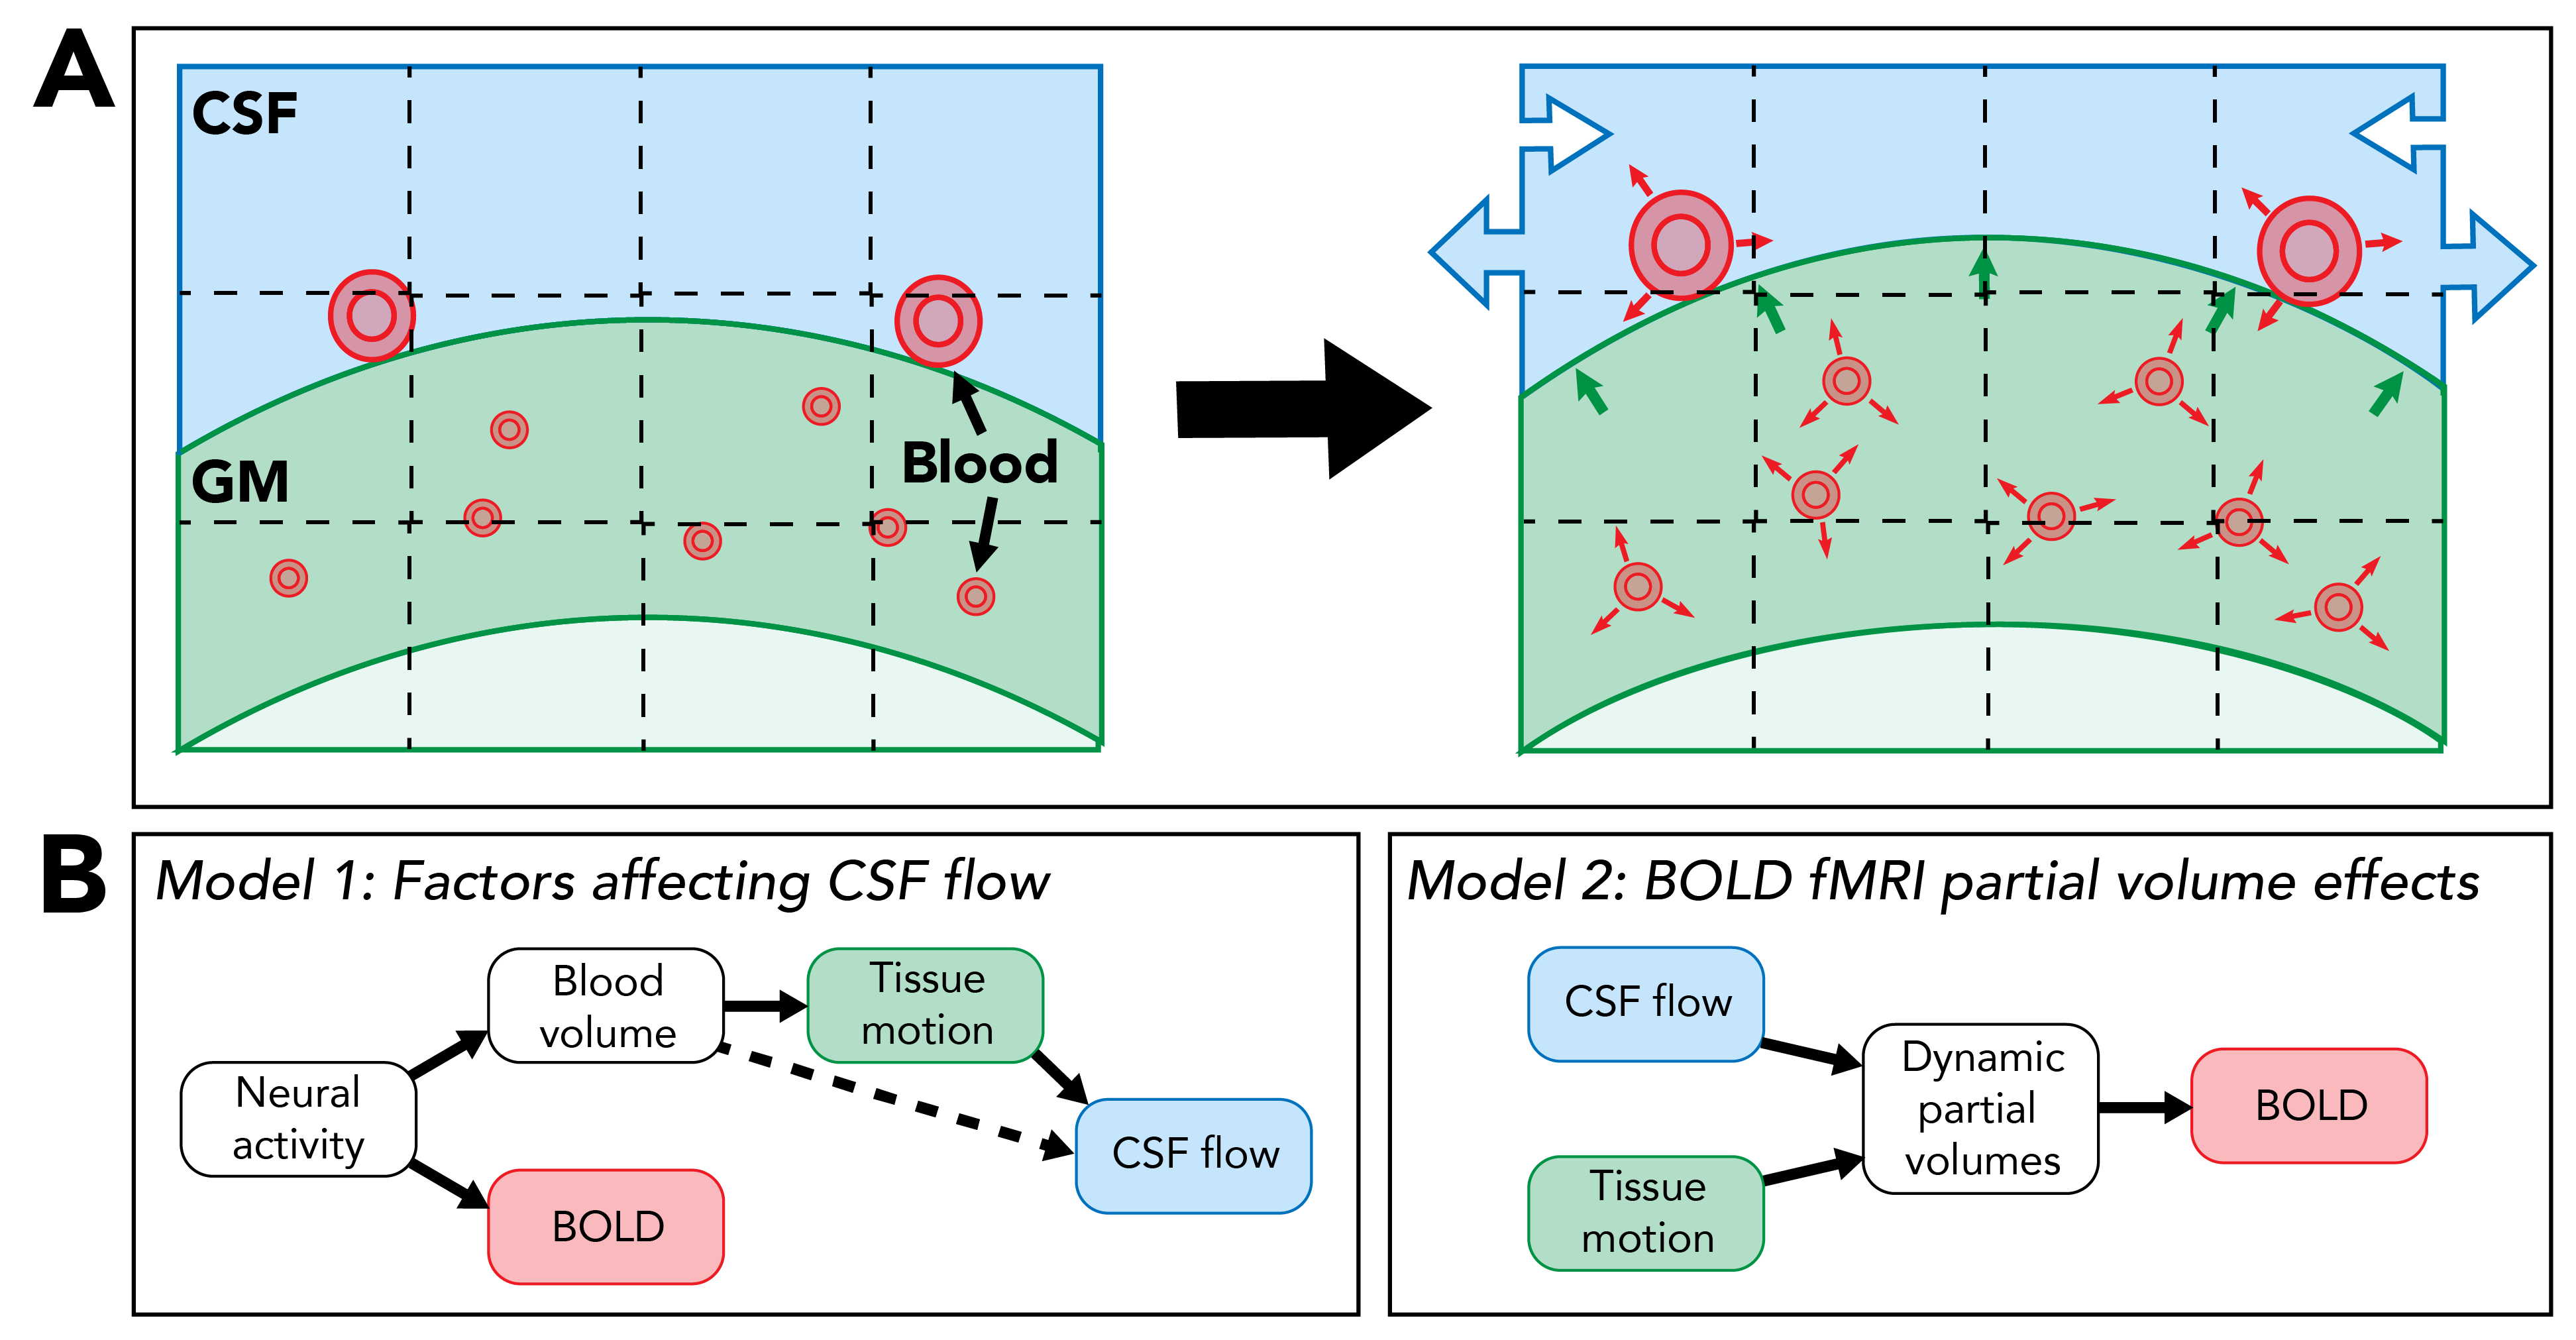
Figure 5. Potential applications of simultaneous BOLD and motion quantification. (A) Schematic of physiological changes that can be detected with the DENSE method: blood volume change, tissue motion, and CSF flow. (B) Models involving spatiotemporal changes in these compartments that we may be able to test in future studies to better understand waste clearance mechanisms (Model 1) and BOLD fMRI confounds (Model 2).