0988
Extracellular Volume Change in Human Brains during Sleep: A Simultaneous Sodium (23Na) MRI and EEG Study1Bernard and Irene Schwartz Center for Biomedical Imaging, Department of Radiology, New York University Grossman School of Medicine, New York, NY, United States, 2Center for Advanced Imaging Innovation and Research (CAI2R), Department of Radiology, New York University Grossman School of Medicine, New York, NY, United States, 3Vilcek Institute of Graduate Biomedical Sciences, New York University Grossman School of Medicine, New York, NY, United States, 4Comprehensive Epilepsy Center, Department of Neurology, New York University Grossman School of Medicine, New York, NY, United States, 5Alzheimer’s Disease Research Center, Department of Neurology, New York University Grossman School of Medicine, New York, NY, United States
Synopsis
Keywords: Neurofluids, Aging, Sodium MRI, EEG
Motivation: Alzheimer's disease is associated with neurotoxic amyloid-beta(Aβ) plaques. Studies in mice demonstrate that impaired cerebrospinal fluid(CSF) clearance reduces Aβ clearance by 70%. Sleep enhances CSF clearance by expanding extracellular space.
Goal(s): However, the impact of sleep on extracellular volume change remains unclear in human brains due to a lack of non-invasive technology.
Approach: To address this gap, we use sodium(23Na) MRI to measure the extracellular volume fraction in 16 healthy human brains. We monitor the sleep stage with MRI-compatible Electroencephalography(EEG).
Results: On average, a decrease in extracellular volume fraction was observed in the gray matter significantly, but not significant in the white matter.
Impact: Our research may shed light on how sleep may facilitate Aβ clearance in humans, bridging the gap between animal and human studies.
INTRODUCTION
One of the primary pathological biomarkers of Alzheimer's disease (AD) is the presence of amyloid-beta (Aβ) plaques, which are known to be neurotoxic. Recent studies in mice have shown that impairing the cerebrospinal fluid (CSF) clearance pathway results in a 70% reduction in Aβ clearance.1, 2 This suggests that CSF may play a crucial role in transporting and removing Aβ from the central nervous system. Additionally, these studies have revealed that sleep can enhance CSF clearance of Aβ proteins by increasing the extracellular space by 60%.3 However, it remains uncertain whether sleep has a similar effect on the extracellular space in humans.To address this gap in knowledge, our study aims to utilize sodium (23Na) MRI as a non-invasive method to quantify the extracellular volume fraction (ECVF) in the human brain. Sodium concentration in CSF, which occupies extracellular space, is approximately 10 times higher than in the intracellular space (145 vs. 15 mmol)4. 23Na MRI signal variations amplifies the change in extracellular volume change. We monitor alterations in the ECVF during sleep using MRI-compatible electroencephalogram (EEG) recording. The outcomes of this research will significantly contribute to our understanding of how sleep alters extracellular space and may enhance the clearance of Aβ, bridging the knowledge gap between animal studies and human physiology.
METHODS
A group of 16 healthy human volunteers, aged 27 - 77, 7 male and 9 female, participated in this study with IRB approval. The study spanned 1.5 hours (Fig. 1), involving four repeated 16-min 23Na MRI scans with EEG recording (Brain Vision MR-compatible 32-channel, Garner, NC). A two-min pause between MRI runs allowed for clean EEG data collection without MRI gradient interference. Participants were instructed to relax and fall asleep as possible. All participants reported doing so after the experiment. EEG recordings were conducted at a 5 kHz sampling rate and analyzed with vendor software Analyzer 2.0 (BrainVision). Sleep stages were scored according to the American Academy of Sleep Medicine (AASM) Manual (wake, N1, N2, N3, and REM). 23Na MRI used a dual-tuned (H-Na) birdcage volume coil (QED, Cleveland, OH) and a custom-developed pulse sequence, twisted projection imaging (TPI), with acquisition parameters: FOV=220mm, matrix size=64, 3D isotropic, TE/TR=0.5/100ms, flip angle=90°, frames=6, p=0.4, and TA=16min. Extracellular volume fraction (ECVF, a) quantification followed an approach from a reference (Ref. 6). The sodium signal was defined by voxel volume ΔV, intra-/extracellular volume fraction, and sodium concentration (C), i.e., s = ΔV (aeCe + aiCi) = ΔV (145 ae + 15 ai), with ae + ai = 1. The sodium signal was linearly calibrated to a known extracellular sodium concentration of 145mM in the vitreous humors (eye balls).RESULTS
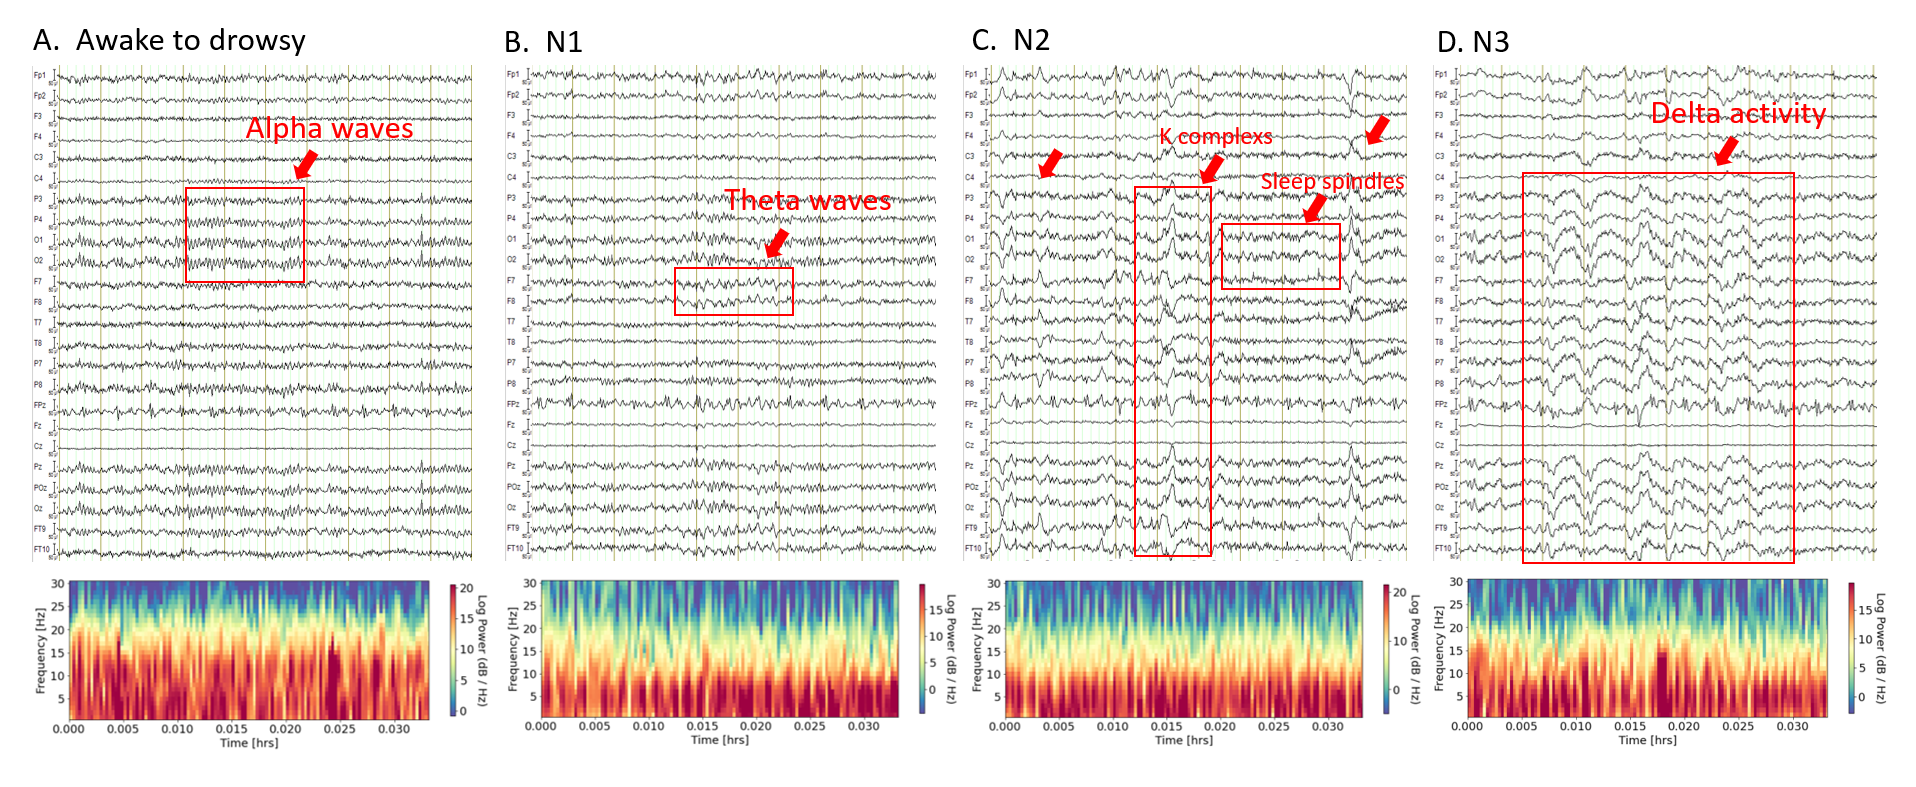
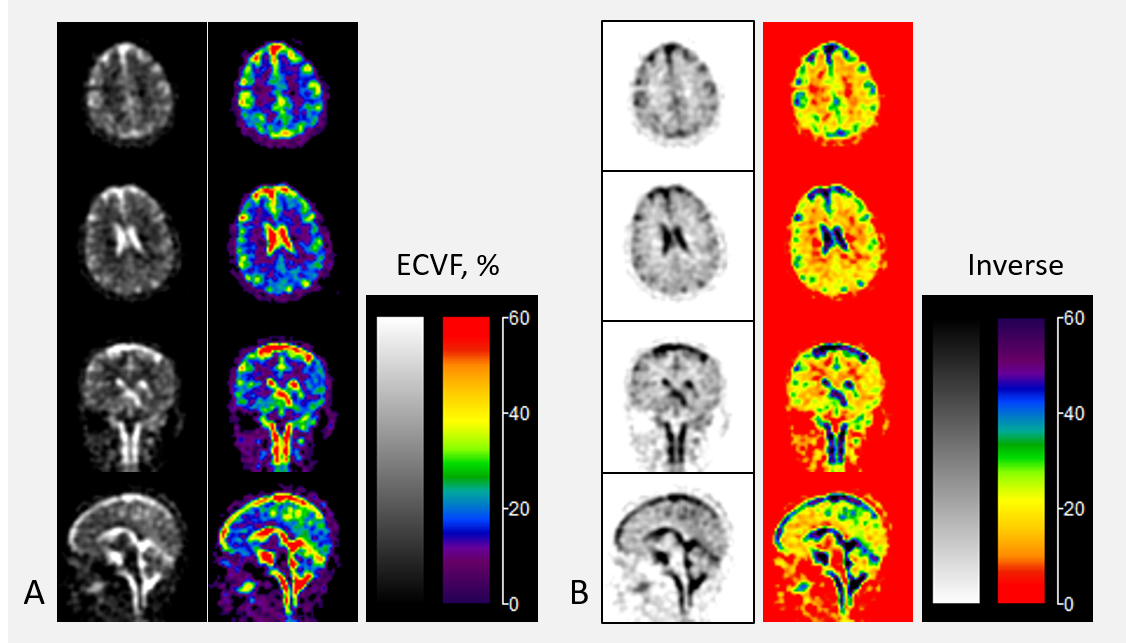
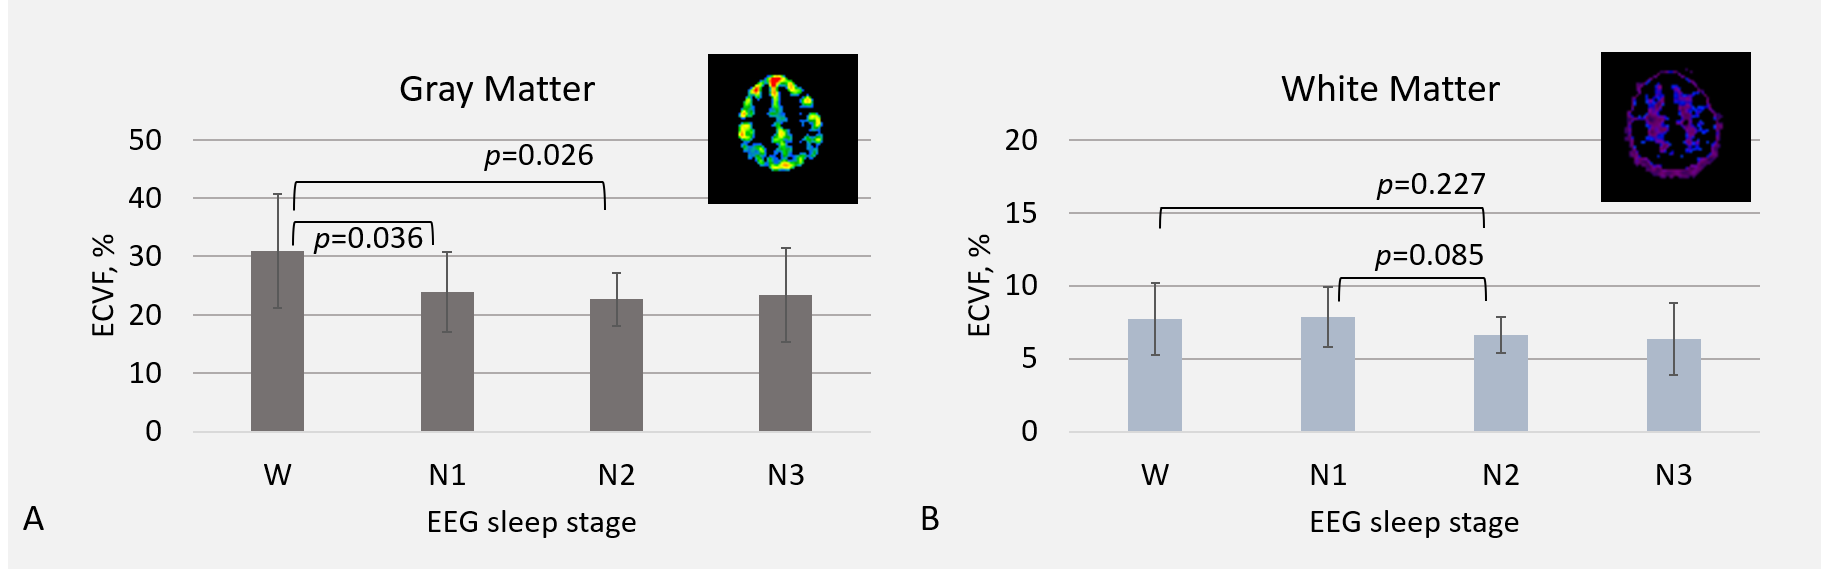
Fig. 2 shows the EEG waveforms used to score sleep stages of the study subjects and associated frequency spectra to confirm the staging. Fig. 3 represents the ECVF calculated from the sodium images at one 23Na MRI run. The inverse-contract display highlights white matter regions of low ECVF values. Fig. 4 summarizes the outcomes of the study. Surprisingly, a decrease of ECVF with sleep stage in both gray and white matter regions was observed, significantly in the gray matters (p=0.036), but nearly significantly in the white matter (p=0.085).DISCUSSION
The results indicate a change in the ECVF during sleep, but it appears to decrease as sleep deepens, contrary to the animal study findings3. The underlying cause of this discrepancy remains unclear. Additional human studies are required to validate this observation, and further investigation is necessary to analyze how sleep affects the ECVF on an individual subject basis. It is also worthwhile to explore the impact of sleep on other brain regions, such as the prefrontal and lateral temporal lobes.SUMMARY
This study surprisingly revealed a decrease in the ECVF as sleep stages deepened in both gray and white matter regions of healthy human brains. Additional studies are required to validate this observation in the future.Acknowledgements
This work was supported in part by the NIH RF1 AG067502 and was performed under the rubric of the Center for Advanced Imaging Innovation and Research (CAI2R, www.cai2r.net), an NIBIB National Center for Biomedical Imaging and Bioengineering (NIH P41 EB017183).References
- Iliff JJ, Wang M, Liao Y, et al. A paravascular pathway facilitates CSF flow through the brain parenchyma and the clearance of interstitial solutes, including amyloid β. Sci Transl Med. 2012; 4(147):147ra111
- Nedergaard M. Garbage truck of the brain. Science 2013; 340:1529-1530. https://doi.org/10.1126/science12405 14.
- Xie L, Kang H, Xu Q, Chen MJ, Liao Y, Thiyagarajan M, O'Donnell J, Christensen DJ, Nicholson C, Iliff JJ, Takano T, Deane R, Nedergaard M. Sleep drives metabolite clearance from the adult brain. Science. 342 (6156): 373-377. doi:10.1126/science.1241224. PMC 3880190. PMID 24136970.
- Thulborn KR. Quantitative sodium MR imaging: A review of its evolving role in medicine. NeuroImage 2018;; 168:250-268.
Figures
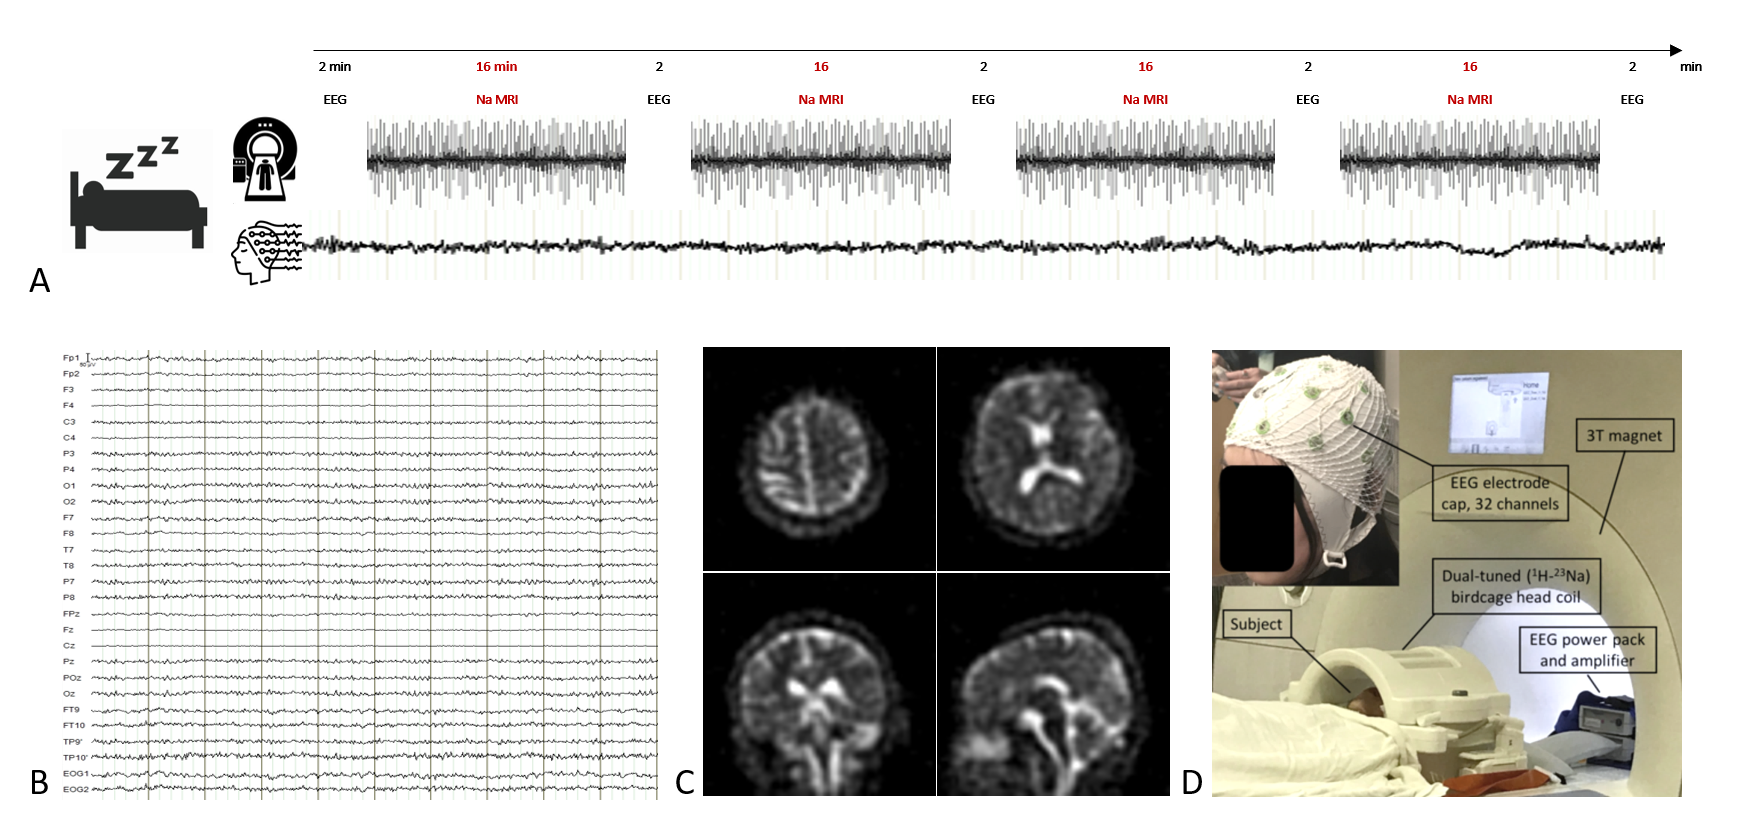
Fig. 1. Overview of the sleep study with simultaneous EEG and sodium (23Na) MRI at 3T. A) Study protocol for ~90 minutes, including four runs of 16-min-long 23Na MRI with 2-minute-long gaps in between for clean EEG recording. The entire session is monitored continuously by an MRI-compatible EEG. B) Exemplary EEG recording of a 32-channel system inside the magnet in no-MRI period. Filter and ICA correction applied. C) Exemplary sodium imaging with the slices at transverse, coronal, and sagittal orientations. D) Study set-up of the simultaneous EEG and 23Na MRI system.