0985
Artery-pulsation dependence of the paravascular cerebrospinal fluid flow measured by dynamic diffusion tensor imaging in human brain1Key Laboratory of Biomedical Engineering of Ministry of Education, College of Biomedical Engineering and Instrument Science, Zhejiang University, Hangzhou, China, 2Interdisciplinary Institute of Neuroscience and Technology, Zhejiang University School of Medicine, Hangzhou, China, 3MR Research Collaboration Team, Siemens Healthineers Ltd., Shanghai, China
Synopsis
Keywords: Neurofluids, Neurofluids, Glymphatic system
Motivation: There is still lack non-invasive methods to quantitative measure the paravascular cerebrospinal fluid (pCSF) flow speed and directions pulsations of arterial vessel .
Goal(s): To explore whether dynamic DTIlow-b could capture the artery-pulsation dependence of pCSF flow in human and how DTIlow-b metrics are modulated by artery pulsation.
Approach: Six-direction dynamic DTIlow-b was acquired simultaneously with finger pulse oximeter recording on eight subjects.
Results: Both the axial and radial diffusivity of pCSF and whole-brain white matter is increased by artery dilation. DTIlow-b signal of pCSF at b = 0 mm2/s also shows artery-pulsation dependence but lags from diffusivity changes.
Impact: The proposed dynamic DTIlow-b with ultra-long TE could potentially capture the volume and flow dynamics of MRI-visible and -invisible pCSF in artery pulsation.
Introduction
Paravascular cerebrospinal fluid (pCSF) flow could help remove metabolic waste from the brain and is believed to be driven by the arterial pulsation1,2. In rodent studies, researchers have identified a mechanism where the pulsations of arterial vessel walls accelerate the influx flow of pCSF by using particle tracking techniques3. However, it remains unknown whether a similar mechanism exists in the human, as there still lacks non-invasive ways to quantitative measure the pCSF flow speed and direction. In 2018, Harrison et al. first proposed DTI with a low b-value and ultra-long TE for measuring the pCSF movement in rodents and showed the reconstructed diffusion tensor ellipsoid is anisotropy and along the orientation of neighboring artery4. Furthermore, Bito et al. demonstrated that such diffusion anisotropy is a result of laminar flow in PVS5. Recently, several studies applied this method on human together with simultaneous physiological recording to measure the dynamic CSF pattern in the PVS6-8; however, these studies all used three diffusion directions (i.e., ADC) and lacked the flow direction information. In this study, we aimed to explore the dynamics of the pCSF diffusion tensor in the cardiac pulsation by simultaneously acquiring the dynamic DTI with low b-value and long TE and physiological signal.Methods
Simultaneous recording of dynamic DTIlow-b and cardiac pulsationDynamic DTIlow-b was performed using a single-shot echo-planar imaging sequence with pulsed gradient spin echo: TR/TE = 3843 ms/130.0 ms, pixel bandwidth = 1700 Hz per pixel, 84 slices with a 1.5×1.5×1.5 mm3 voxel size, The b-value was 130 s/mm2 with six-direction9 diffusion-encoding directions as follows: (Gx, Gy, Gz) = ([1, 0, 1], [-1, 0, 1], [0, 1, 1], [0, 1, -1], [1, 1, 0], [-1, 1, 0]). Each diffusion direction was repeated 30 times, along with 60 repetitions of b=0 s/mm2 were collected. The total acquisition time was 15 minutes and 43 seconds. We used a retrospective gating approach to capture the different phases of the heartbeat, with the sequence being repeated continuously in time. The heartbeat was recorded using a pulse oximeter. A series of DTI images covering one complete cardiac cycle was generated by retrospectively aligning the acquired image volumes to the cardiac cycle (Fig. 1). Eight healthy volunteers (aged 17–28 years, 12.5% woman) were recruited and received MRI scans in 3T Siemens Prisma.
Analysis
DTIlow-b images were retrospectively aligned to the cardiac cycle using in-house programs developed in MATLAB. DTIlow-b metrics were generated with TORTOISE10.
Results and Discussion
The diffusion tensor of arterial pCSFs exhibits clear anisotropic property with larger apparent diffusivity along the direction of neighboring arteries (Fig 2, 3). Representative examples including the pCSF of middle cerebral artery (MCA, M1 and M2 segmentation), posterior cerebral artery (PCA), one small artery, and the third ventricle, whereas the white matter didn’t show such diffusion anisotropy. A close look of the pulsive waveform of the DTIlow-b data (Fig 4, 5) found that (1) the DTIlow-b signal at b=0 mm2/s of whole-brain pCSF also shows a strong cardiac-pulsation dependence, which could be the result of partial volume effect and the artery-dilation-induced reduction of CSF volume fraction in the selected MRI pixels; (2) both AD and RD of pCSF are increased in the artery diastolic phase, suggesting both the pCSF flow parallel and perpendicular to the artery wall are altered; (3) it should be noted that there is a time lag of around 200-300 ms from the artery pulsation in the brain to that in the fingers7, which could explain the time lag between DTIlow-b metrics and finger artery pulsation; (4) the changes of AD and RD is earlier than S(b =0 mm2/s), suggesting changes of apparent diffusivity (i.e., flow) and S (b =0 mm2/s) is driven by the velocity and displacement of artery wall, respectively; and previous study on rodents has demonstrated the displace change is behind the velocity change of artery wall3; (5) more excitingly, the white matter also shows similar AD and RD changes as pCSF, suggesting current dynamic DTIlow-b method could also capture dynamics of the MRI-invisible pCSF in white matter; (6) DTIlow-b metrics of the third ventricle also show similar pulsative waveform as those of pCSF but has a time lag. (7) The different phase of cardiac cycles does not change the main orientation of the tensor.Conclusion
Both AD and RD of pCSF show cardiac-pulsation dependence and change earlier than S(b=0) signal, suggesting the proposed dynamic DTIlow-b technique could potentially capture various pCSF dynamics in artery pulsation. Furthermore, the proposed dynamic DTIlow-b could also potentially capture the dynamic changes of these MRI-invisible pCSF in white matter.Acknowledgements
This work is supported in part by the National Natural Science Foundation of China (NSFC) (Grant Nos. 82111530201, 82222032, 82172050), the STI2030-Major Projects Q22 of China (Grant No. 2022ZD0206000).
References
1 Iliff J J, Wang M, Zeppenfeld D M, et al. Cerebral arterial pulsation drives paravascular CSF-Interstitial fluid exchange in the murine brain. J. Neurosci., 2013, 33(46): 18190–18199.
2 Iliff J J, Wang M, Liao Y, et al. A Paravascular Pathway Facilitates CSF Flow Through the Brain Parenchyma and the Clearance of Interstitial Solutes, Including Amyloid b[R]. .
3 Mestre H, Tithof J, Du T, et al. Flow of cerebrospinal fluid is driven by arterial pulsations and is reduced in hypertension. Nat. Commun., 2018, 9(1): 4878.
4 Harrison I F, Siow B, Akilo A B, et al. Non-invasive imaging of CSF-mediated brain clearance pathways via assessment of perivascular fluid movement with diffusion tensor MRI. Elife, 2018, 7: e34028.
5 Bito Y, Harada K, Ochi H, et al. Low b-value diffusion tensor imaging for measuring pseudorandom flow of cerebrospinal fluid. Magn. Reson. Med., 2021, 86(3): 1369–1382.
6 Wen Q, Tong Y, Zhou X, et al. Assessing pulsatile waveforms of paravascular cerebrospinal fluid dynamics using dynamic diffusion‐weighted imaging (dDWI). Neuroimage, Elsevier Inc., 2022, 260(July): 119464.
7 Wen Q, Wright A, Tong Y, et al. Paravascular fluid dynamics reveal arterial stiffness assessed using dynamic diffusion-weighted imaging. NMR Biomed., 2023(April): 1–14.
8 Ran L, He Y, Zhu J, et al. Characterizing cerebrospinal fluid mobility using heavily T2-weighted 3D fast spin echo (FSE) imaging with improved multi-directional diffusion-sensitized driven-equilibrium (iMDDSDE) preparation. J. Cereb. Blood Flow Metab., 2023.
9 Lebel C, Benner T, Beaulieu C. Six is enough? Comparison of diffusion parameters measured using six or more diffusion-encoding gradient directions with deterministic tractography. Magn. Reson. Med., 2012, 68(2): 474–483.
10 Pierpaoli C, Walker L, Irfanoglu M O, et al. TORTOISE: an integrated software package for processing of diffusion MRI data. ISMRM 18th Annu. Meet. Stock., 2010.
Figures
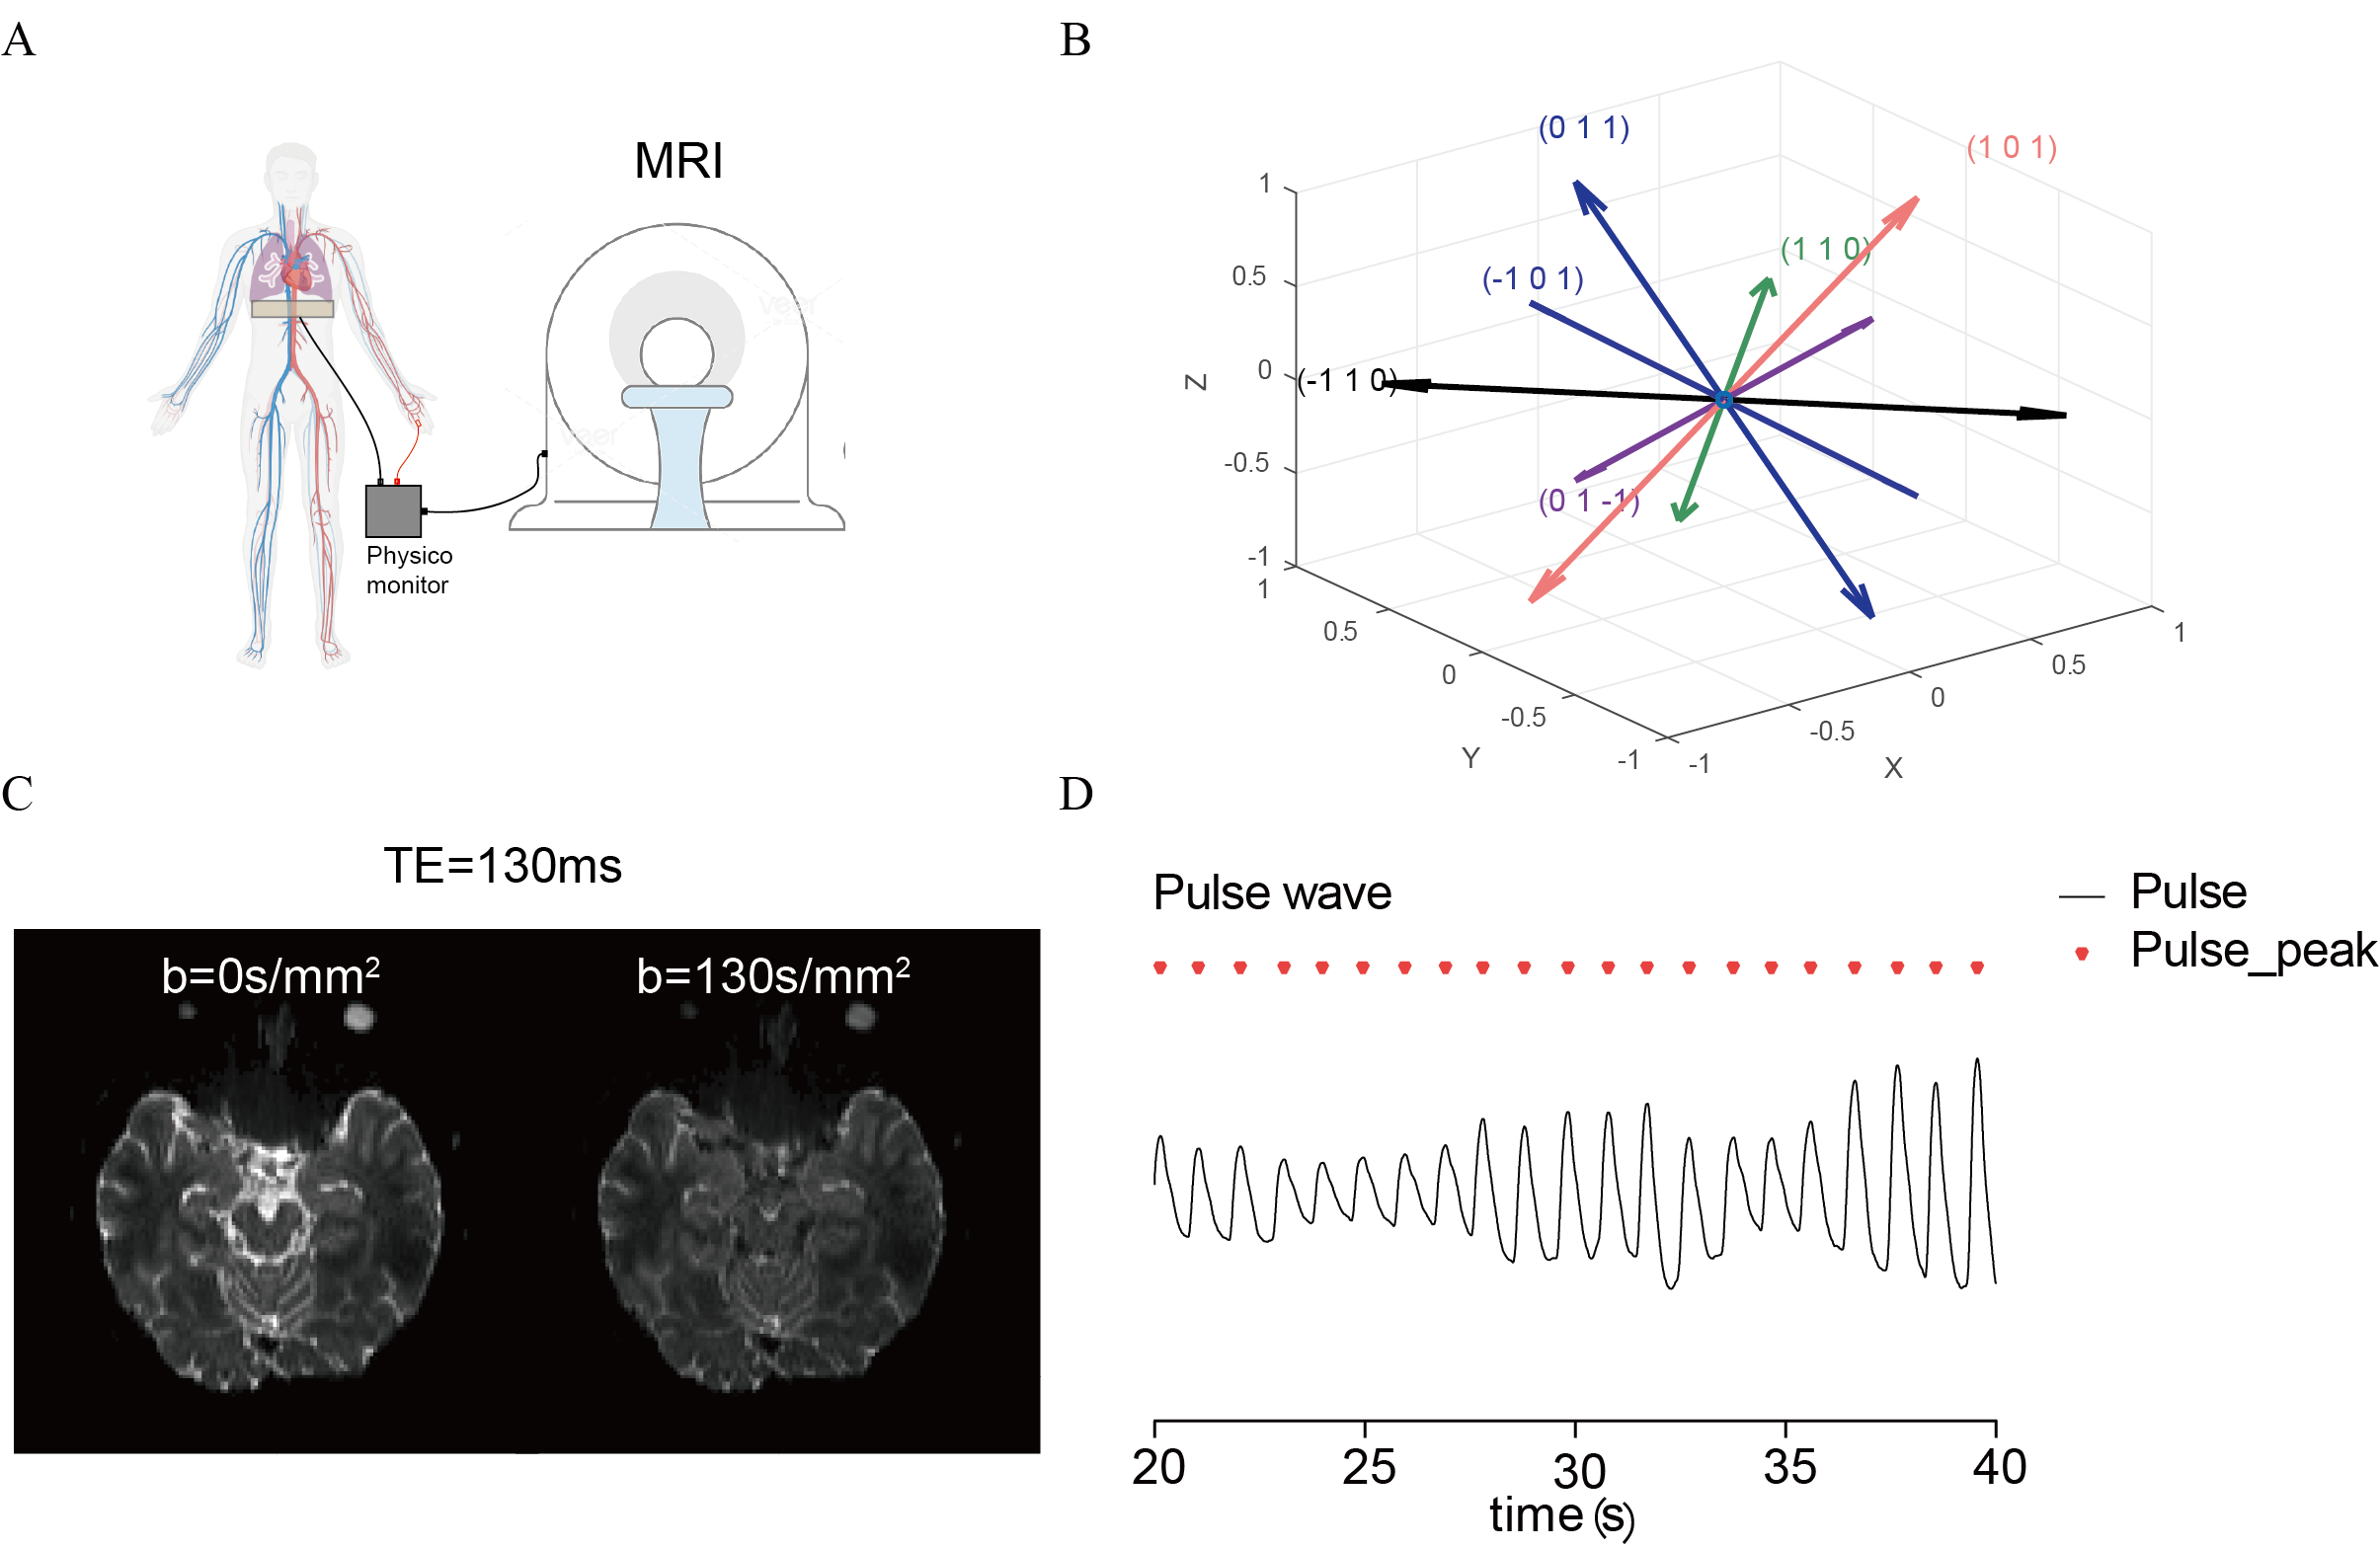
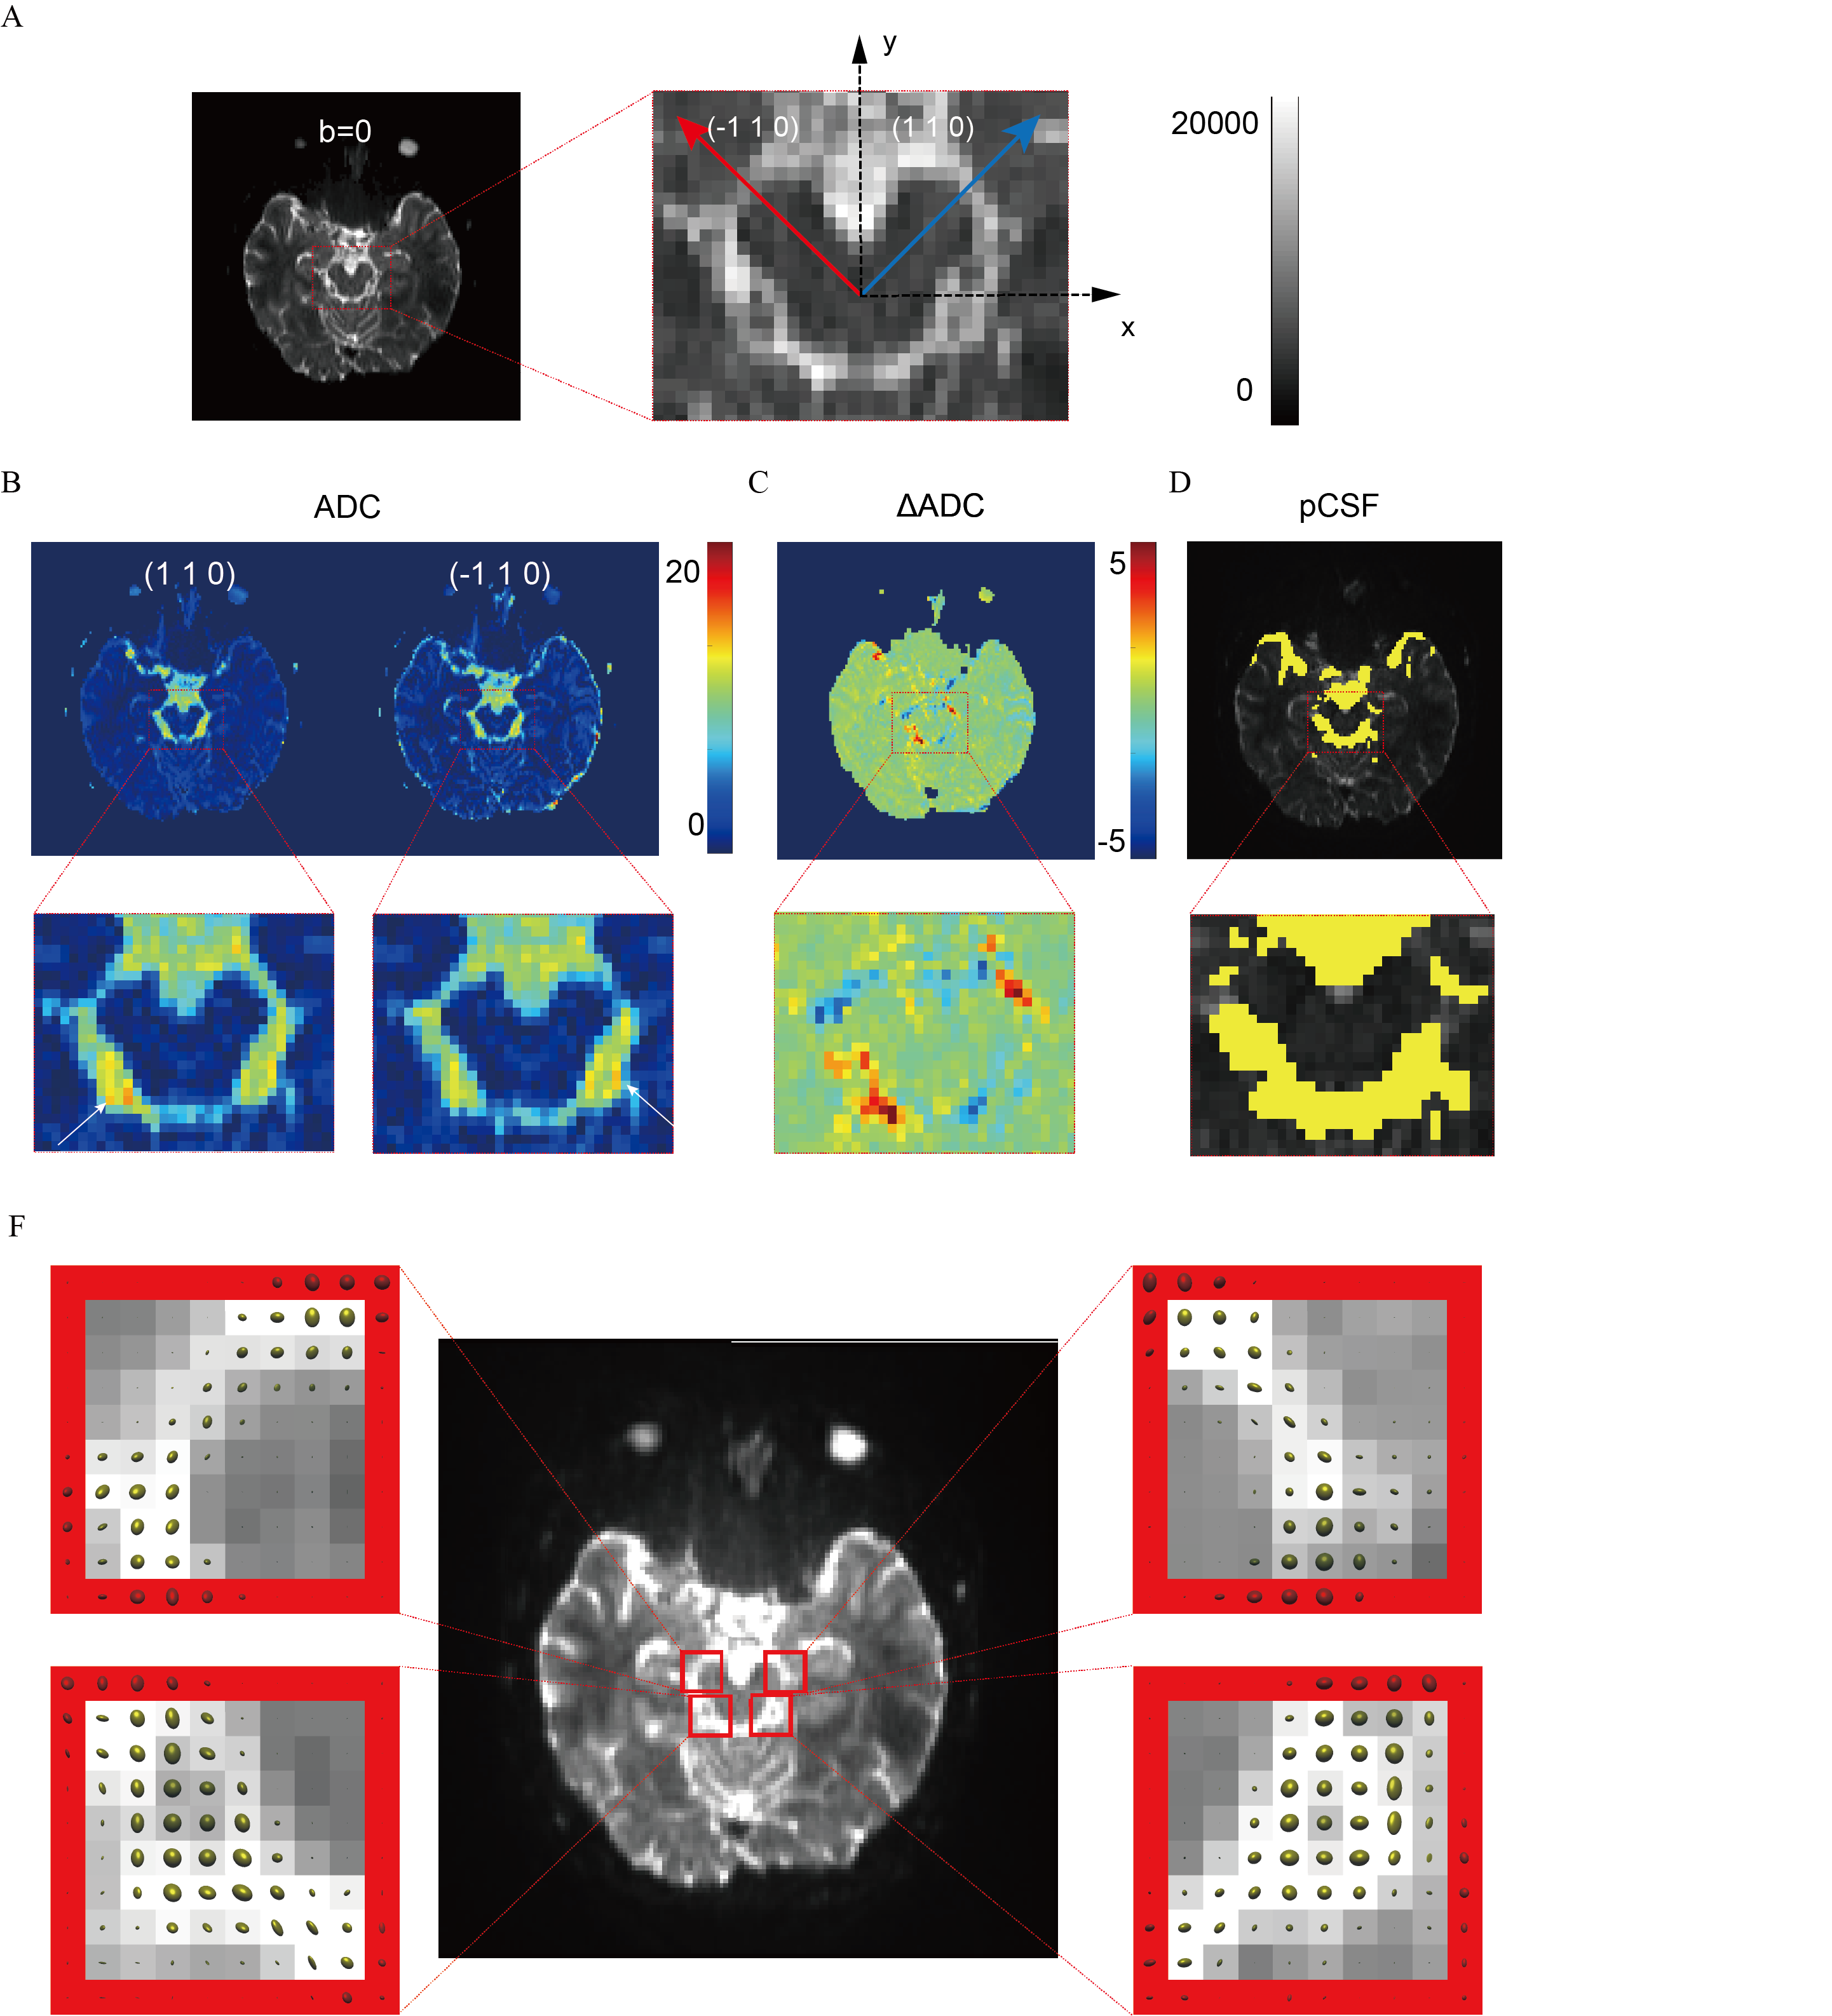
Figure 2. The arterial pCSFs exhibits clear anisotropic property. (A) The left column shows the image of b=0 mm2/s. The right column is an enlarged image of PCA, where the two PCA segments oriented parallel and perpendicular to the set gradient directions (1, 1, 0) and (-1, 1, 0). (B) shows the ADC maps in the (1, 1, 0) and (-1, 1, 0) directions. (C) shows the ADC difference maps between (1, 1, 0) and (-1, 1, 0) directions. (D) shows the pCSF mask. (F) The four red enlarged regions containing the orientation distribution maps of the tensors raised from the different part from the pCSF of PCA.
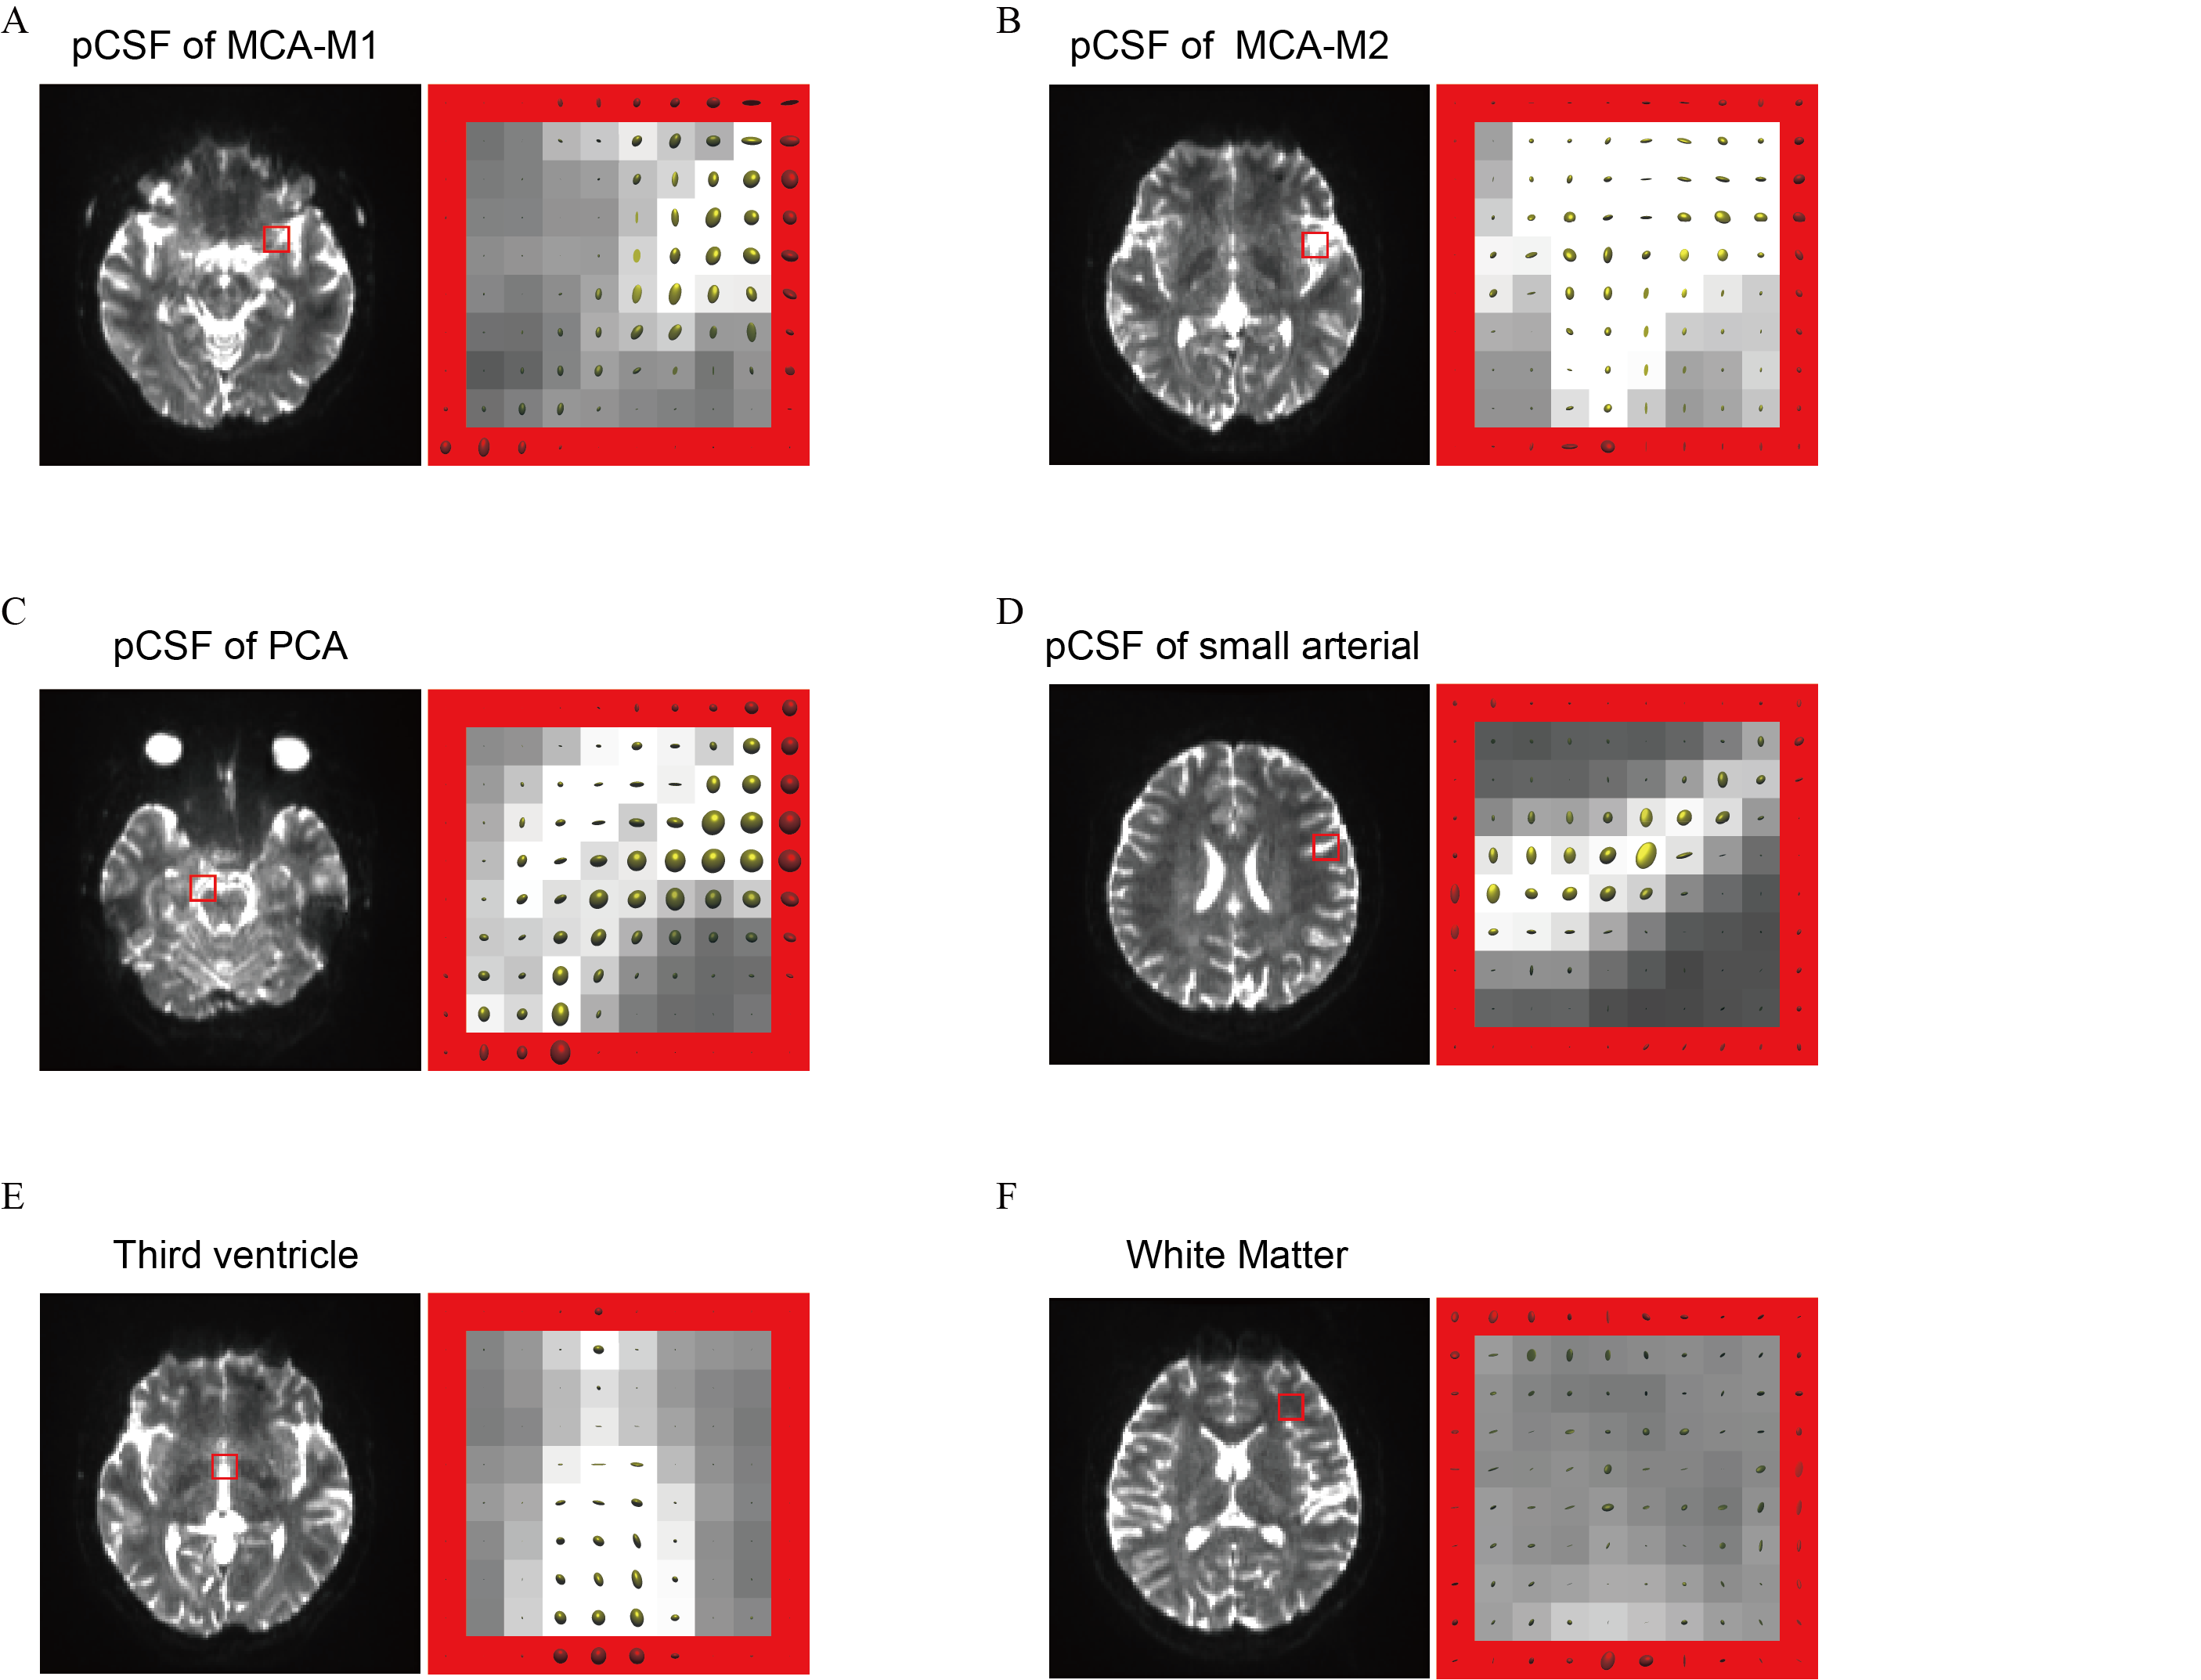
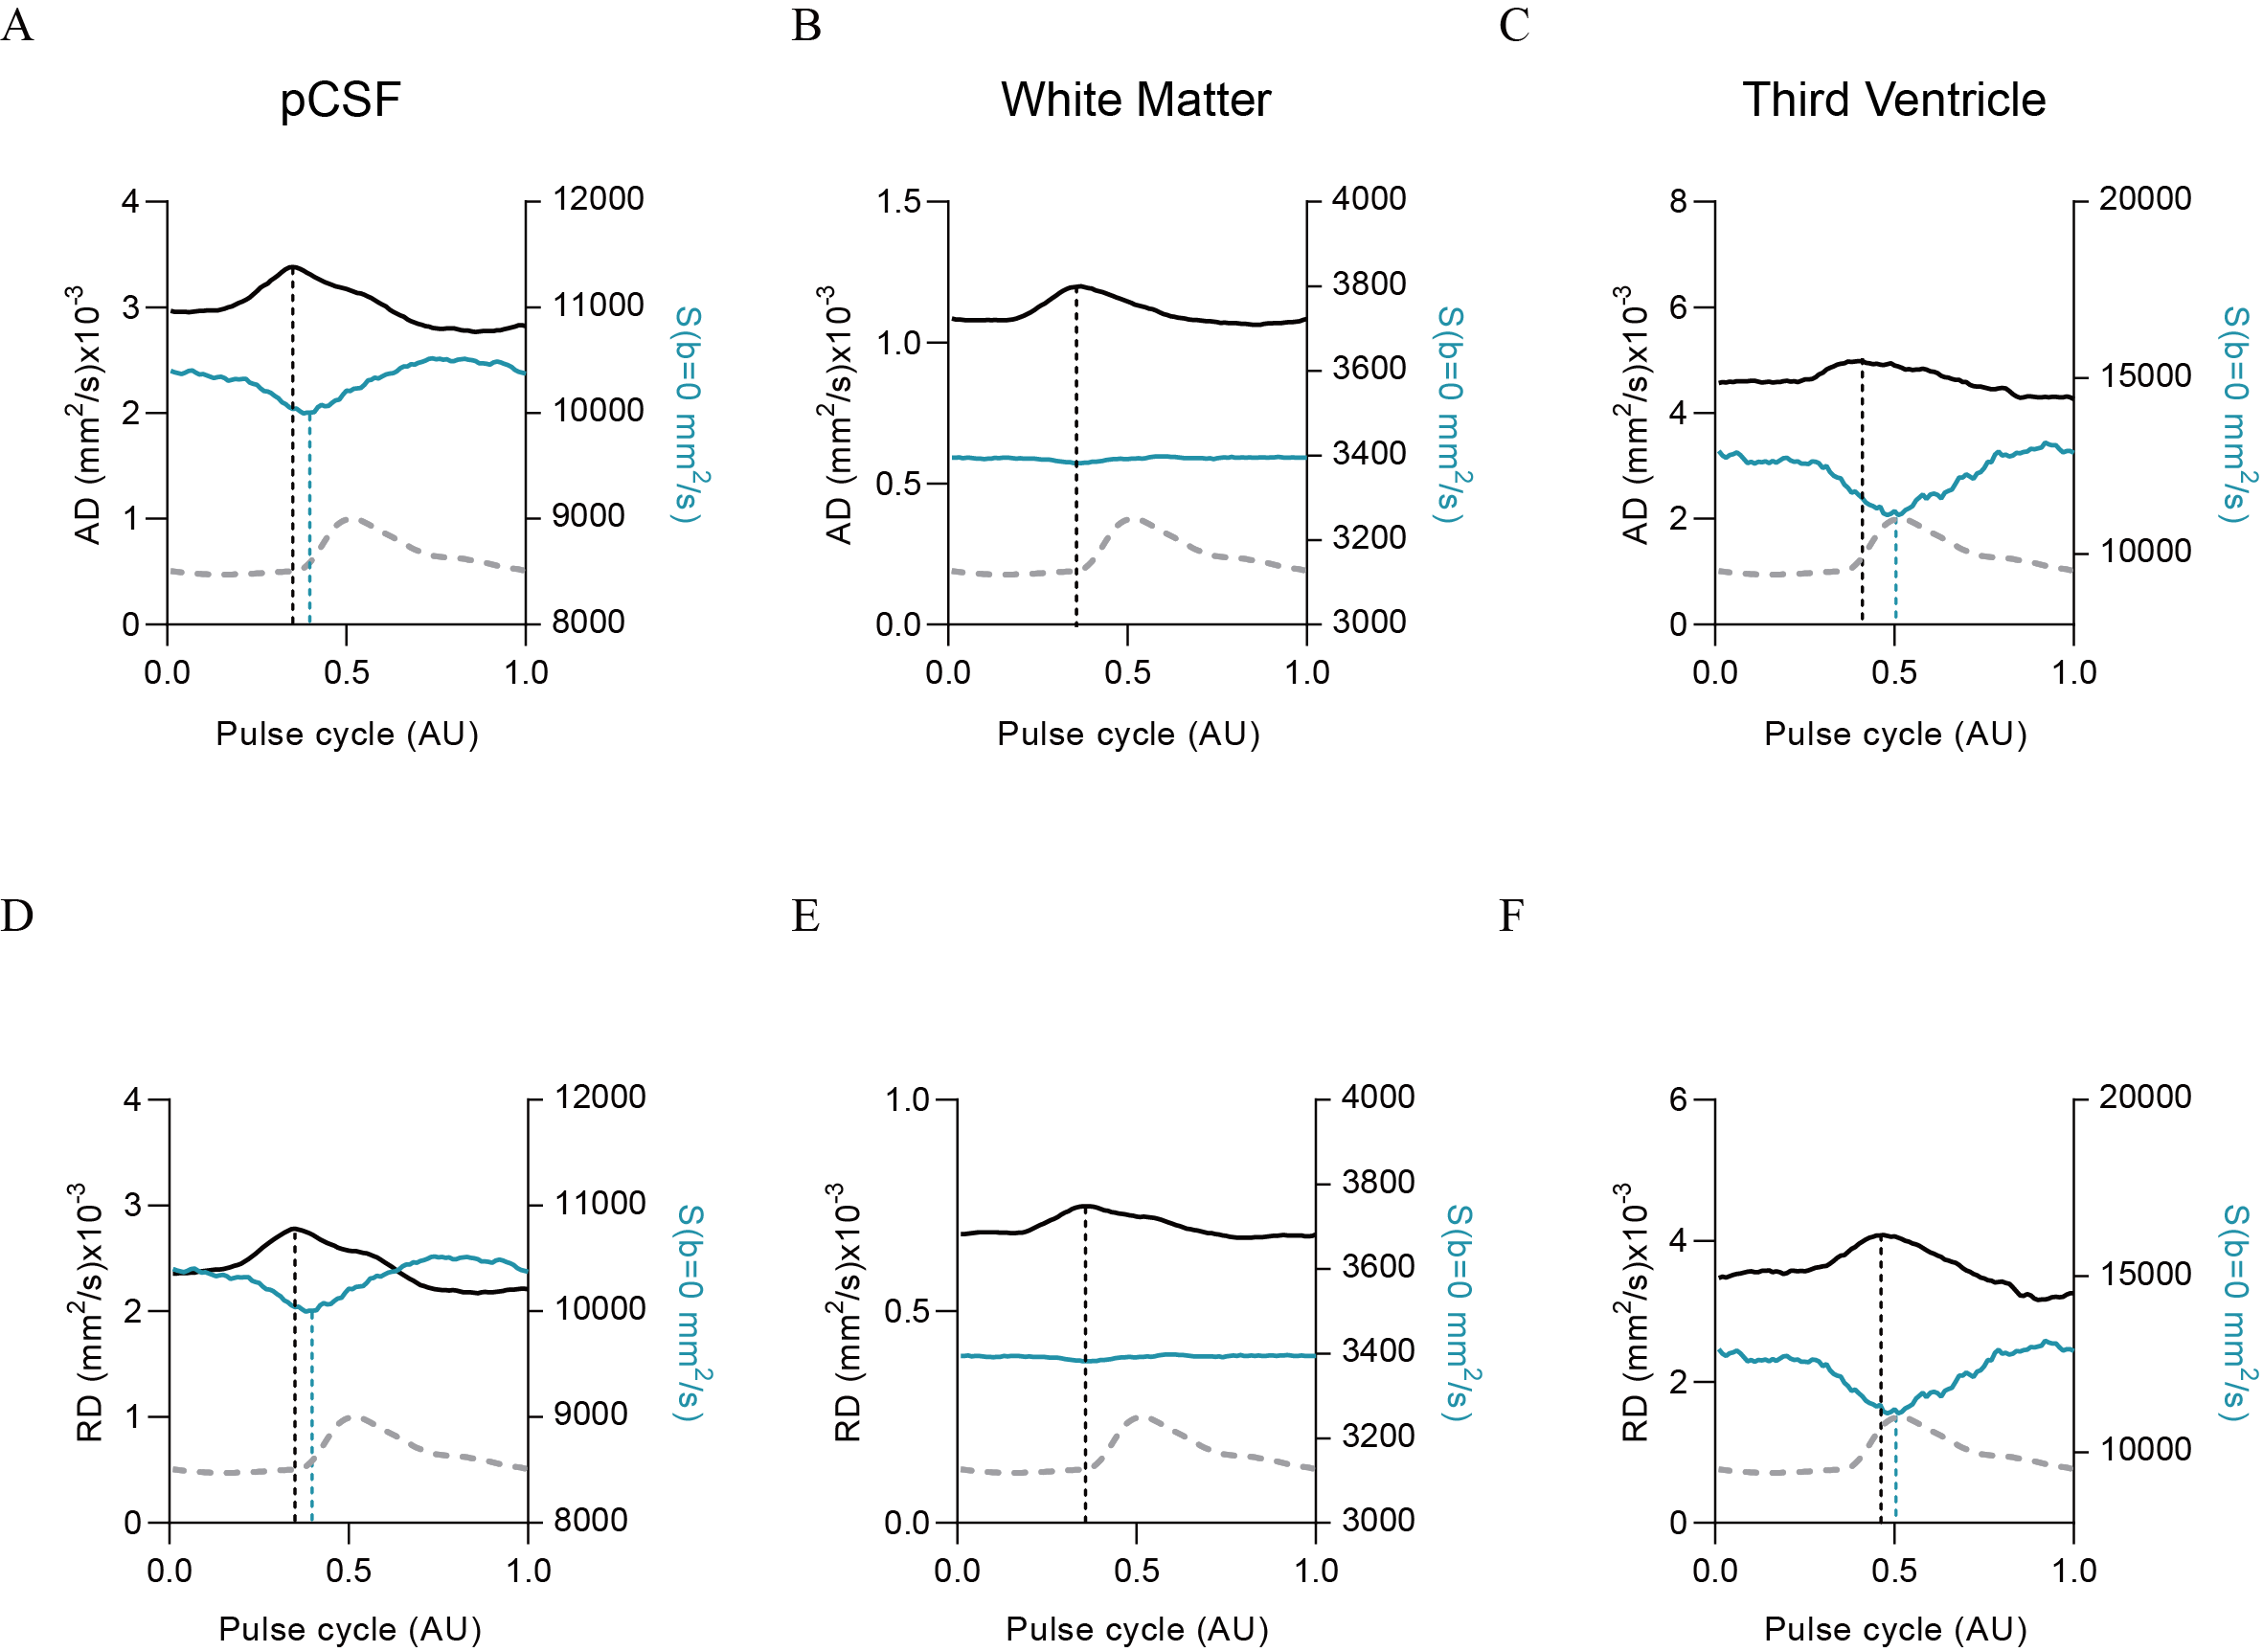
Figure 4. The pulsatile waveform of the DTI metrics and raw data. The first row (A-C) shows the averaged value of AD (black solid line) and the DTI signal at b = 0 mm2/s (blue solid line) in one cardiac cycle from pCSF mask, white matter and third ventricle. And the second row (D-F) shows the RD (black solid line) signal from these three ROIs. The dashed gray signal indicates the pulse cycle signal recorded through the finger oximeter. The black dashed line indicated the peak location of the DTI metrics, and the blue dashed line indicated the bottom location of the DTI signal at b = 0 mm2/s.
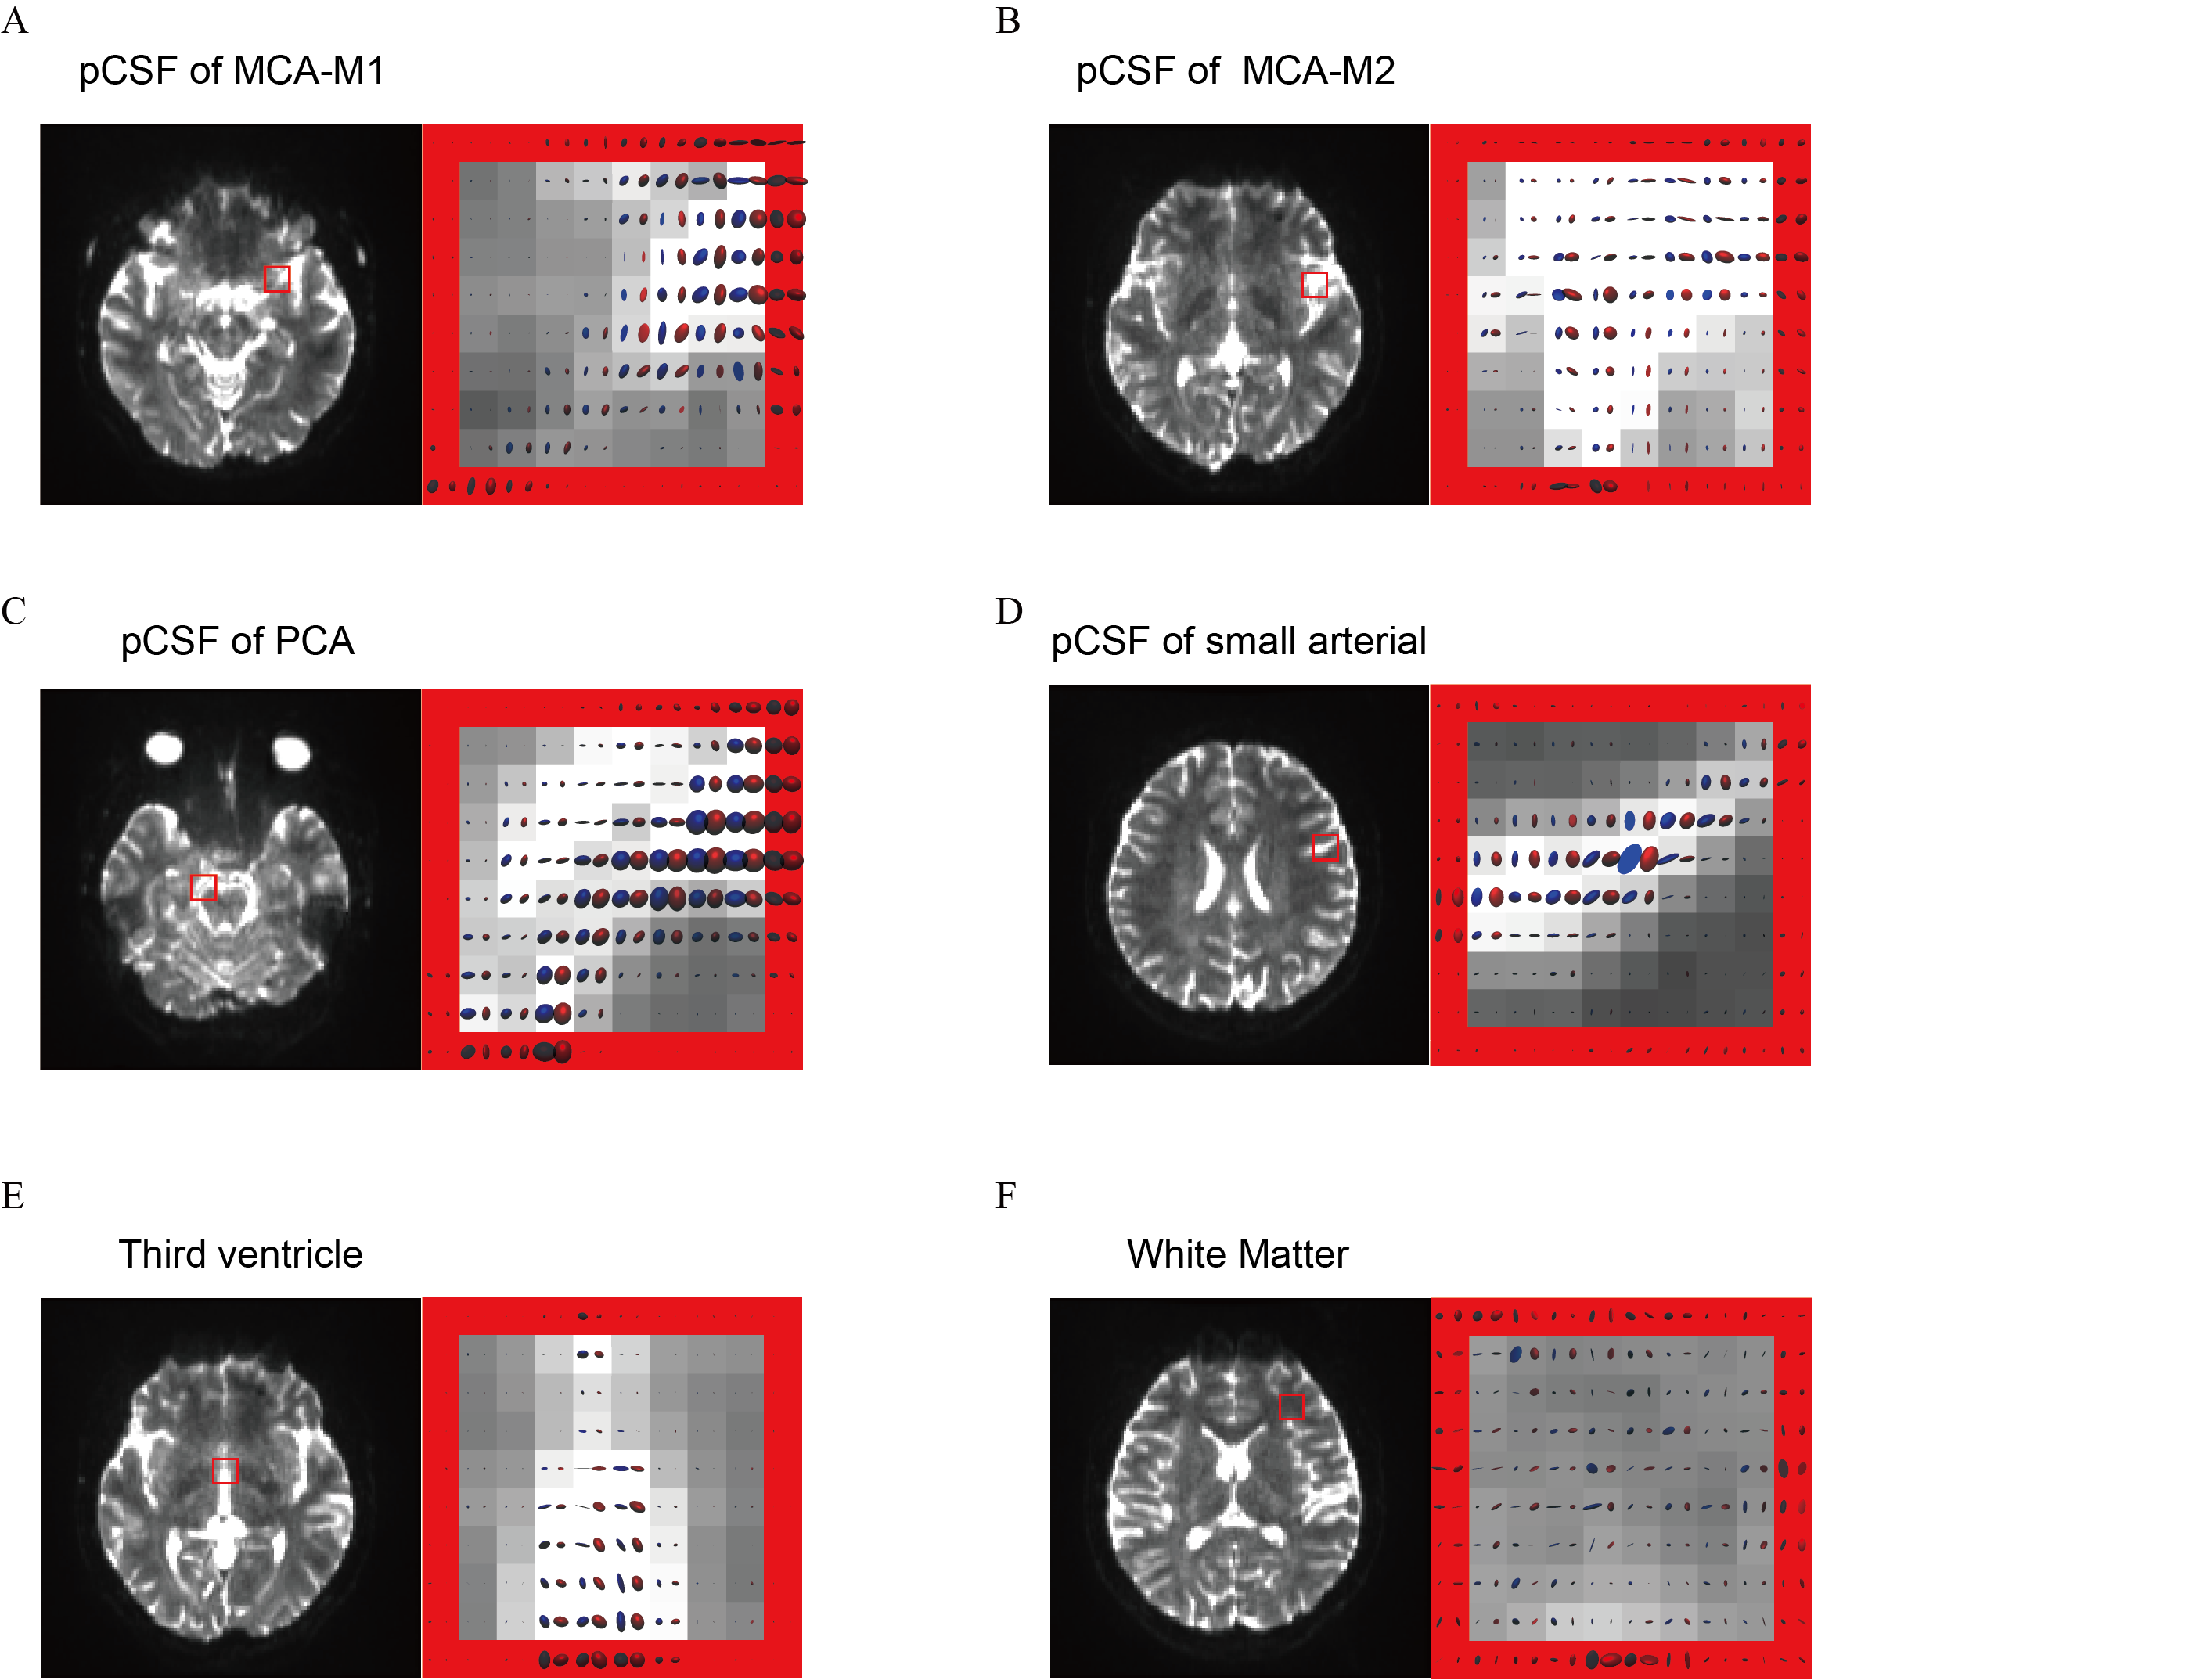
Figure 5. The tensor orientation during different phase of a cardiac cycle. (A-D) pCSF of MCA-M1 segment, MCA-M2 segment, PCA and small artery. (E) Third ventricle, (F) White matter. The blue tensor demonstrated the tensor derived from the cardiac diastolic phase (pulse cycle: 0-0.1,0.5-1) and the red one derived from the cardiac systolic phase (pulse cycle: 0.1-0.5). There has a maximum apparent diffusion coefficient (ADC) of 20×10−9 m2/s for each voxel in A–C and E. The maximum ADCs of 10×10−9 m2/s and 5×10⁻⁹ m2/s in (D) and (F).