0982
Neuronal activity can drive cerebrospinal fluid flux via brain blood volume1Department of Neuroradiology, Technical University of Munich, School of Medicine and Health, Munich, Germany, 2TUM Institute for Advanced Study, Munich, Germany, 3TUM-Neuroimaging Center, Technical University of Munich, School of Medicine and Health, Munich, Germany, 4Department of Anesthesiology and Intensive Care, Technical University of Munich, School of Medicine and Health, Munich, Germany, 5Department of Neurology, Technical University of Munich, School of Medicine and Health, Munich, Germany, 6Department of Neurology, University of Heidelberg, Heidelberg, Germany, 7Department of Neurology, Asklepios Stadtklinik Bad Tölz, Bad Tölz, Germany, 8Deparment of Psychiatry and Psychotherapy, Technical University of Munich, School of Medicine and Health, Munich, Germany, 9Psychiatry, Charité - Universitätsmedizin Berlin and DZNE, Berlin, Germany, 10University of Edinburgh and UKI DRI, Edinburgh, United Kingdom
Synopsis
Keywords: Neurofluids, Neurofluids
Motivation: A driver of macroscopic CSF flux across ventricles and basal cisternae is hypothesized to be global cerebral blood volume, possibly induced by changes in brain-wide neuronal activity.
Goal(s): We intended to test this hypothesis experimentally in healthy human subjects.
Approach: We performed two experiments: (1) electro-encephalography and functional MRI (fMRI) during burst-suppression anesthesia, and (2) arterial spin labeling and fMRI during transient hypercapnic challenges in wakefulness.
Results: Changes in brain blood volume, induced by neuronal activity switches during burst-suppression or brain blood flow during hyper-normocapnia transitions, cause fMRI signal changes in the basal cisternae which represent CSF flux from or into the brain.
Impact: Two distinct experiments revealed a consistent and direct coupling between macroscopic CSF flux and brain blood volume, which can be induced by changes in global neuronal activity. This may contribute to perivascular CSF flow and facilitate brain waste clearance.
Introduction
In the brain, the removal of waste products depends on the exchange of molecules between the cerebrospinal fluid (CSF) and the interstitium.1,2 According to the model of the glymphatic system,3 CSF moves along the ventricles, basal cisternae, and subarachnoid spaces in order to enter the brain via periarterial spaces. After passing the astrocytic barrier, it drains the interstitial fluid into perivenous spaces via convective flow. CSF movement, i.e., flux, is induced by arterial motion,4-6 heartbeat and respiration,7-10 and changes in cerebral blood volume (CBV).11-14 Here, we investigate the relationship between neuronal activity, global CBV and CSF flux by experimentally isolating the individual components of this mechanistic pathway in humans.Methods
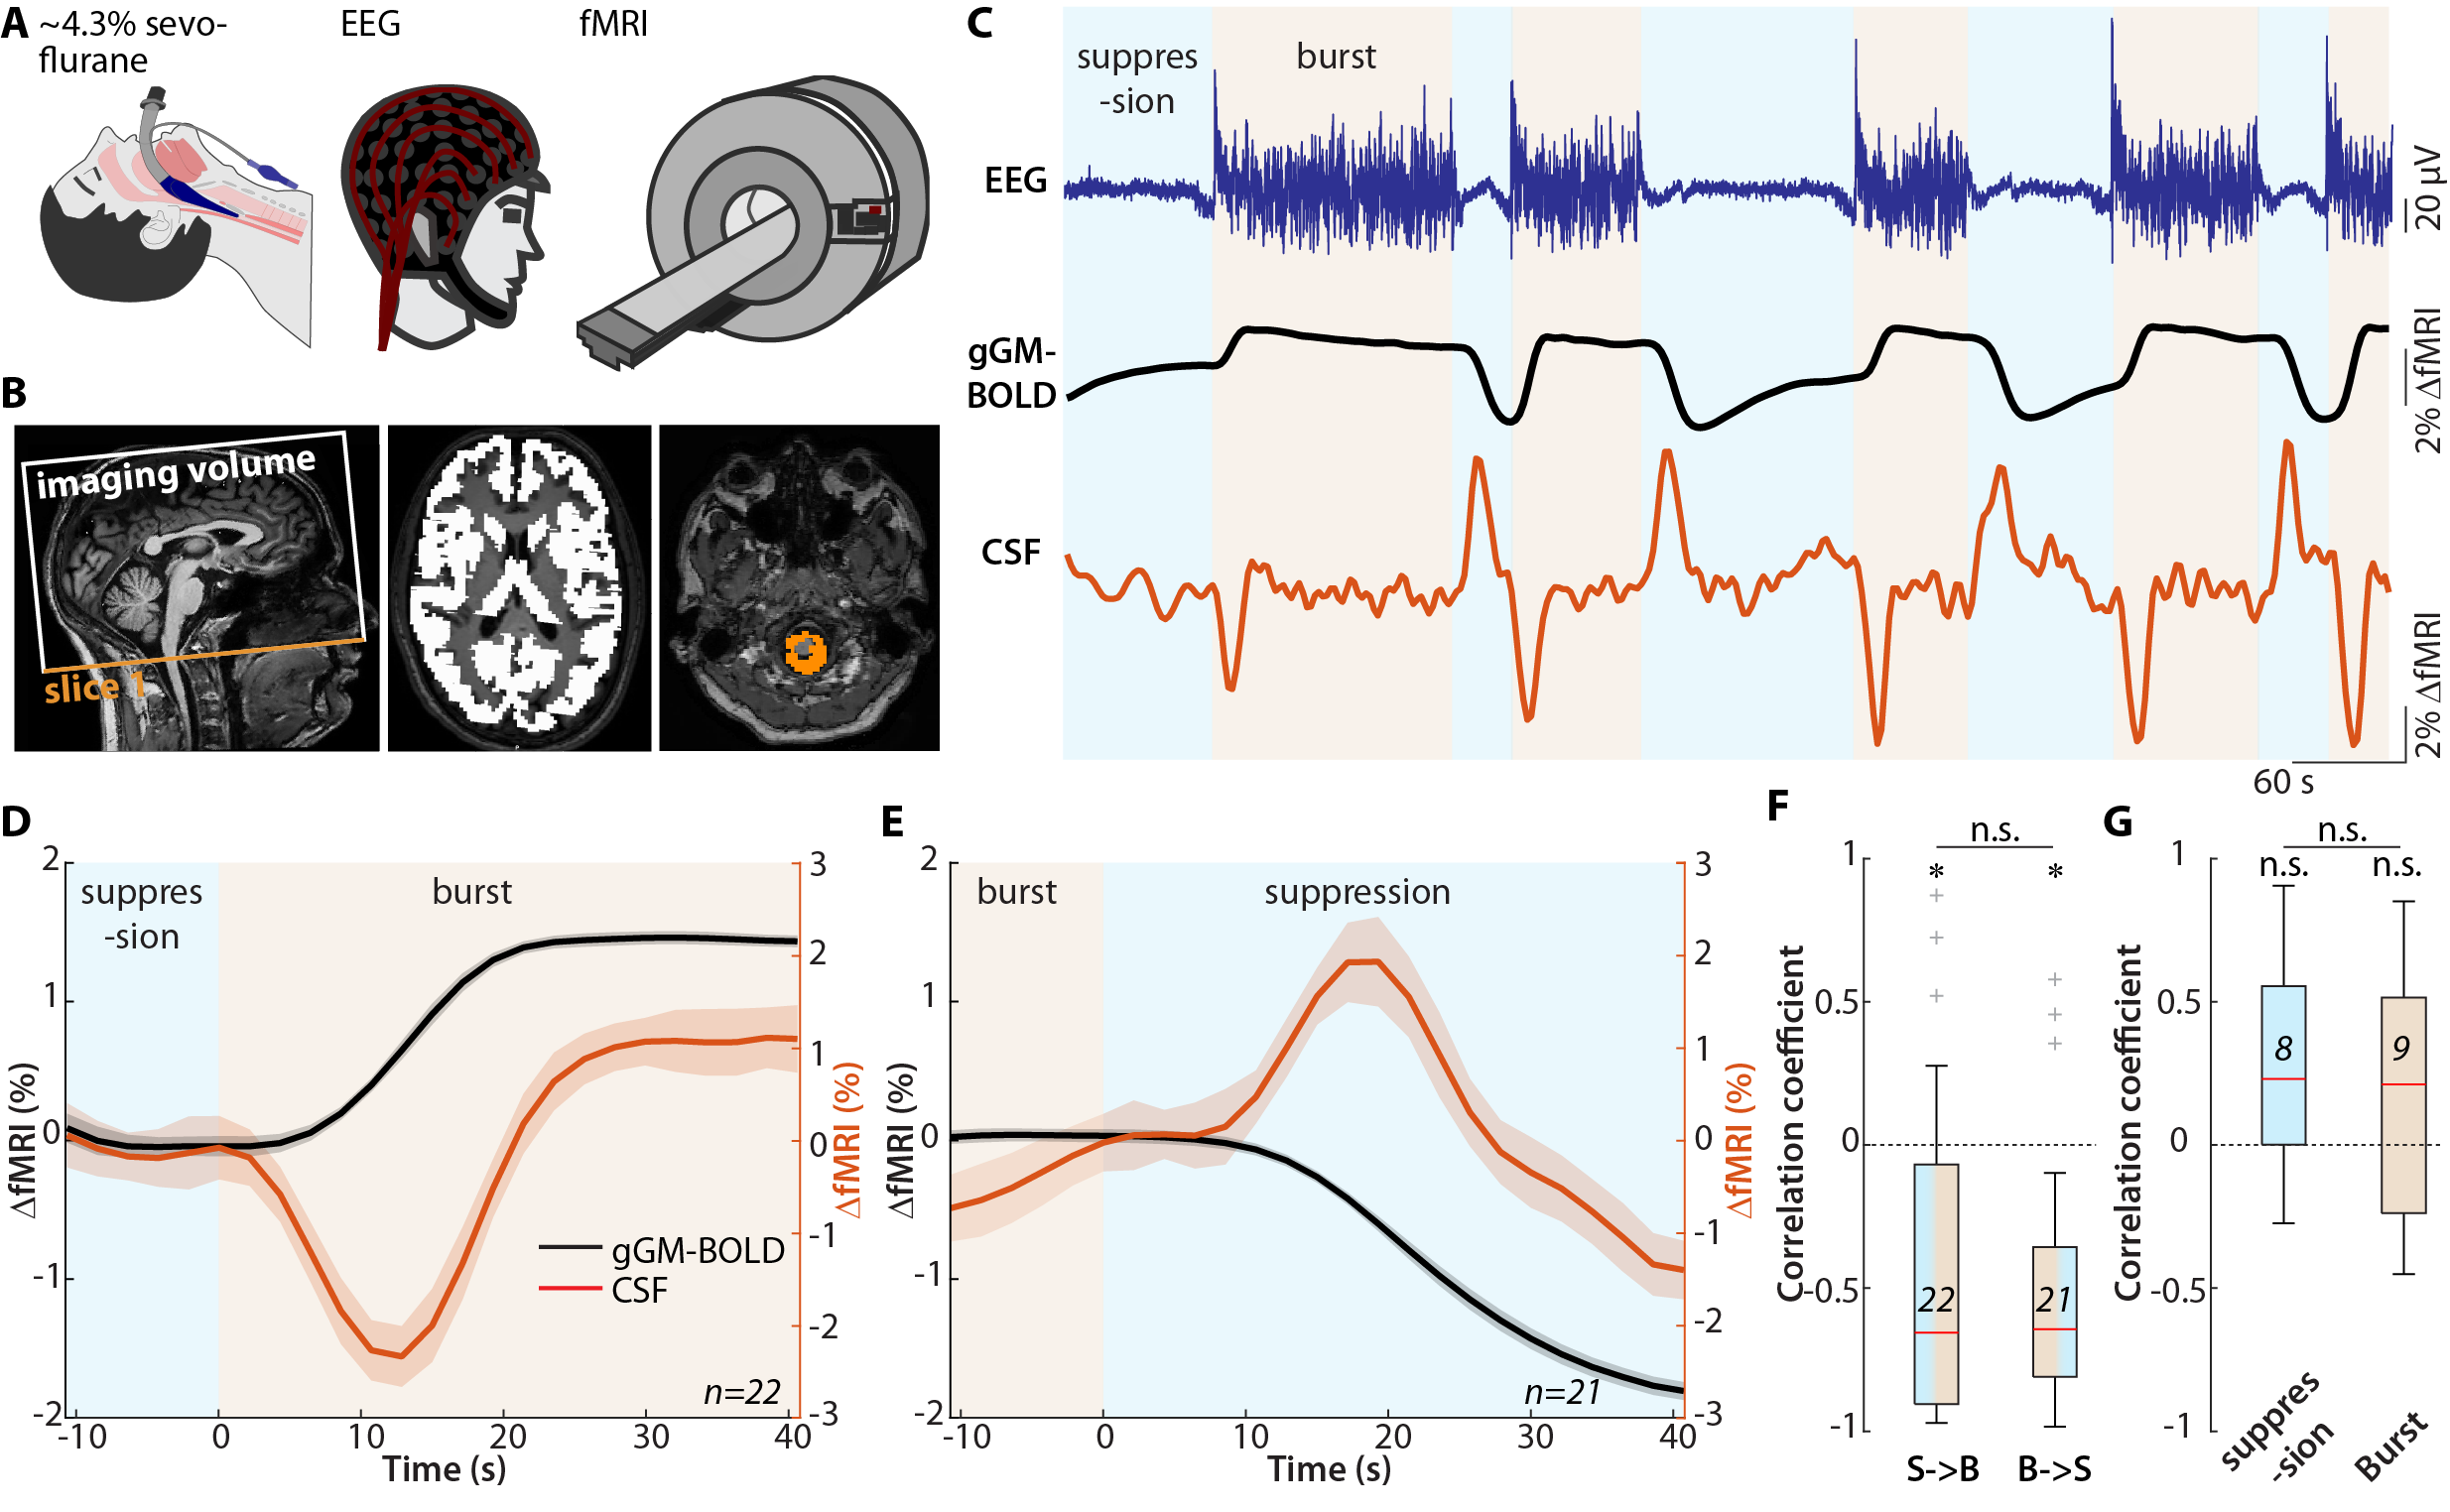
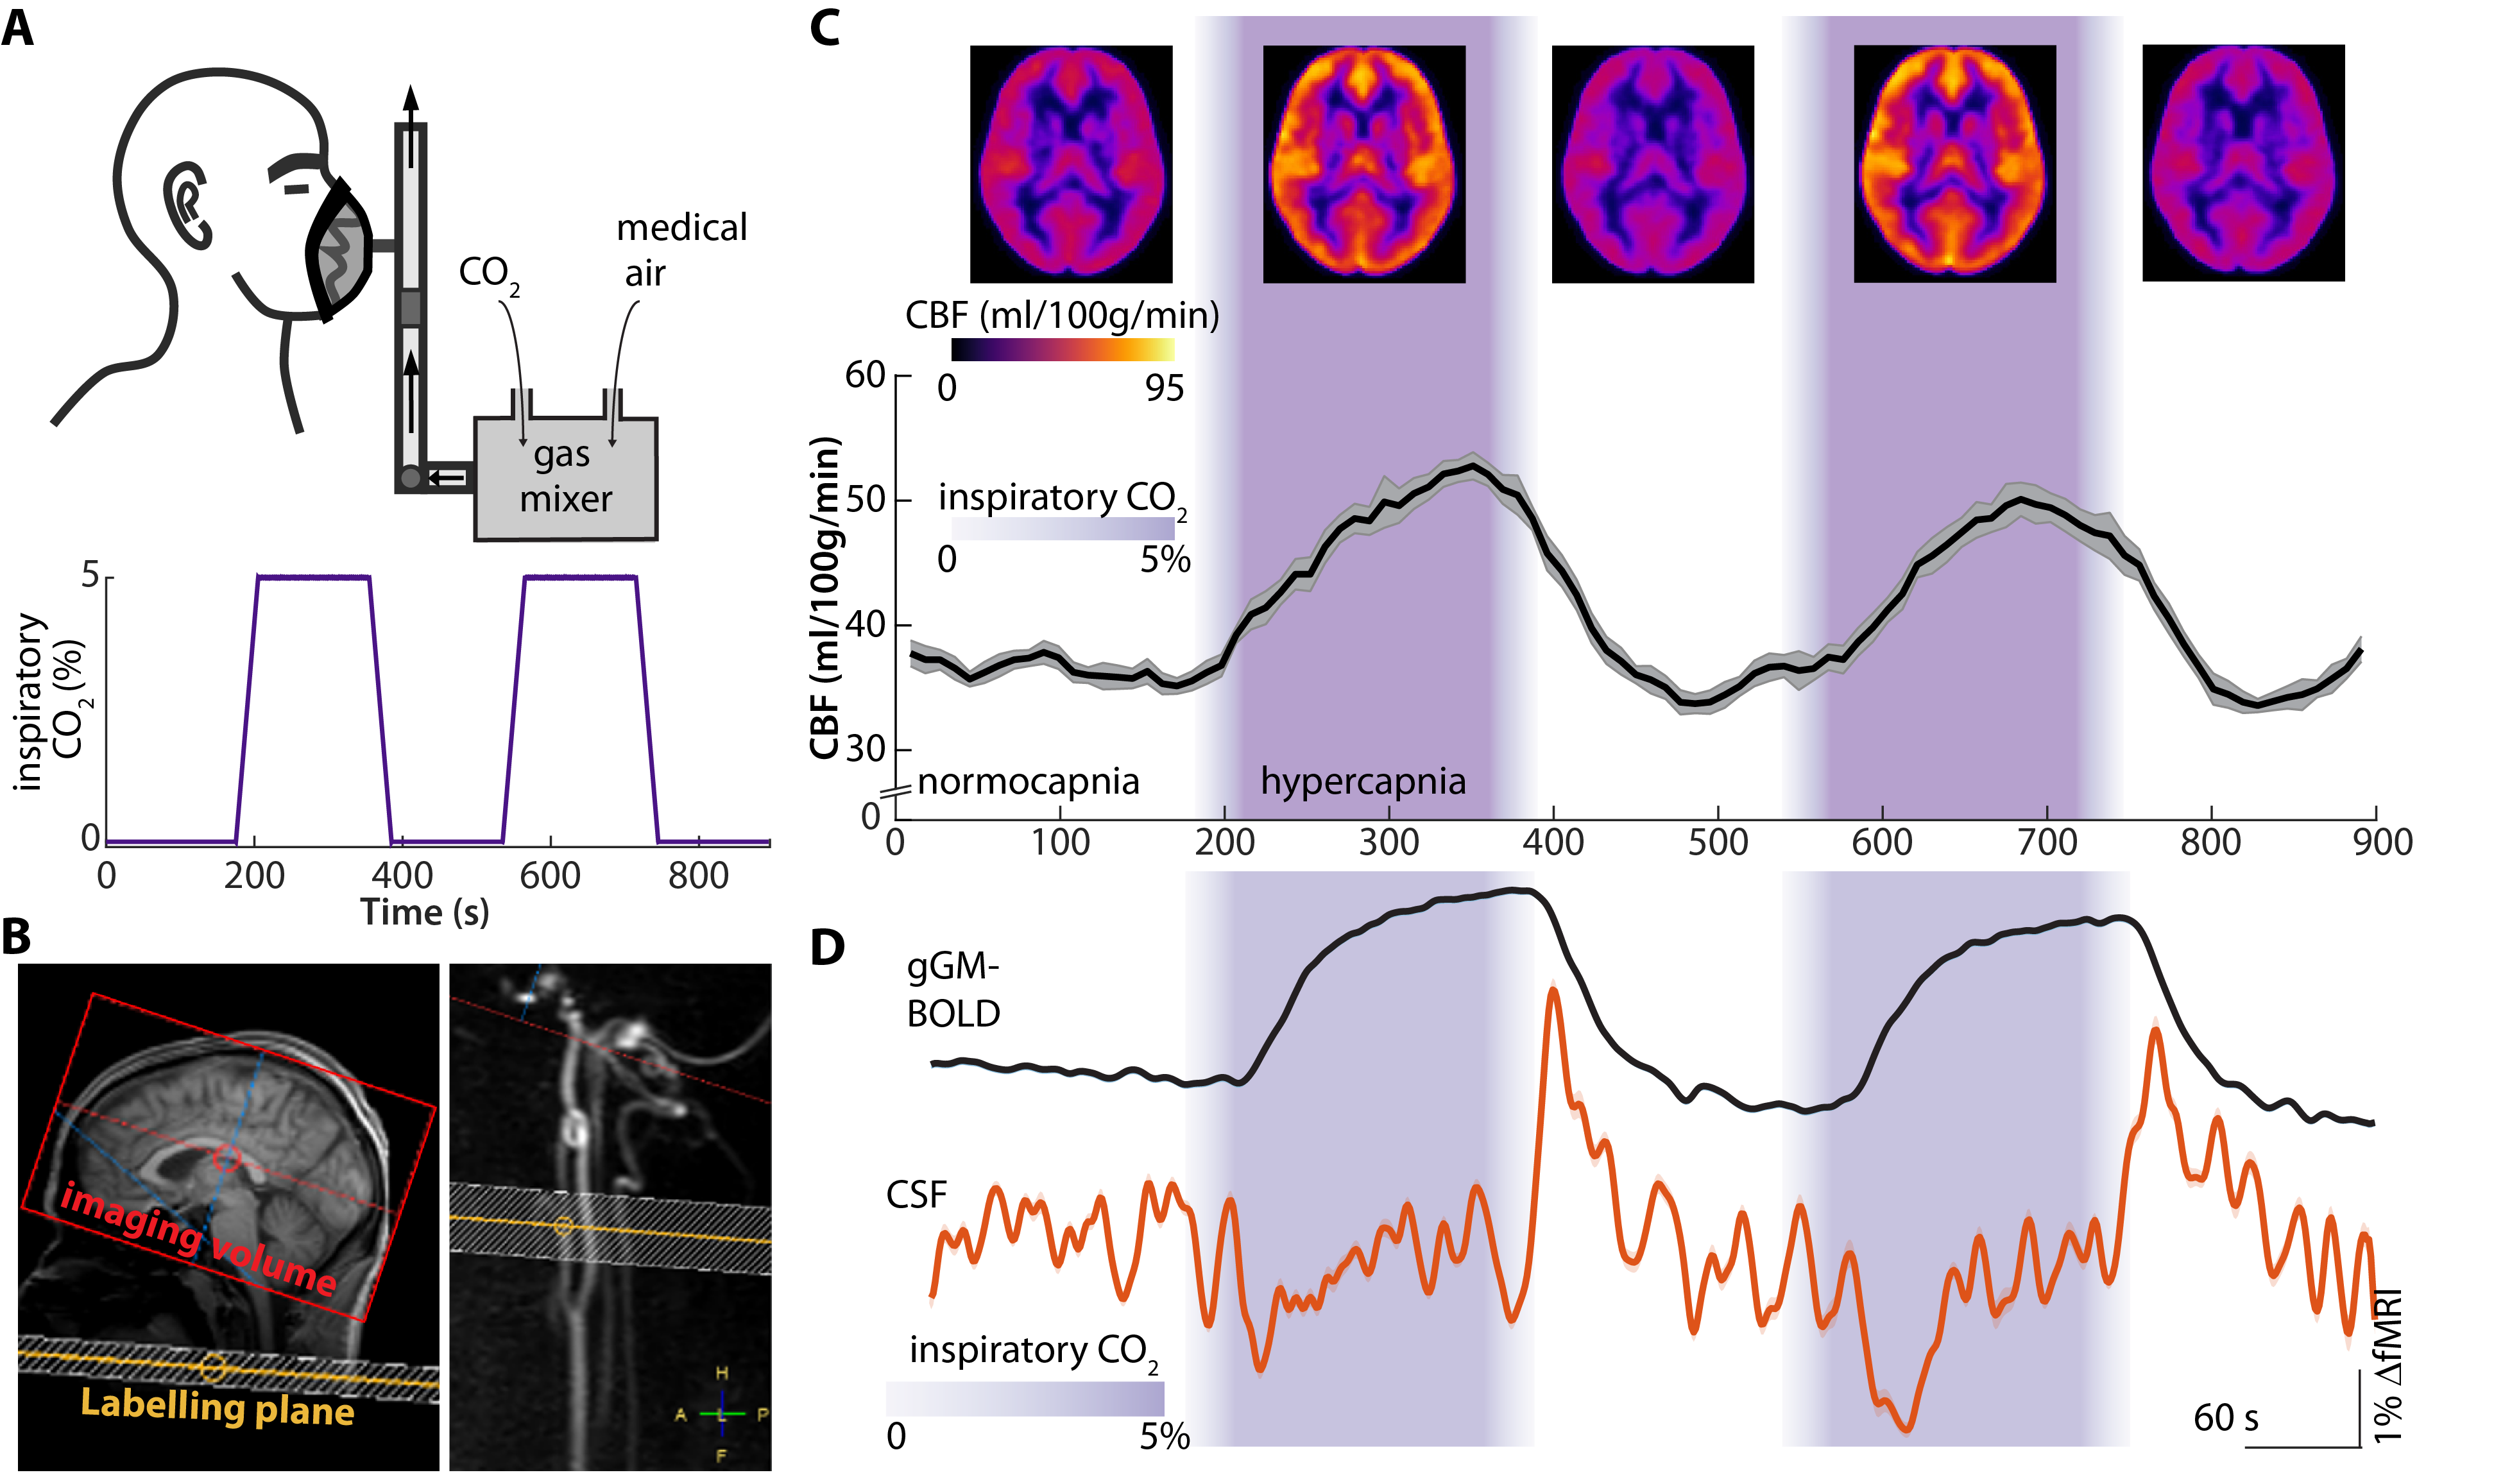
We performed two experiments in healthy human subjects (n = 17, respectively): First, we reanalyzed an existing dataset,15-17 comprising simultaneous electroencephalogram (EEG) and functional magnetic resonance imaging (fMRI) recordings during deep sevoflurane anesthesia which cause a burst-suppression EEG, featuring brain-wide instantaneous transitions between isoelectric suppression phases (i.e., minimal neuronal activity) and global bursts (i.e., high broadband-power activity).18 Second, we performed pseudo-continuous arterial spin labeling (pCASL) MRI and fMRI during a transient hypercapnic challenge, i.e., transiently increased inspiratory CO2-levels from 0% to 5%, in awake subjects. In both experiments, we recorded fMRI data using a gradient echo planar imaging sequence and co-registration to T1-weighted data. We extracted the global grey matter (gGM)-blood oxygen level-dependent (BOLD) signal as well as the CSF signal from the voxels with the highest intensity in the three bottom slices of the fMRI data. In the EEG-data, we defined burst-episodes as surpassing the mean by at least 2 standard deviations. The pCASL MRI was acquired as recommended19 and CBF time series were derived for each subject and averaged across subjects.Results
We found that, on the single subject level, the gGM-BOLD signal followed the burst-suppression pattern in the EEG, both for transitions from suppression to burst epochs, and from burst to suppression (Fig. 1 A-C). In the CSF voxels of slice 1, we detected a positive peak, which was related to the decrease of the gGM-BOLD signal at the end of each burst (Fig. 1 C,E) and an inverse negative transient in the CSF voxels of slice 1, which was correlated with an increase in the gGM-BOLD signal (Fig. 1 C,D). Thus, for both transitions, we observed significant anticorrelations between gGM-BOLD and CSF signals, i.e., gGM-CSF coupling (Fig. 1F). In contrast, in steady-state burst or suppression epochs, the correlation was close to zero (Fig. 1G).In the second experiment, we first evaluated pCASL MRI data for CBF to confirm the hemodynamic-vasodilatory effect of the hypercapnic challenge (Fig. 2 A, B). CBF was higher across the whole brain during hypercapnia than during normocapnia and the time course of gGM-CBF followed the levels of inspiratory CO2 (Fig. 2C). Second, we evaluated the fMRI data for gGM-BOLD and CSF signals. Upon the onset of hypercapnia, gGM-BOLD increased from a stable baseline and almost reached a plateau during hypercapnia, before decreasing following the drop of inspiratory CO2 levels. In the CSF-signal, similarly to the first experiment, we detected a dip co-occurring with the increase of the gGM-BOLD signal and a positive peak associated with the decrease of gGM-BOLD (Fig. 2D).
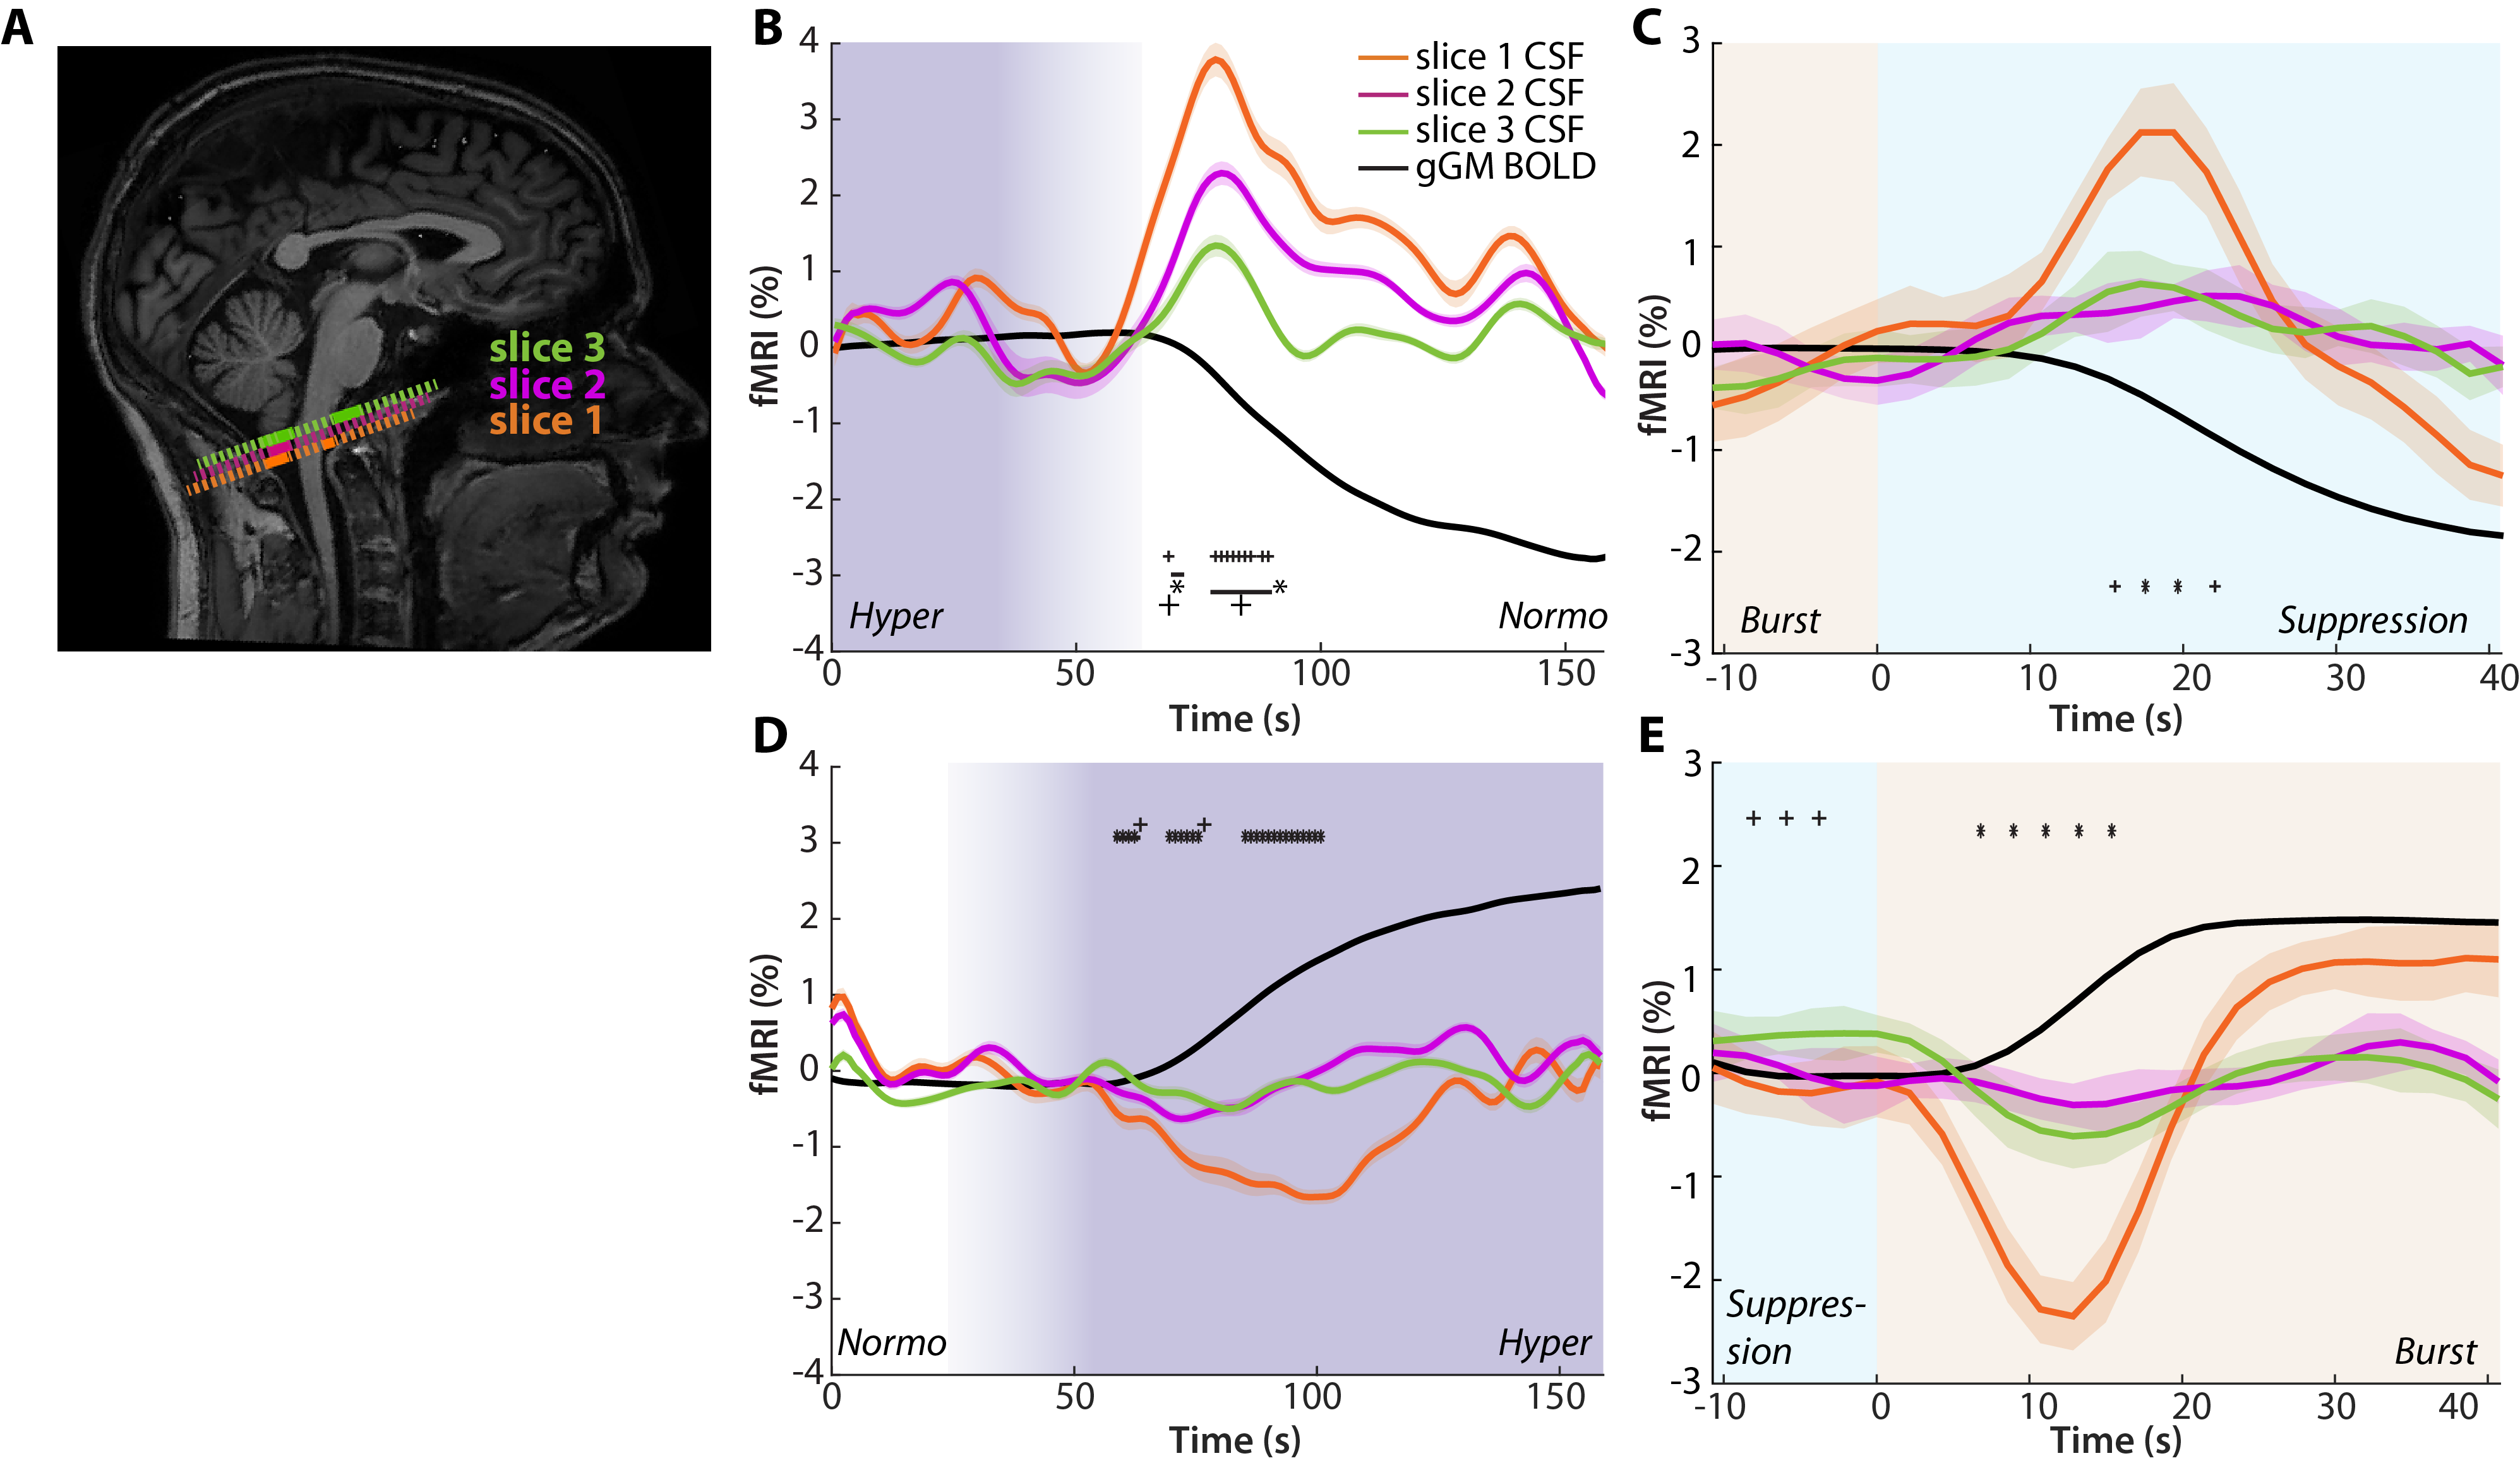
We next analyzed the fMRI-based CSF signals with respect to indicators of flux direction using slice-sensitive analysis across both experiments (Fig. 3A). During transitions associated with a decrease of gGM-BOLD, i.e., hyper->normocapnia or burst->suppression, the CSF signal amplitude decreased with increasing slice number (Fig. 3 B,C), while the CSF signal associated with increases of gGM-BOLD was only detected in slice 1 (Fig. 3 D,E).
Discussion and Conclusions
We demonstrate that rapid switches between neuronal quiescence and bursts induce large global changes in the gGM-BOLD-signal, which cause inversely related CSF-signals across the basal cisternae. Moreover, similar CSF signal behavior can be induced by manipulating CBF via a transient hypercapnic challenge. As predicted by the inflow effect,20 positive signal peaks in CSF decay with increasing slice number, indicating influx.11 In contrast, negative peaks are only detectable in slice 1, which may be explained by outflux of incompletely saturated CSF through slice 1. Remarkably, the coupling of brain CBV changes to CSF in- and outflux is comparable in both experiments despite clear differences in methods, context and dynamics, expanding existing models of CBV-dependent CSF flux control.11,13Together, our experiments provide direct evidence for tight mechanistic coupling between global neuronal activity, brain blood flow and volume, and macroscopic CSF flux, which might be harnessed to enhance brain waste clearance.
Acknowledgements
Funding: German Research Foundation (395030489) - CS and CP; German Research Foundation (DFG SFB/TRR167 B07) - JP; BZ is a is an Albrecht-Struppler-Clinician Scientist Fellow, funded by the Federal Ministry of Education and Research (BMBF) and the Free State of Bavaria under the Excellence Strategy of the Federal Government and the Länder, as well as by the Technical University of Munich - Institute for Advanced Study.References
1 Xie, L. et al. Sleep drives metabolite clearance from the adult brain. Science 342, 373–377, doi:10.1126/science.1241224 (2013).
2 Plog, B. A. & Nedergaard, M. The Glymphatic System in Central Nervous System Health and Disease: Past, Present, and Future. Annual Review of Pathology: Mechanisms of Disease 13, 379-394, doi:10.1146/annurev-pathol-051217-111018 (2018).
3 Zhao, L., Tannenbaum, A., Bakker, E. N. T. P. & Benveniste, H. Physiology of Glymphatic Solute Transport and Waste Clearance from the Brain. Physiology 37, 349-362, doi:10.1152/physiol.00015.2022 (2022).
4 van Veluw, S. J. et al. Vasomotion as a Driving Force for Paravascular Clearance in the Awake Mouse Brain. Neuron 105, 549-561.e545, doi:10.1016/j.neuron.2019.10.033 (2020).
5 Iliff, J. J. et al. Cerebral arterial pulsation drives paravascular CSF-interstitial fluid exchange in the murine brain. J Neurosci 33, 18190-18199, doi:10.1523/jneurosci.1592-13.2013 (2013).
6 Mestre, H. et al. Flow of cerebrospinal fluid is driven by arterial pulsations and is reduced in hypertension. Nature Communications 9, 4878, doi:10.1038/s41467-018-07318-3 (2018).
7 Spijkerman, J. M. et al. Phase contrast MRI measurements of net cerebrospinal fluid flow through the cerebral aqueduct are confounded by respiration. Journal of Magnetic Resonance Imaging 49, 433-444, doi:https://doi.org/10.1002/jmri.26181 (2019).
8 Kiviniemi, V. et al. Ultra-fast magnetic resonance encephalography of physiological brain activity - Glymphatic pulsation mechanisms? J Cereb Blood Flow Metab 36, 1033-1045, doi:10.1177/0271678x15622047 (2016).
9 Dreha-Kulaczewski, S. et al. Inspiration is the major regulator of human CSF flow. J Neurosci 35, 2485-2491, doi:10.1523/jneurosci.3246-14.2015 (2015).
10 Alperin, N., Vikingstad, E. M., Gomez‐Anson, B. & Levin, D. N. Hemodynamically independent analysis of cerebrospinal fluid and brain motion observed with dynamic phase contrast MRI. Magnetic resonance in medicine 35, 741-754 (1996).
11 Fultz, N. E. et al. Coupled electrophysiological, hemodynamic, and cerebrospinal fluid oscillations in human sleep. Science 366, 628-631, doi:10.1126/science.aax5440 (2019).
12 Picchioni, D. et al. Autonomic arousals contribute to brain fluid pulsations during sleep. NeuroImage 249, 118888, doi:https://doi.org/10.1016/j.neuroimage.2022.118888 (2022).
13 Yang, H.-C. et al. Coupling between cerebrovascular oscillations and CSF flow fluctuations during wakefulness: An fMRI study. Journal of Cerebral Blood Flow & Metabolism 42, 1091-1103, doi:10.1177/0271678X221074639 (2022).
14 Wang, Y. et al. Cerebrovascular activity is a major factor in the cerebrospinal fluid flow dynamics. NeuroImage 258, 119362, doi:https://doi.org/10.1016/j.neuroimage.2022.119362 (2022).
15 Golkowski, D. et al. Changes in Whole Brain Dynamics and Connectivity Patterns during Sevoflurane- and Propofol-induced Unconsciousness Identified by Functional Magnetic Resonance Imaging. Anesthesiology 130, 898-911, doi:10.1097/aln.0000000000002704 (2019).
16 Ranft, A. et al. Neural Correlates of Sevoflurane-induced Unconsciousness Identified by Simultaneous Functional Magnetic Resonance Imaging and Electroencephalography. Anesthesiology 125, 861-872, doi:10.1097/aln.0000000000001322 (2016).
17 Sirmpilatze, N. et al. Spatial signatures of anesthesia-induced burst-suppression differ between primates and rodents. eLife 11, e74813, doi:10.7554/eLife.74813 (2022).
18 Shanker, A., Abel, J. H., Schamberg, G. & Brown, E. N. Etiology of Burst Suppression EEG Patterns. Frontiers in Psychology 12, doi:10.3389/fpsyg.2021.673529 (2021).
19 Alsop, D. C. et al. Recommended implementation of arterial spin-labeled perfusion MRI for clinical applications: A consensus of the ISMRM perfusion study group and the European consortium for ASL in dementia. Magn Reson Med 73, 102-116, doi:10.1002/mrm.25197 (2015).
20 Gao, J.-H. & Liu, H.-L. Inflow effects on functional MRI. NeuroImage 62, 1035-1039, doi:https://doi.org/10.1016/j.neuroimage.2011.09.088 (2012).
Figures