0981
Blood and CSF Dynamics During One Cardiac Cycle in the Healthy Brain Measured with Cine Phase-Contrast MRI1Bernard and Irene Schwartz Center for Biomedical Imaging, Department of Radiology, New York University Grossman School of Medicine, New York City, NY, United States, 2Center for Advanced Imaging Innovation and Research (CAI2R), Department of Radiology, New York University Grossman School of Medicine, New York City, NY, United States, 3Vilcek Institute of Graduate Biomedical Sciences, New York University Grossman School of Medicine, New York City, NY, United States, 4FONAR Corporation, Melville, NY, United States
Synopsis
Keywords: Neurofluids, Brain
Motivation: Quantitative analysis of blood and CSF flow dynamics is vital to understand the intracranial pulsating fluid movement environment and its role in brain homeostasis.
Goal(s): To characterize the correlation between blood (arterial/venous) and CSF flow within one cardiac cycle.
Approach: Flow dynamic measurements in neck arteries and veins, cervical CSF (CSFc) and CSF in the aqueduct of Sylvius (CSFAq) were obtained using cine phase-contrast MRI from 18 healthy volunteers.
Results: Net blood and CSFc flow wave curves depict a compensatory mechanism resulting in balance of total fluid inflow and outflow. CSFAq flow patterns mimic CSFc ones with some temporal delay.
Impact: Understanding how blood and CSF flow influence each other in healthy subjects provides a reference frame to investigate alterations caused by neurological disease. We showed a dynamic interplay between neck blood and CSF flow at the cervical and aqueduct level.
Introduction
The human central nervous system (CNS) is a complex system whose homeostatic support is ensured by a dynamic coordination of blood and cerebrospinal fluid (CSF) flow in and out of the cranium. Studies have in fact shown that CSF flow is driven by arterial pulsation[1,2]. The cerebral aqueduct (or aqueduct of Sylvius) has especially received growing interest since CSF flow in this structure has recently been observed to vary across different CNS diseases [3].Recent advancements in neuroimaging techniques have enabled investigation of the brain hydrodynamic properties within one cardiac cycle timeframe. However, only few studies have concomitantly investigated the dynamic fluctuations of blood flow (arterial and venous) and CSF flow (both at cervical and aqueduct levels) within such small timeframe[4,5]. Notably, studies have reported changes in such hydrodynamics properties, separately, in diseases[6], sleep[7] and body position[8]. This highlights the importance of establishing a comprehensive understanding of how blood and CSF flow changes within one cardiac cycle.Methods
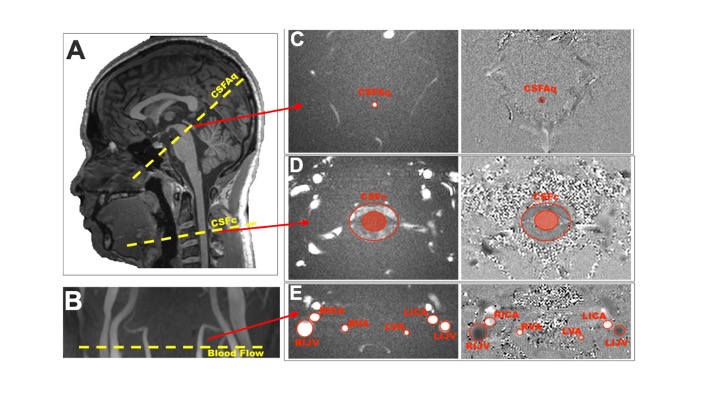
18 healthy volunteers (37.3±15.1 years old, 10 males) were recruited for technical development scans. MR images were acquired in a 3T scanner fitted with a 64 channels head-cervical coil. A retrospectively gated phase contrast (ReGa-PC) MRI sequence (TR=20.58ms, TE=6.12ms, FA=20, FOV matrix=0.7x0.7x0.4) was used to image CSF flow at the cervical (C2) level (CSFc; VENC=6cm/s) and CSF flow through the aqueduct of Sylvius (CSFAq; VENC=17cm/s; Fig.1A) and blood flow in the major neck arteries and veins: bilateral internal carotid (LICA and RICA) and bilateral vertebral arteries (LVA and RVA; VENC=60cm/s; Fig.1B). Positive phase direction was set for flow in the caudo-cranial direction. Each cardiac cycle was reconstructed from 128 timepoints/phases, greater than previous literature[4,8,9], using a distal pulse-oximeter. Flow measurements for each timepoint were extracted by hand-drawing regions of interest (ROIs) for each structure of interest (Fig.1C-E). A two-way ANOVA was used to address differences between arterial and venous blood and CSF flow with statistical threshold set at p<0.05. Pearson’s correlation was used to study the linear correlation between several combinations of measurements.Results and Discussion
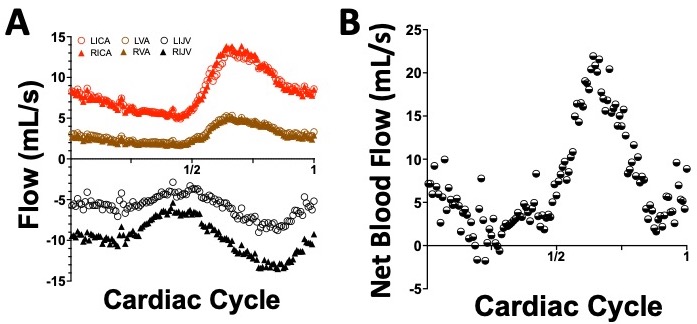
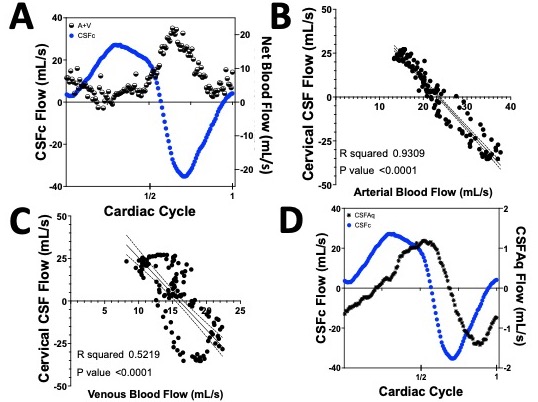
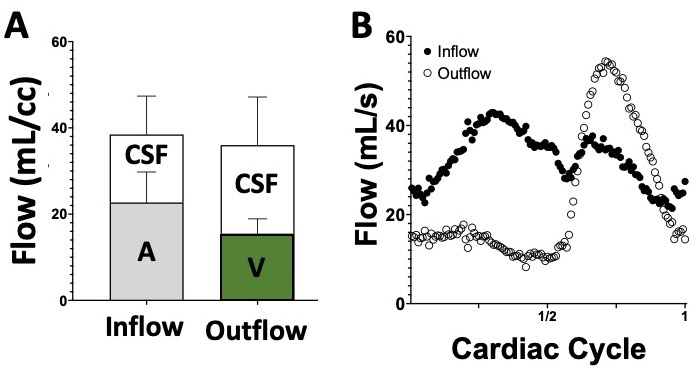
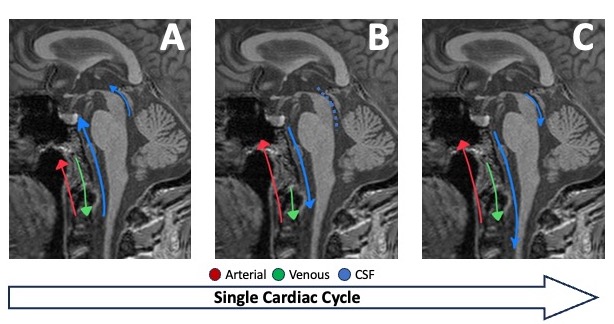
Blood flow measurements showed recognizable cardiac cycle changes in flow[10,11] (Fig.2A). Combining the total blood inflow (arterial) and outflow (venous) per timepoint we obtained a measure of net blood flow which peaked in the later stages of the cardiac cycle due to the sudden increase in arterial blood flow and a delay reaction in the increase of venous blood outflow (Fig.2B). A correlation between net blood and CSFc flow is evident by overlapping the two flow curves (Fig.3A), further supported by the negative linear correlation observed between CSFc and arterial blood flow (R2=0.93; p<0.0001; slope=-2.74;Fig.3B) as well as with venous blood flow (R2=0.52; p<0.0001; slope=-4.24; Fig.3C). This suggests that, in order to maintain appropriate pressure within the cranium, as net blood flow increases (caudo-cranial direction), CSFc flow increases in the opposite (cranio-caudal) direction, more closely following the changes in venous blood flow. Moreover, we observed that the waveform of CSFc flow matches the bidirectional CSF flow in the aqueduct although with an observable constant delay (Fig.3D). We hypothesize this is due to the distance between the cervical level(C2) and the aqueduct measurement locations. Nonetheless, this link represents a great potential to indirectly investigate the characteristics of the aqueduct of Sylvius. This structure is especially important since recent studies have observed alterations in aqueduct CSF flow in both aging[12] and neurological diseases [13,14], however, the findings are still under discussion.To better have a comprehensive picture of the whole brain hydrodynamics we separated the total inflow contributions by adding the mean arterial blood flow (22.7±7.1 mL/s) and CSF flow in the cranial direction (15.8±8.9 mL/s) from the total outflow contributions of total venous blood flow (-15.5±3.4 mL/s) and the CSF flow in the caudal direction (-20.5±11.2 mL/s;Fig.4A). An interactions difference was obtained (p<0.0001), suggesting that the contribution of CSF flow differs between inflow and outflow. However, by plotting the time course of such calculated parameters (Fig.4B), it is evident that the first part of the cardiac cycle is led by a greater total inflow and that the second phase is instead governed mainly by a larger total outflow. Further investigations are warranted to clarify whether these differences might translate to changes in intracranial pressure and potentially drive glymphatic activity. Representation of such hydrodynamic system, within one cardiac cycle, is represented in figure 5.
Conclusion
Our results provide a strong proof of the close dynamic interplay between cervical net blood and CSF flow, and showed a similarity in flow curve between cervical and interventricular CSF flow, providing a comprehensive picture of the brain hydrodynamics.Acknowledgements
This study was performed under the rubric of the Center for Advanced Imaging Innovation and Research (CAI2R, www.cai2r.net), an NIBIB National Center for Biomedical Imaging and Bioengineering (NIH P41 EB017183).References
1. Mestre, H., Tithof, J., Du, T., Song, W., Peng, W., Sweeney, A.M., Olveda, G., Thomas, J.H., Nedergaard, M. and Kelley, D.H., 2018. Flow of cerebrospinal fluid is driven by arterial pulsations and is reduced in hypertension. Nature communications, 9(1), p.4878.
2. Yang, H.C., Inglis, B., Talavage, T.M., Nair, V.V., Yao, J., Fitzgerald, B., Schwichtenberg, A.J. and Tong, Y., 2022. Coupling between cerebrovascular oscillations and CSF flow fluctuations during wakefulness: An fMRI study. Journal of Cerebral Blood Flow & Metabolism, 42(6), pp.1091-1103.
3. Eide, P.K., Valnes, L.M., Lindstrøm, E.K., Mardal, K.A. and Ringstad, G., 2021. Direction and magnitude of cerebrospinal fluid flow vary substantially across central nervous system diseases. Fluids and Barriers of the CNS, 18(1), pp.1-18.
4. Alperin, Noam, Sang H. Lee, Anusha Sivaramakrishnan, and Stephen G. Hushek. "Quantifying the effect of posture on intracranial physiology in humans by MRI flow studies." Journal of Magnetic Resonance Imaging: An Official Journal of the International Society for Magnetic Resonance in Medicine22, no.5 (2005): 591-596.
5. Laganà, M.M., Di Tella, S., Ferrari, F., Pelizzari, L., Cazzoli, M., Alperin, N., Jin, N., Zacà, D., Baselli, G. and Baglio, F., 2022. Blood and cerebrospinal fluid flow oscillations measured with real-time phase-contrast MRI: breathing mode matters. Fluids and Barriers of the CNS, 19(1), p.100.
6. Simon, M.J. and Iliff, J.J., 2016. Regulation of cerebrospinal fluid (CSF) flow in neurodegenerative, neurovascular and neuroinflammatory disease. Biochimica et Biophysica Acta (BBA)-Molecular Basis of Disease, 1862(3), pp.442-451.
7. Tuura, R.O.G., Volk, C., Callaghan, F., Jaramillo, V. and Huber, R., 2021. Sleep-related and diurnal effects on brain diffusivity and cerebrospinal fluid flow. NeuroImage, 241, p.118420.
8. Muccio, M., Chu, D., Minkoff, L., Kulkarni, N., Damadian, B., Damadian, R.V. and Ge, Y., 2021. Upright versus supine MRI: effects of body position on craniocervical CSF flow. Fluids and Barriers of the CNS, 18(1), pp.1-11.
9. ElSankari, S., Balédent, O., Van Pesch, V., Sindic, C., De Broqueville, Q. and Duprez, T., 2013. Concomitant analysis of arterial, venous, and CSF flows using phase-contrast MRI: a quantitative comparison between MS patients and healthy controls. Journal of Cerebral Blood Flow & Metabolism, 33(9), pp.1314-1321.
10. Balédent, O., Fin, L., Khuoy, L., Ambarki, K., Gauvin, A.C., Gondry‐Jouet, C. and Meyer, M.E., 2006. Brain hydrodynamics study by phase‐contrast magnetic resonance imaging and transcranial color doppler. Journal of Magnetic Resonance Imaging: An Official Journal of the International Society for Magnetic Resonance in Medicine, 24(5), pp.995-1004.
11. Tain, R.W., Ertl‐Wagner, B. and Alperin, N., 2009. Influence of the compliance of the neck arteries and veins on the measurement of intracranial volume change by phase‐contrast MRI. Journal of Magnetic Resonance Imaging: An Official Journal of the International Society for Magnetic Resonance in Medicine, 30(4), pp.878-883.
12. Eisma, J.J., McKnight, C.D., Hett, K., Elenberger, J., Song, A.K., Stark, A.J., Claassen, D.O. and Donahue, M.J., 2023. Choroid plexus perfusion and bulk cerebrospinal fluid flow across the adult lifespan. Journal of Cerebral Blood Flow & Metabolism, 43(2), pp.269-280.
13. Magnano, C., Schirda, C., Weinstock‐Guttman, B., Wack, D.S., Lindzen, E., Hojnacki, D., Bergsland, N., Kennedy, C., Belov, P., Dwyer, M.G. and Poloni, G.U., 2012. Cine cerebrospinal fluid imaging in multiple sclerosis. Journal of Magnetic Resonance Imaging, 36(4), pp.825-834.
14. Yin, L.K., Zheng, J.J., Zhao, L., Hao, X.Z., Zhang, X.X., Tian, J.Q., Zheng, K. and Yang, Y.M., 2017. Reversed aqueductal cerebrospinal fluid net flow in idiopathic normal pressure hydrocephalus. Acta Neurologica Scandinavica, 136(5), pp.434-439.
Figures