0980
Neuronal and Cerebrovascular Response to tDCS in Multiple Sclerosis: A Simultaneous tDCS-MRI Study1Bernard and Irene Schwartz Center for Biomedical Imaging, Department of Radiology, New York University Grossman School of Medicine, New York City, NY, United States, 2Center for Advanced Imaging Innovation and Research (CAI2R), Department of Radiology, New York University Grossman School of Medicine, New York City, NY, United States, 3Neurology, New York University Grossman School of Medicine, New York City, NY, United States, 4Research and Development, Soterix Medical Inc, Woodbridge Township, NJ, United States, 5Biomedical Engineering, City College of New York, New York City, NY, United States
Synopsis
Keywords: Multiple Sclerosis, Metabolism, cerebral metabolism, neural stimulation. blood flow
Motivation: The cerebral metabolic underpinnings of tDCS, both during the stimulation itself and as result of repeated sessions are still not fully understood.
Goal(s): To quantify the immediate tDCS effects (simultaneous) using real-time tDCS-MRI and treatment-related effects (cumulative after repeated sessions) in multiple sclerosis (MS) patients.
Approach: MS patients had tDCS-MRI performed at baseline and after 20 tDCS treatment sessions. Imaging measurements were acquired pre-, during- (2.0mA left frontal anodal) and post-tDCS.
Results: During tDCS, at baseline, we observed a 7.6% increase in cerebral metabolic rate of oxygen (CMRO2). tDCS-treatment induced a 9.6% increase of the pre-tDCS CMRO2 levels.
Impact: The significant increase in neuronal metabolism following both real-time and repeated tDCS treatment in MS patients offers valuable insights into the biophysiological mechanisms regarding acute and cumulative tDCS effects, informing future clinical applications in MS and other neurodegenerative diseases.
Introduction
Transcranial direct current stimulation (tDCS) is a safe and well-tolerated method which uses weak electrical currents to modulate cortical excitability[1]. TDCS studies of multiple sclerosis (MS) have shown clinical improvements in fatigue[2], motor function[3] and cognitive performance[4]. Recently, cumulative neuronal effects of repeated tDCS sessions have been observed in both healthy[5] and neurological disorders[6,7], with studies showing tDCS-induced cumulative effects that surpass what observed after a single tDCS session[8]. Although extensive research has been done focusing on the clinical outcomes of tDCS, neuronal metabolic response to the stimulation, an important measure of tDCS-induced neuronal activity change, has not been explored in MS. Recent advances in MRI enable cerebral metabolic rate of oxygen (CMRO2) to be rapidly and reliably quantified [9-11]. In this study, we investigated CMRO2 response to tDCS in MS to gain more in-depth understanding of the simultaneous (during tDCS) and cumulative (after repeated tDCS sessions) tDCS effects on neuronal metabolic response.Methods
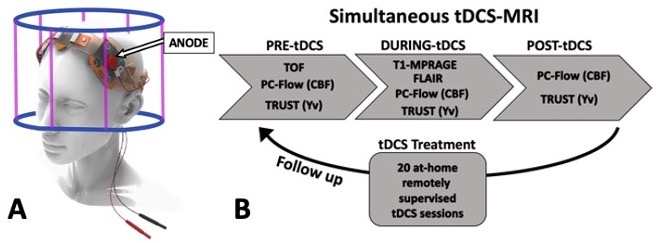
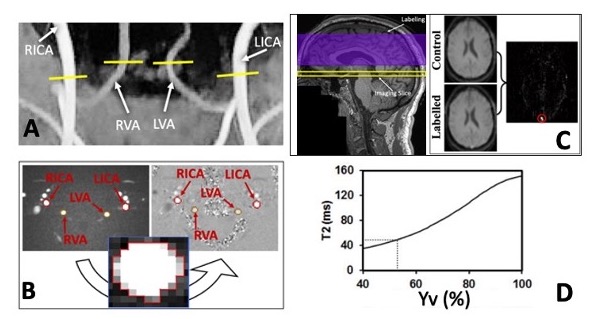
20 patients (age=45±13 years, 7 males) with MS diagnosis were recruited to participate in this simultaneous tDCS-MRI study. Stimulation was given via an MRI-compatible tDCS device (Soterix Medical) and consisted in a 15 minutes left anodal dorsolateral prefrontal cortex (DPFC, F3) direct current stimulation at 2.0mA (Fig.1A). The study included an initial tDCS-MRI baseline visit, followed by 20 at-home tDCS treatment sessions, and a follow-up tDCS-MRI visit. Each scanning visit consisted of three timepoints: pre-, during- and post-tDCS(Fig.1B). Imaging data was acquired in a 3T scanner fitted with a 64 channels head coil and comprised of the following sequences: phase contrast MRI (PC-MRI) to measure total blood influx through bilateral carotid and vertebral arteries (Fig.2A,B), subsequently normalized for subject-specific brain volumes, from a 3D-T1-MPRAGE, to obtain a global measure of cerebral blood flow (CBF) and a T2-Relaxation-Under-Spin-Tagging (TRUST)[10] was used to measure venous oxygenation (Yv) in the superior sagittal sinus, just above the venous confluence (Fig.2C,D). To investigate the tDCS-induced neuronal changes we calculated CMRO2 combining CBF and Yv measures, as reported previously[9,11]. Paired t-test was used to compare measurements of each imaging parameter amongst combination of the three timepoints as well as baseline vs follow-up.Results
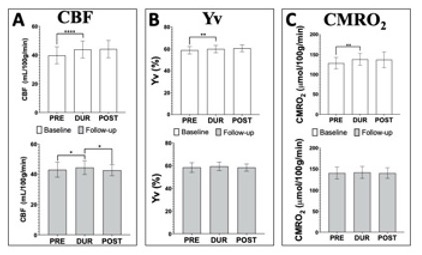
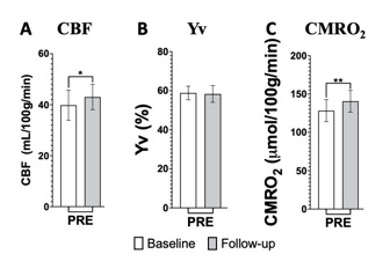
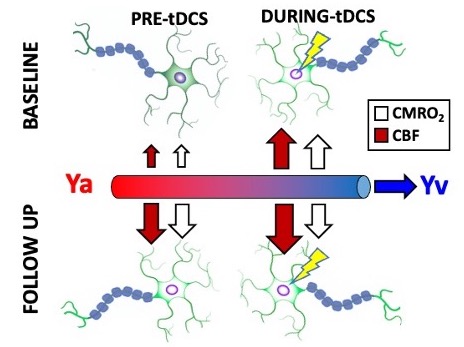
At baseline, global CBF increased from pre-tDCS (39.80±5.75 mL/100g/min) to during-tDCS (43.92±5.74 mL/100g/min; p<0.0001; Fig.3A). Yv exhibited a slight increase from pre-tDCS (58.83±3.39%) to during-tDCS (59.93±3.34%; p=0.006; Fig.3B). CMRO2 showed a notable 7.6% increase from pre-tDCS (128.30±14.00 µmol/100g/min) to during-tDCS (137.77±14.17 µmol/100g/min; p=0.002; Fig.3C). Across all parameters, at baseline, post-tDCS results remained elevated. At follow-up, after tDCS treatment, different tDCS simultaneous effects were observed. Just as similar to baseline measurements, CBF was higher during-tDCS (44.44±4.41 mL/100g/min) compared to pre-tDCS (43.02±4.85 mL/100g/min; p=0.014). Notably, there was a significant decrease of CBF in post-tDCS (42.70±3.52 mL/100g/min; p=0.031; Fig.3A). In contrast, both Yv and CMRO2 remained stable throughout the follow-up scan, with no significant changes observed (~58% and ~14 µmol/100g/min respectively; Fig.3B,C). Cumulative effects analysis showed increased CBF and CMRO2 pre-tDCS levels, before re-applying the stimulation, from baseline to follow-up (p=0.048 and p=0.006 respectively), while no such change was observed in Yv (Fig.4A-C). The overall mechanics are represented in figure 5.Discussion
During the initial tDCS-MRI visit, we observed a significant immediate increase in CBF during the stimulation, which notably exceeded the increase observed in Yv (11.0% CBF vs 1.9% Yv). This suggests that the stimulated neurons quickly utilized most of the surplus oxygen, leading to the observed increase in CMRO2 (7.6%). This aligns with the current understanding that anodal tDCS enhances neuronal firing by further depolarization of the neuronal membrane[12,13]. Regarding the cumulative effects, MS patients exhibited a ~10% increase in pre-tDCS levels for both CBF and CMRO2, from baseline to follow-up. This suggests that repeated tDCS sessions may lead to prolonged elevation of neuronal activity in these patients. Notably, the absence of further simultaneous changes at follow-up indicates a potential plateau in stimulation effectiveness. Interestingly, tDCS effects persisted after the stimulation was removed (post-tDCS) in both visits, as noted in other studies [14,15]. This suggests that the stimulation-induced neuronal excitation does not quickly dissipate in MS subjects, offering valuable insights into predicting response to tDCS treatment.Conclusion
In summary, our study showed that tDCS leads to immediate increases in cerebrovascular supply and neuronal activity in MS patients. Notably, these effects do not rapidly dissipate after stimulation cessation but instead tend to persist or linger. Importantly, our findings suggest that tDCS has cumulative properties, with repeated exposure (treatment) having long-lasting effects on the neuronal metabolic activity observed in MS patients.Acknowledgements
This study was funded by National Institute of Health (NIH/NICHD: R21 HD094424) and was performed under the rubric of the Center for Advanced Imaging Innovation and Research (CAI2R, www.cai2r.net), an NIBIB National Center for Biomedical Imaging and Bioengineering (NIH P41 EB017183).References
1. Bikson, M., Grossman, P., Thomas, C., Zannou, A.L., Jiang, J., Adnan, T., Mourdoukoutas, A.P., Kronberg, G., Truong, D., Boggio, P. and Brunoni, A.R., 2016. Safety of transcranial direct current stimulation: evidence based update 2016. Brain stimulation, 9(5), pp.641-661.
2. Charvet, L.E., Dobbs, B., Shaw, M.T., Bikson, M., Datta, A. and Krupp, L.B., 2018. Remotely supervised transcranial direct current stimulation for the treatment of fatigue in multiple sclerosis: results from a randomized, sham-controlled trial. Multiple Sclerosis Journal, 24(13), pp.1760-1769.
3. Pilloni, G., Choi, C., Shaw, M.T., Coghe, G., Krupp, L., Moffat, M., Cocco, E., Pau, M. and Charvet, L., 2020. Walking in multiple sclerosis improves with tDCS: a randomized, double‐blind, sham‐controlled study. Annals of Clinical and Translational Neurology, 7(11), pp.2310-2319.
4. Simani, L., Roozbeh, M., Shojaei, M., Ramezani, M., Roozbeh, M., Gharehgozli, K. and Rostami, M., 2022. The effectiveness of anodal tDCS and cognitive training on cognitive functions in multiple sclerosis; a randomized, double-blind, parallel-group study. Multiple Sclerosis and Related Disorders, 68, p.104392.
5. Alonzo, A., Brassil, J., Taylor, J.L., Martin, D. and Loo, C.K., 2012. Daily transcranial direct current stimulation (tDCS) leads to greater increases in cortical excitability than second daily transcranial direct current stimulation. Brain stimulation, 5(3), pp.208-213.
6. Im, J.J., Jeong, H., Bikson, M., Woods, A.J., Unal, G., Oh, J.K., Na, S., Park, J.S., Knotkova, H., Song, I.U. and Chung, Y.A., 2019. Effects of 6-month at-home transcranial direct current stimulation on cognition and cerebral glucose metabolism in Alzheimer's disease. Brain stimulation, 12(5), pp.1222-1228.
7. Ulam, F., Shelton, C., Richards, L., Davis, L., Hunter, B., Fregni, F. and Higgins, K., 2015. Cumulative effects of transcranial direct current stimulation on EEG oscillations and attention/working memory during subacute neurorehabilitation of traumatic brain injury. Clinical Neurophysiology, 126(3), pp.486-496.
8. Alonzo, A., Brassil, J., Taylor, J.L., Martin, D. and Loo, C.K., 2012. Daily transcranial direct current stimulation (tDCS) leads to greater increases in cortical excitability than second daily transcranial direct current stimulation. Brain stimulation, 5(3), pp.208-213.
9. Muccio, M., Masters, L.W., Pilloni, G., He, P., Krupp, L., Datta, A., Bikson, M., Charvet, L. and Ge, Y., 2022. Cerebral metabolic rate of oxygen (CMRO2) changes measured with simultaneous tDCS-MRI in healthy adults. Brain Research, 1796, p.148097.
10. Lu, H. and Ge, Y., 2008. Quantitative evaluation of oxygenation in venous vessels using T2‐relaxation‐under‐spin‐tagging MRI. Magnetic Resonance in Medicine: An Official Journal of the International Society for Magnetic Resonance in Medicine, 60(2), pp.357-363.
11. Xu, F., Ge, Y. and Lu, H., 2009. Noninvasive quantification of whole‐brain cerebral metabolic rate of oxygen (CMRO2) by MRI. Magnetic Resonance in Medicine: An Official Journal of the International Society for Magnetic Resonance in Medicine, 62(1), pp.141-148.
12. Jamil, A. and Nitsche, M.A., 2017. What effect does tDCS have on the brain? Basic physiology of tDCS. Current Behavioral Neuroscience Reports, 4, pp.331-340.
13. Nitsche, M.A. and Paulus, W., 2000. Excitability changes induced in the human motor cortex by weak transcranial direct current stimulation. The Journal of physiology, 527(Pt 3), p.633.
14. Chan, M.M., Yau, S.S. and Han, Y.M., 2021. The neurobiology of prefrontal transcranial direct current stimulation (tDCS) in promoting brain plasticity: A systematic review and meta-analyses of human and rodent studies. Neuroscience & Biobehavioral Reviews, 125, pp.392-416.
15. Zappasodi, F., Musumeci, G., Navarra, R., Di Lazzaro, V., Caulo, M. and Uncini, A., 2018. Safety and effects on motor cortex excitability of five cathodal transcranial direct current stimulation sessions in 25 hours. Neurophysiologie Clinique, 48(2), pp.77-87
Figures