0979
Identifying Multiple Sclerosis Lesion Subtypes with Distinct Microstructural Features using Advanced Microstructural MRI1Department of Radiology and Radiological Science, Johns Hopkins University School of Medicine, Baltimore, MD, United States, 2F.M. Kirby Research Center for Functional Brain Imaging, Kennedy Krieger Research Institute, Baltimore, MD, United States, 3Department of Neurology, Johns Hopkins University School of Medicine, Baltimore, MD, United States, 4Department of Electrical and Computer Engineering, Johns Hopkins University, Baltimore, MD, United States, 5Department of Medical Radiation Physics, Clinical Sciences Lund, Lund University, Lund, Sweden
Synopsis
Keywords: Multiple Sclerosis, Multiple Sclerosis
Motivation: Conventional MRI struggles to capture heterogeneous histopathological subtypes within multiple sclerosis (MS) lesions, mainly due to a lack of microstructural specificity.
Goal(s): (i) To unveil distinct subtypes of microstructural alteration MS lesions using advanced multi-contrast microstructural MRI; (ii) increase sensitivity to individual microstructure.
Approach: K-means clustering was applied to multi-contrast microstructural MRI quantities, including parameters from diffusometry (μFA [axonal integrity marker], MD), susceptometry (QSM, 𝜒dia [demyelination marker] 𝜒para [marker for iron-laden microglia]), and relaxometry (R2*, R2, T1).
Results: Five MRI-driven lesion subtypes, each with unique microstructural property combinations, revealed potential histopathological features of MS lesions and showed enhanced sensitivities to clinical outcomes.
Impact: We used a novel imaging multi-biomarker for in-vivo MS pathology to assess lesion types for potential treatment monitoring in MS. Some MS subtypes with microstructure alterations, potentially related to disease histopathology, showed improved clinical sensitivity over conventional imaging markers.
Introduction
In people with multiple sclerosis (pwMS), T2-FLAIR hyperintense (T2H) lesions have represented focal inflammation in brain. However, the T2H contrast may be a consequence of multiple underlying microstructure-level alterations, e.g., axonal loss, demyelination, and gliosis. Recent advances in microstructural MRI (microMRI) methods, including tensor-valued diffusion MRI (tdMRI)1 and magnetic susceptibility source-separation (chi-separation)2, may offer better insight into these changes by quantifying individual microstructure (e.g. white matter integrity [predominantly by axon integrity3] measured by microscopic-fractional anisotropy [μFA] in tdMRI1,4; myelin and iron-laden microglia separately assessed by diamagnetic [𝜒dia] and paramagnetic [𝜒para] signal in chi-separation5). These techniques have linked MRI parameters to individual histopathological alterations unattainable with conventional methods (μFA vs. FA6; 𝜒dia/𝜒para vs. QSM2,7).This study aims to leverage these advanced MRI techniques, with unsupervised machine learning, to uncover pathological subtypes within MS lesions and their clinical implications.Methods
[Data Acquisition] 33 pwMS (50±11y/o; 12M/21F) and 5 healthy controls (HC; 47±11y/o; 2M/3F) underwent brain MRI at 3T (Philips Ingenia-Elition-RX; IRB approved with informed consent), including FLAIR/MP2RAGE/multi-shell diffusion MRI (msdMRI)/tdMRI/chi-separation (multi-echo gradient-echo [MEGE], multi-echo turbo-spin-echo [METSE]) with the following parameters: [tdMRI]linear/planar/spherical tensor-valued encoding with optimized gradient waveforms6,8, resolution=1.6-mm-isotropic, max b-value = 2000s/mm2; [MEGE]resolution=1-mm-isotropic, TR/TE=40/{5.5,11.5,16.5,21.5,26.5}ms, [METSE]resolution=1x1x2 mm3, TR/TE=7000/{20,40,60,80}ms. Clinical assessments included Expanded-Disability-Status-Scale (EDSS), Timed-25-Foot-Walk (T25FW), 9-Hole-Peg-Test (9HPT), Symbol-Digit-Modality-Test (SDMT), Low-Contrast-Visual-Acuity (LCVA). The former three correlate positively with clinical progression, while the latter two have negative relationships.[Processing] DWI from tdMRI and msdMRI were preprocessed to compensate for noise, signal drift, Gibbs-ringing, motion, and distortion9–13, mapping μFA14 from tdMRI and MD, FA, and orientation distribution function (ODF) from msdMRI. For chi-separation, R2* and frequency shift mapping from MEGE and R2 from METSE were used to reconstruct 𝜒dia and 𝜒para maps2. QSM was calculated using iLSQR15 with CSF reference16.
[Unsupervised lesion clustering] T2H lesions were segmented using a domain-adaptable network17. K-means clustering of HC-normalized multi-contrast MRI parameters from diffusometry (μFA/MD), susceptometry (QSM/𝜒dia/𝜒para), and relaxometry (R2*/R2/T1) was performed in T2H lesions (Fig.1; k determined by fraction of variance explained=0.90). Subsequently, mean and STD of microMRI parameters were evaluated within each subtype and the subtype-to-whole brain volume fraction.
[ROI analysis] For comparison, normal white matter (WM) in HC was segmented at the location of composite MS lesions in template space. Crossing fiber areas were defined as voxels with 2nd ODF peak larger than 50% of 1st peak18. Pearson partial correlation with clinical assessments was evaluated for each subtype volume fraction and subtype-wise quantitative MRI parameters, adjusting for age, MS type (relapsing-and-remitting or progressive), disease duration.
Results
Fig.2 shows the difference between μFA and FA maps in MS lesions, demonstrating the orientation dispersion effect on FA, apparent in crossing fiber regions (Fig.2A). ROI analysis reveals significantly lower power of FA compared to μFA when differentiating normal WM vs. MS lesion in crossing fibers (Fig.2B).The k-means algorithm identified 5 lesion subtypes, each with significantly different (p<0.001) microstructure alteration when juxtaposed against normal WM of HC (TYPE1: 𝜒para higher [↑] and μFA lower than HC [↓]; TYPE2: both 𝜒dia and μFA ↓; TYPE3: only μFA ↓; TYPE4: both 𝜒dia and μFA ↓ (with small effect size in μFA); TYPE5: 𝜒dia ↑). Based on these differences, we classified their potential distinct pathology as follows: TYPE1: iron-abundant; TYPE2: both axon integrity/myelin loss; TYPE3: axonal loss-dominant; TYPE4: myelin loss-dominant; TYPE5: nearly-normal. Clinically, pwMS with a large population of TYPE1 and TYPE2 lesions suggesting severe tissue damage show the tendency for severe clinical outcomes, while TYPE5-dominant cases have milder manifestation (Fig.3). Adjusted partial correlation further emphasizes these clinical implications. TYPE1 and 2 significantly correlate with more clinical assessments (Fig.4). Notably, TYPE5 showed no correlations, as suggested by its microMRI signature.
Our data also revealed that changes in μFA, 𝜒dia, and 𝜒para within each subtype were quantitatively associated with clinical assessments (p<0.05), showing unique sensitivities to different clinical aspects (Fig.5). No correlations were found for conventional methods (FA/QSM), except for FA-SDMT association in T2HL. More clinical associations of MR parameters for TYPE5 rather than TYPE1 or TYPE2 may be explained by small subject-wise variation in the subtypes where the microstructural alterations almost saturated (e.g., TYPE2 with fully demyelinated tissue).
Conclusion/Discussion
This study identified MS lesion subtypes with unique microstructural changes and clinical relevance by leveraging multi-contrast microMRI. Certain MRI-driven subtypes, especially reflecting histopathological deviation such as iron accumulation or extensive axonal/myelin damage, presented stronger clinical correlations than generic T2H lesions. This highlights the potential of quantitative microstructural MRI parameters as better imaging markers to elucidate MS pathology and assess therapeutic effects. Future study may include investigation on the partial volume effects in clustering.Acknowledgements
* Shiv Saidha has received consulting fees from Medical Logix for the development of CME programs in neurology and has served on scientific advisory boards for Biogen, Novartis, Genentech Corporation, TG therapeutics, Rewind therapeutics & Bristol Myers Squibb. He has performed consulting for Novartis, Genentech Corporation, JuneBrain LLC, and Lapix therapeutics. He is the PI of investigator-initiated studies funded by Genentech Corporation, Novartis, and Biogen. He previously received support from the Race to Erase MS foundation. He has received equity compensation for consulting from JuneBrain LLC and Lapix therapeutics. He was also the site investigator of trials sponsored by MedDay Pharmaceuticals, Clene Pharmaceuticals, and is the site investigator of a trial sponsored by Novartis. Peter van Zijl has research support from and technology licensed to Philips Healthcare and has also been a paid speaker. Filip Szczepankiewicz is an inventor on patents related to the study, and he has financial interests in the company Random Walk Imaging AB.
Peter Calabresi is PI on grants from the Myelin Repair Foundation and Genentech and and has received consulting fees from Lilly, Idorsia, Efflux, and Novartis.
References
1. Westin CF, Szczepankiewicz F, Pasternak O, et al. Medical Image Computing and Computer-Assisted Intervention – MICCAI 2014, 17th International Conference, Boston, MA, USA, September 14-18, 2014, Proceedings, Part III. Lect Notes Comput Sci. 2014;17(Pt 3):209-216. doi:10.1007/978-3-319-10443-0_27
2. Shin HG, Lee J, Yun YH, et al. χ-separation: Magnetic susceptibility source separation toward iron and myelin mapping in the brain. NeuroImage. 2021;240:118371. doi:10.1016/j.neuroimage.2021.118371
3. Beaulieu C. The basis of anisotropic water diffusion in the nervous system – a technical review. NMR Biomed. 2002;15(7‐8):435-455. doi:10.1002/nbm.782
4. Yang G, Tian Q, Leuze C, Wintermark M, McNab JA. Double diffusion encoding MRI for the clinic. Magn Reson Med. 2018;80(2):507-520. doi:10.1002/mrm.27043
5. Kim W, Shin HG, Lee H, et al. χ-Separation Imaging for Diagnosis of Multiple Sclerosis versus Neuromyelitis Optica Spectrum Disorder. Radiology. 2022:220941. doi:10.1148/radiol.220941
6. Szczepankiewicz F, Lasič S, Westen D van, et al. Quantification of microscopic diffusion anisotropy disentangles effects of orientation dispersion from microstructure: Applications in healthy volunteers and in brain tumors. Neuroimage. 2015;104:241-252. doi:10.1016/j.neuroimage.2014.09.057
7. Wang Y, Liu T. Quantitative susceptibility mapping (QSM): Decoding MRI data for a tissue magnetic biomarker. Magnet Reson Med. 2015;73(1):82 101. doi:10.1002/mrm.25358
8. Szczepankiewicz F, Westin CF, Nilsson M. Maxwell-compensated design of asymmetric gradient waveforms for tensor-valued diffusion encoding. Magn Reson Med. 2019;82(4):1424-1437. doi:10.1002/mrm.27828
9. Tournier JD, Smith R, Raffelt D, et al. MRtrix3: A fast, flexible and open software framework for medical image processing and visualisation. Neuroimage. 2019;202:116137. doi:10.1016/j.neuroimage.2019.116137
10. Veraart J, Novikov DS, Christiaens D, Ades-aron B, Sijbers J, Fieremans E. Denoising of diffusion MRI using random matrix theory. Neuroimage. 2016;142:394-406. doi:10.1016/j.neuroimage.2016.08.016
11. Veraart J, Fieremans E, Novikov DS. Diffusion MRI noise mapping using random matrix theory. Magn Reson Med. 2016;76(5):1582-1593. doi:10.1002/mrm.26059
12. Smith SM, Jenkinson M, Woolrich MW, et al. Advances in functional and structural MR image analysis and implementation as FSL. Neuroimage. 2004;23:S208-S219. doi:10.1016/j.neuroimage.2004.07.051
13. Andersson JLR, Skare S, Ashburner J. How to correct susceptibility distortions in spin-echo echo-planar images: application to diffusion tensor imaging. Neuroimage. 2003;20(2):870-888. doi:10.1016/s1053-8119(03)00336-7
14. Nilsson M, Szczepankiewicz F, Lampinen B, et al. An open-source framework for analysis of multidimensional diffusion MRI data implemented in MATLAB. ISMRM. 2018.
15. Li W, Wang N, Yu F, et al. A method for estimating and removing streaking artifacts in quantitative susceptibility mapping. Neuroimage. 2015;108(NeuroImage 88 2014):111 122. doi:10.1016/j.neuroimage.2014.12.043
16. Liu Z, Spincemaille P, Yao Y, Zhang Y, Wang Y. MEDI+0: Morphology enabled dipole inversion with automatic uniform cerebrospinal fluid zero reference for quantitative susceptibility mapping. Magnet Reson Med. 2018;79(5):2795 2803. doi:10.1002/mrm.26946
17. Zhang J, Zuo L, Dewey BE, et al. Harmonization-enriched domain adaptation with light fine-tuning for multiple sclerosis lesion segmentation. arXiv. 2023. doi:10.48550/arxiv.2310.20586
18. Sibgatulin R, Güllmar D, Deistung A, Ropele S, Reichenbach JR. In vivo assessment of anisotropy of apparent magnetic susceptibility in white matter from a single orientation acquisition. NeuroImage. 2021;241:118442. doi:10.1016/j.neuroimage.2021.118442Figures
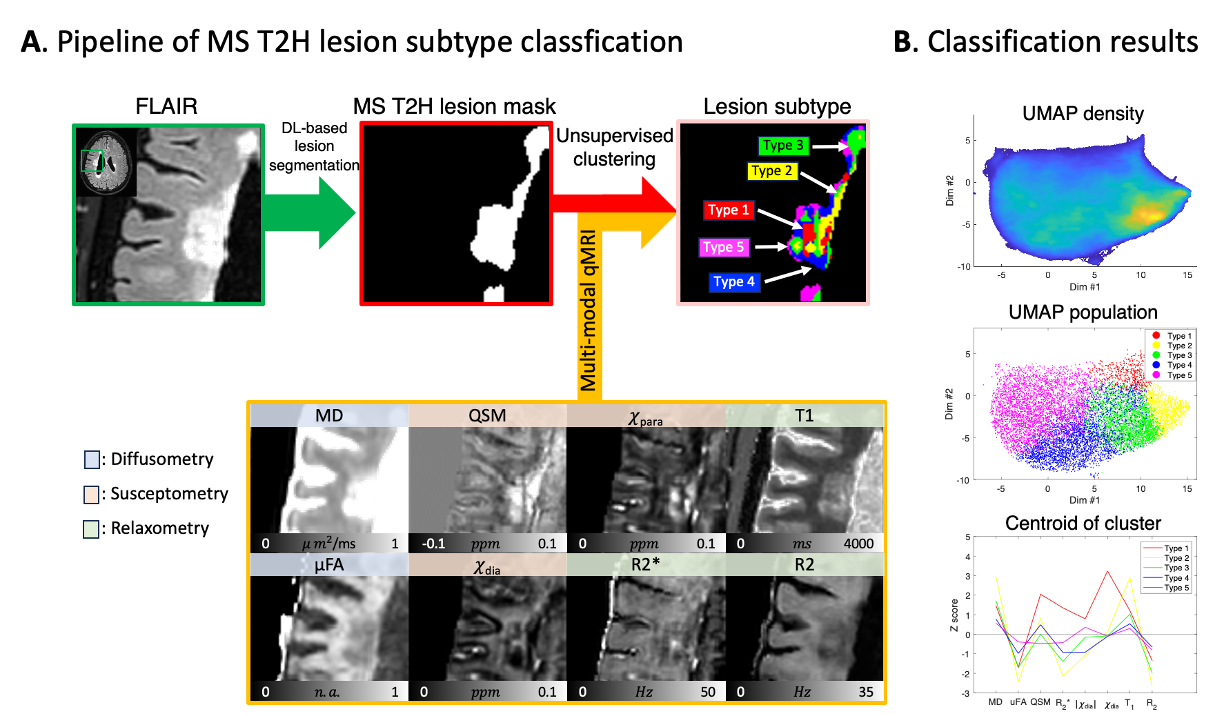
Fig. 1. (A) Workflow diagram illustrating the unsupervised classification of lesion subtypes based on multi-contrast MRI parameters, encompassing diffusometry (MD and μFA), susceptometry (QSM, 𝜒dia, 𝜒para), and relaxometry (R2*, T1, R2). (B) Visualization of lesion subtypes UMAP distribution and centroid derived from k-means clustering. Subtypes are arranged in ascending order based on population (i.e., TYPE5 is the most abundant).
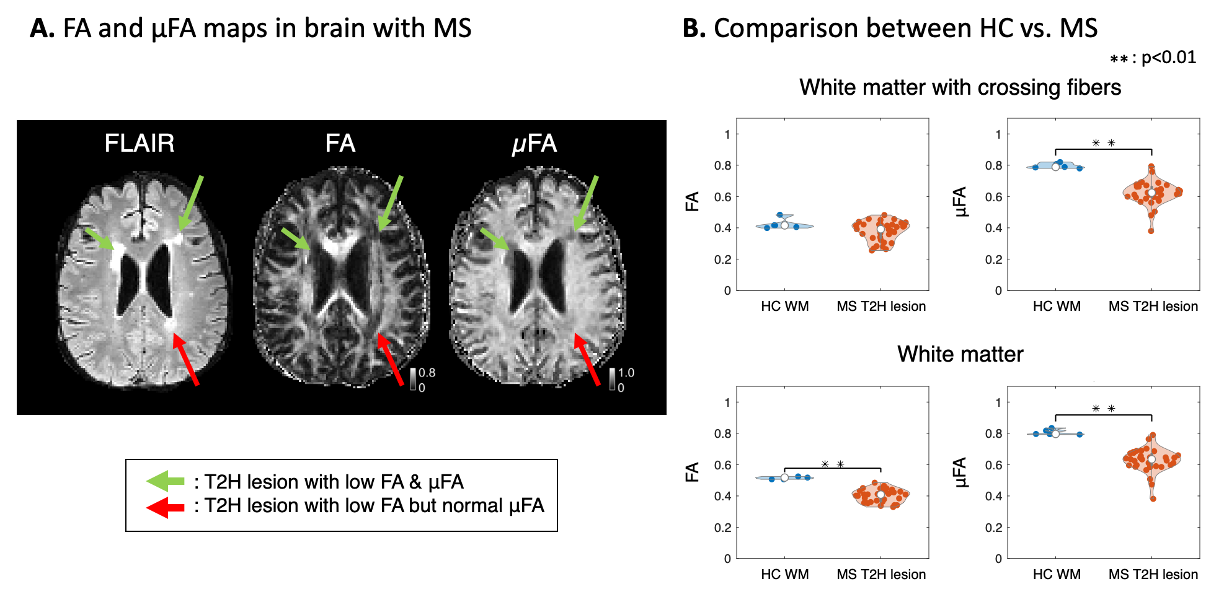
Fig 2. (A) FA and μFA images in MS lesions. FA signal is hypointense in lesions but also in crossing fiber (CrF) areas, complicating their identification (red arrows). Conversely, μFA displays lesion-localized hypointensity (green arrows), while maintaining consistent intensity across white matter, irrespective of CrF. (B) Comparison between FA vs. μFA values when differentiating HC WM vs. MS lesions. μFA shows a significant difference between HC WM and MS lesion (p<0.01) in both CrF regions and WM, while FA only reports such significant differentiation in WM, but not in CrF regions.
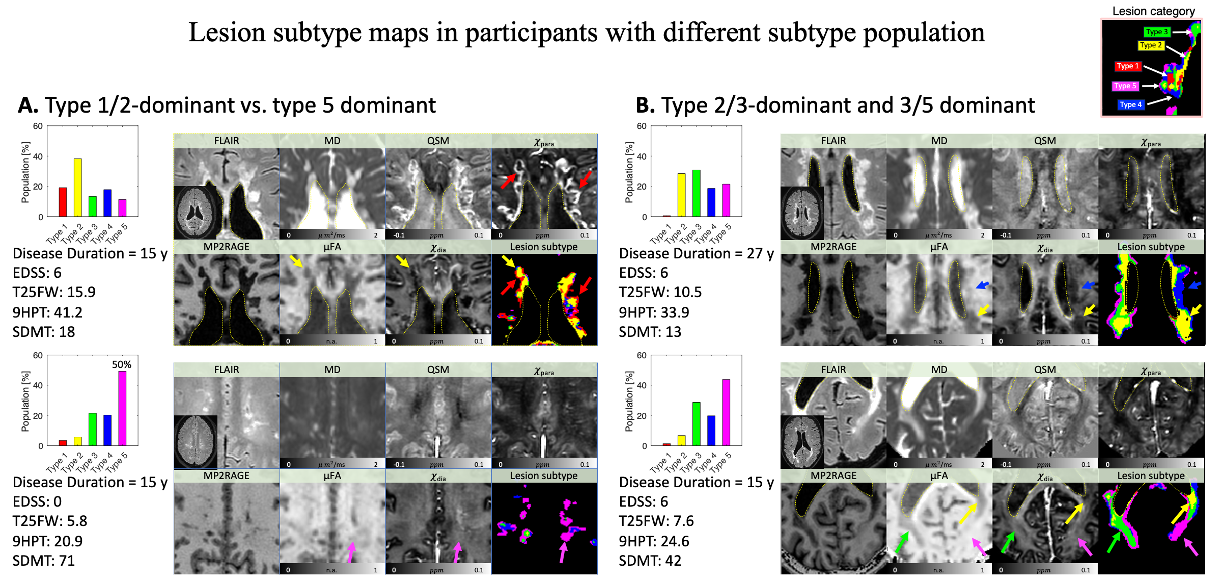
Fig 3. Multi-contrast MRI and classified lesion subtype map in pwMS with different subtype populations. Distribution of subtype populations in each pwMS and their clinical assessments are displayed. (A) pwMS with distinct subtype distributions (TYPE1/2-dominant vs. TYPE5-dominant) show distinct microstructure alterations in T2H lesions, as expected from their centroid profile. (B) μFA and 𝜒dia contrasts from TYPE2/3-dominant and 3/5-dominant pwMS show classification of TYPE2-4 (TYPE2: loss in both axon and myelin; TYPE3: axon loss-dominant; TYPE4: myelin loss-dominant)
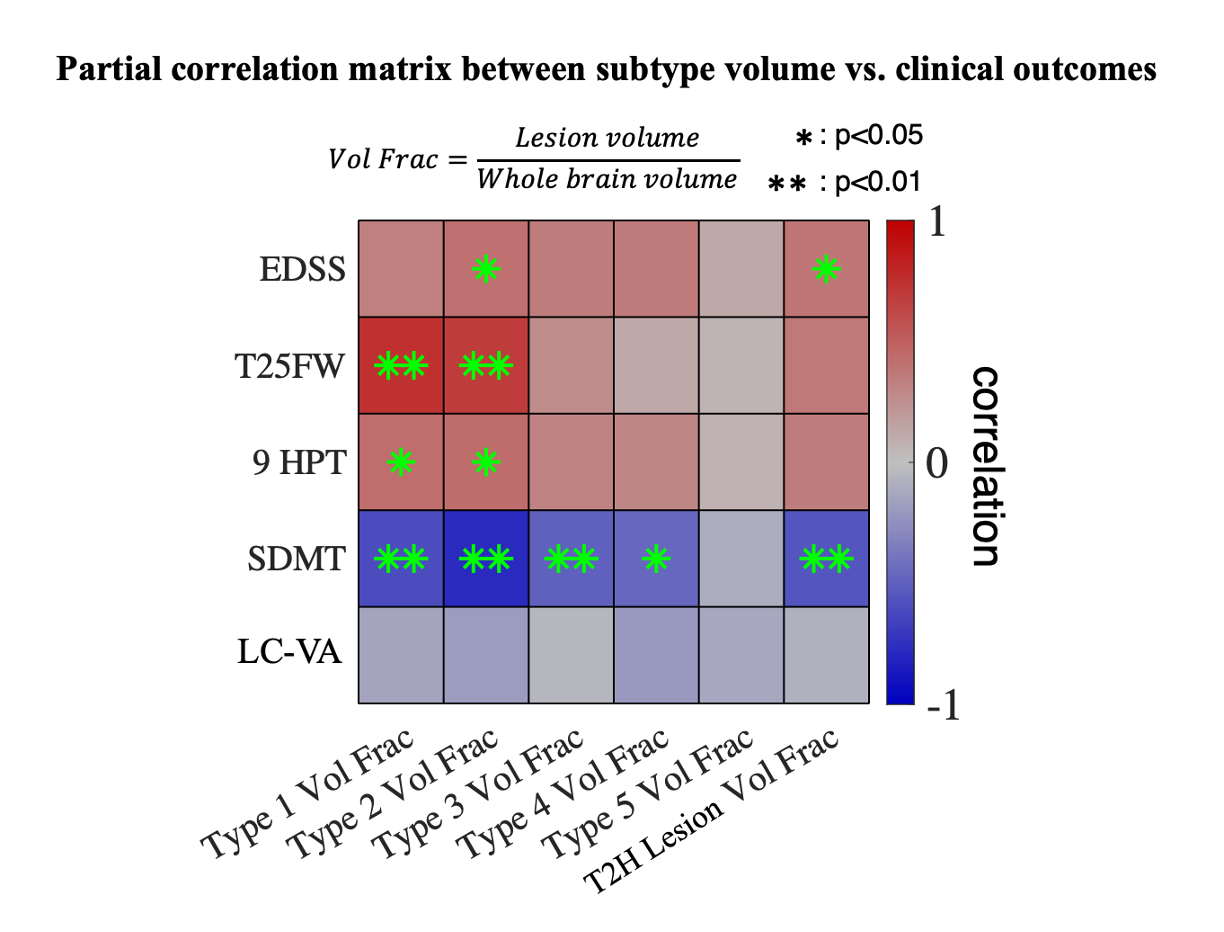
Fig 4. Partial correlation matrix between clinical assessments and lesion subtype volume fraction (normalized by whole brain volume), after adjusting age, MS type, and disease duration. Compared to conventional T2H lesion on FLAIR, TYPE 1 (iron-abundant) and 2 (characterized by both axon and myelin loss) show enhanced clinical correlation in EDSS, T25FW, and 9HPT, while TYPE 3 (axon loss-dominant) and TYPE4 (myelin loss-dominant) shows clinical sensitivity, comparable to T2H lesions. In TYPE5 (subtle changes compared to HC WM), no clinical correlations are found.
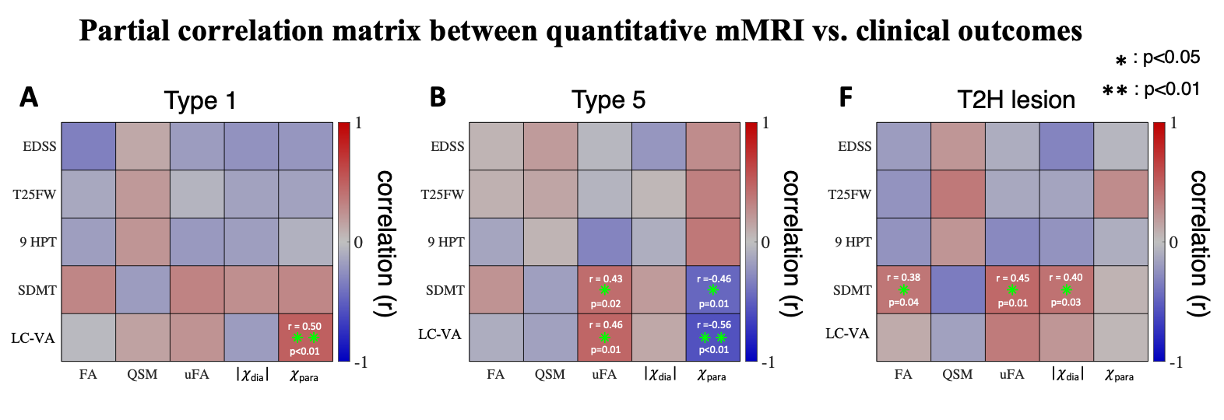
Fig 3. Multi-contrast MRI and classified lesion subtype maps in pwMS with different subtype populations. Distribution of subtype populations in each pwMS and their clinical assessments are displayed. (A) pwMS with distinct subtype distributions (TYPE1/2-dominant vs. TYPE5-dominant) show distinct microstructure alterations in T2H lesions, as expected from their centroid profile. (B) μFA and 𝜒dia contrasts from TYPE2/3-dominant and 3/5-dominant pwMS show classification of TYPE2-4 (TYPE2: loss in both axon and myelin; TYPE3: axon loss-dominant; TYPE4: myelin loss-dominant)