0978
Fatigue, smell and cognitive functions: multimodal MRI can explain the long-COVID syndrome1Department of Brain and Behavioral Sciences, University of Pavia, Pavia, Italy, 2NMR Research Unit, Queen Square MS Centre, Department of Neuroinflammation, UCL Queen Square Institute of Neurology, Faculty of Brain Sciences, University College London, London, United Kingdom, 3Dept of Neuroinflammation, UCL Queen Square Institute of Neurology and National Hospital for Neurology and Neurosurgery, London, United Kingdom, 4Department of Medical Physics and Biomedical Engineering, Centre for Medical Image Computing (CMIC), University College London, London, United Kingdom, 5E-Health Center, Universitat Oberta de Catalunya, Barcelona, Spain, 6Department of Clinical and Experimental Epilepsy, UCL Queen Square Institute of Neurology, Faculty of Brain Sciences, University College London, London, United Kingdom, 7Department of Medical Physics and Biomedical Engineering, University College London, London, United Kingdom, 8Radiomics Group, Vall d’Hebron Institute of Oncology, Vall d’Hebron Barcelona Hospital Campus, Barcelona, Spain, 9National Institute of Health Research, Biomedical Research Centre at UCLH and UCL, London, United Kingdom, 10Centre for Obesity Research, Department of Medicine, University College London, London, United Kingdom, 11National Institute of Health Research, UCLH Biomedical Research Centre, London, United Kingdom, 12Digital Neuroscience Centre, IRCCS Mondino Foundation, Pavia, Italy, 13Neurology-Neuroimmunology Department Multiple Sclerosis Centre of Catalonia (Cemcat), Vall d’Hebron Barcelona Hospital Campus, Barcelona, Spain
Synopsis
Keywords: Data Processing, COVID-19, statistical models, clinical scores, fatigue, anosmia, cognitive impairment, multimodal qMRI
Motivation: Long-COVID is a disabling health problem caused by SARS-COV-2 syndrome, whose underlying biological mechanisms are still debated.
Goal(s): This study aimed at finding the set of quantitative MRI (qMRI) metrics that best correlate with fatigue, smell (i.e. anosmia),and cognitive dysfunction, common in this condition.
Approach: People with COVID19 history with and without long-COVID were assessed through a multimodal one-hour-long qMRI protocol and underwent clinical evaluation.
Results: Correlation analyses between qMRI metrics and clinical scores showed that neurite density index changes explain both fatigue and smell function (also affected by changes in brain stem volume),while mean diffusivity and magnetic susceptibility changes explain cognitive function.
Impact: This work sheds light on the underlying biological mechanisms of long-COVID (anosmia, fatigue, and cognitive impairment). Metrics sensitive to microstructure, inflammation and possible iron accumulation best explain persistent symptoms, emphasizing the role of multimodal qMRI in the clinic.
INTRODUCTION
Long-COVID syndrome1 is observed in approximately 36% of people who develop COVID-19 after being infected by the SARS-COV-2 virus, a figure which is considered to be a conservative underestimate2. Persistent anosmia, cognitive impairment, and fatigue are the main neurological symptoms associated with Long-COVID syndrome, with the underlying biological mechanisms of these symptoms still unclear, hampering treatment strategies. Advanced multimodal quantitative MRI (qMRI) protocols3, combined with clinical/paraclinical assessments, can permit investigation of the mechanisms that may underly these symptoms.Given that brain alterations are known to occur in some cases after SARS-COV-2 infection4-7, a rich qMRI protocol was acquired, enabling the calculation of biophysically meaningful features that can be used to test specific mechanistic hypotheses on the neuropathological substrates underlying long-COVID.
Our protocol was applied to people who suffered from COVID-19, some clinically diagnosed with long-COVID and some who did not experience prolonged symptoms. The aim of this study was to identify the best qMRI correlates of long-COVID symptoms.
METHODS
Subjects & AcquisitionA total of 98 subjects were assessed: 41 subjects who suffered from COVID-19 (COVID) (32 females; 38±11y) and 57 subjects who were referred to the study from the long-COVID clinic (Long COVID) (39 females; 47±13y). Most of them underwent UPSIT8, SDMT9 (the higher the scores, the better smell and cognitive function) and MFIS10(the higher the score, the worse the fatigue) assessments (Figure 1).
The rich multimodal qMRI protocol3 was acquired using a 3T Philips Ingenia CX scanner with a 32-channel head coil. Data were collected as part of a project investigating qMRI in long-COVID3-6 with a unified Echo-Planar-Imaging approach including: multi-shell diffusion weighted imaging (DWI), inversion recovery (IR) with B1-mapping and quantitative magnetization transfer (qMT) imaging. 3D Fluid Attenuation Inversion Recovery (3D-FLAIR), isotropic 3DT1, multi-echo spoilt gradient echo (SPGR) and brainstem spectroscopy data were also acquired.
Data processing
DWI, IR, qMT and B1-DAM scans underwent unified pre-processing involving noise, susceptibility distortion, and eddy-current correction11.
Diffusion metrics were obtained by fitting data with the Neurite Orientation Dispersion and Density Imaging (NODDI) model and Diffusion Tensor Imaging (DTI) (Dmipy12). Approximated T2 maps were calculated from exponential fitting of T2-weighted signal from IR (short TE) and no-diffusion weighted T2 image (long TE), with the calculation enabled by the unified EPI readout. T2* was calculated from the magnitude of the SPGR data (MyRelax)13. Quantitative Susceptibility Mapping (QSM) was reconstructed from the complex SPGR data (Morphology Enabled Dipole Inversion, MEDI)14. Positive and negative susceptibility maps were computed with a χ-separation method15. Brain parcellation was performed on 3DT116. Regions of interest (ROIs) of cortical grey matter (cGM), deep grey matter (dGM), white matter (WM) and brain stem (BS) were extracted. Automated segmentation of WM lesions was performed on 3D-FLAIR17 with manual correction by an experienced rater. All ROI masks were registered to the space of each qMRI metric18.
Statistical analysis
Robust means of all the qMRI metrics per ROI were computed using the interquartile range (IQR) rule19. A descriptive analysis of individual variables was conducted in R20 to identify uncorrected values. Subsequently, for each test score, the best set of qMRI predictors was identified using linear regression, including age and sex as covariates. The model was refined considering the best predictors from all the ROIs to obtain the best set of qMRI metrics explaining each test score (Figure 2).
RESULTS
All distributions of mean qMRI metrics in the ROIs were consistent with literature; given the nature of QSM, we considered only statistically significant dGM values (Figure 3).Figure 4 shows individual associations between qMRI metrics and each test score and the best set of predictors for each ROI from the first model selection.
Best final models (Figure 5) revealed that i) greater BS volume and greater cGM NDI values were associated with better smell function scores, ii) lower BS MD and lower dGM QSM were associated with better cognitive function, iii) greater cGM NDI was associated with worse fatigue scores.
DISCUSSION & CONCLUSIONS
Here, a multimodal qMRI protocol and symptoms test scores were used to find the best set of qMRI metrics that describe COVID-related cognitive symptoms, fatigue and persistent anosmia.Greater BS tissue integrity, as suggested by greater volume and lower MD, was associated with better cognitive and smell functions, in line with literature21.
Additionally, the association of greater MD (in the BS) and greater QSM (in the dGM) with worse cognitive scores suggests that long-COVID may be driven by inflammation and myelin damage.
Future analyses will investigate the ability of parameters sensitive to myelin integrity, chronic inflammation, and neurodegeneration to predict recovery and symptom alleviation in longitudinal studies.
Acknowledgements
EG receives funding from TDC Technology Dedicated to Care. FG receives the support of a fellowship from “la Caixa” Foundation (ID 100010434). The fellowship code is “LCF/BQ/PR22/11920010”. FPr received a Guarantors of Brain fellowship 2017–2020. FPr is supported by the National Institute for Health Research (NIHR), the Biomedical Research Centre initiative at University College London Hospitals (UCLH). RS receives funding from the BRC (BRC1130/HEI/RS/11041). KS receives funding support from European Research Council Consolidator Grant DiSCo MRI SFN 770939. H2020 Research and Innovation Action Grants Human Brain Project 785907 and 945539 (SGA2 and SGA3) to ED'A. Moreover, the project was supported by the MNL Project “Local Neuronal Microcircuits” of the Centro Fermi (Rome, Italy) to ED'A. This work was also supported by #NEXTGENERATIONEU (NGEU) and funded by the Ministry of University and Research (MUR), National Recovery and Resilience Plan (NRRP), project MNESYS (PE0000006) - A Multiscale integrated approach to the study of the nervous system in health and disease (DN. 1553 11.10.2022). FP receives funding from H2020 Research and Innovation Action Grants Human Brain Project (#785907, SGA2 and #945539, SGA3). CGWK receives funding from Horizon2020 (Human Brain Project SGA3, Specific Grant Agreement No. 945539), BRC (#BRC704/CAP/CGW), MRC (#MR/S026088/1), Ataxia UK, Rosetrees Trust (#PGL22/100041 and #PGL21/10079). CGWK is a shareholder in Queen Square Analytics Ltd.
References
[1] Davis, Hannah E., et al. “Long-COVID: major findings, mechanisms and recommendations”. Nature Reviews Microbiology, Volume 21, March 2023, 133–146
[2] Patil S.V., et al., “‘Long-COVID’ is more common, underestimated, and ‘core’ health issue in post covid care setting: study of 6000 cases in tertiary care setting in India”, European Respiratory Journal, Volume 60, April 2022, 10.1183/13993003.congress-2022.576
[3] Gandini Wheeler-Kingshott et al., Advanced magnetic resonance imaging to study brain tissue alterations in people infected with SARS-COV-2, ISMRM 2021
[4] Wingrove et al., Persistent anosmia following COVID-19 results in significant connectivity differences within olfactory regions: a resting state fMRI analysis, ISMRM Annual Meeting 2022
[5] Grosso et al., Quantitative Susceptibility Mapping and 𝜒- separation method: how MRI can help us understand COVID-19, Human Brain Project Summit 2023
[6] Ricciardi et al., Advanced magnetic resonance imaging to study brain alterations in people infected with SARS-COV2, Human Brain Project Summit 2023
[7] Afsahi AM, et al., Brain MRI findings in neurologically symptomatic COVID-19 patients: a systematic review and meta-analysis. J Neurol. 2023 Aug 3. doi: 10.1007/s00415-023-11914-9. Epub ahead of print. PMID: 37535100.
[8] Yücepur C, Ozücer B, Değirmenci N, Yıldırım Y, Veyseller B, Ozturan O. University of Pennsylvania smell identification test: application to Turkish population. Kulak Burun Bogaz Ihtis Derg. 2012 Mar-Apr;22(2):77-80. doi: 10.5606/kbbihtisas.2012.014. PMID: 22548263.
[9] Ryan J, Woods RL, Britt CJ, Murray AM, Shah RC, Reid CM, Wolfe R, Nelson MR, Orchard SG, Lockery JE, Trevaks RE, Storey E; behalf of the ASPREE Investigator Group on. Normative Data for the Symbol Digit Modalities Test in Older White Australians and Americans, African-Americans, and Hispanic/Latinos. J Alzheimers Dis Rep. 2020 Aug 4;4(1):313-323. doi: 10.3233/ADR-200194. PMID: 33024939; PMCID: PMC7504980.
[10] Larson RD. Psychometric properties of the modified fatigue impact scale. Int J MS Care. 2013 Spring;15(1):15-20. doi: 10.7224/1537-2073.2012-019. PMID: 24453758; PMCID: PMC3883028.[11] Grussu, F., Battiston, M., Veraart, J., Schneider, T., Cohen-Adad, J., Shepherd, T.M., Alexander, D.C., Fieremans, E., Novikov, D.S. and Wheeler-Kingshott, C.A.G., 2020. Multi-parametric quantitative in vivo spinal cord MRI with unified signal readout and image denoising. Neuroimage, 217, p.116884.
[12] Fick Rutger H. J., et al., The Dmipy Toolbox: Diffusion MRI Multi-Compartment Modeling and Microstructure Recovery Made Easy, Frontiers in Neuroinformatics, Vol.13, 2019, DOI=10.3389/fninf.2019.00064, ISSN=1662-5196
[13] Francesco Grussu. (2021). fragrussu/MyRelax: Public API 1.0.0 (1.0.0). Zenodo. https://doi.org/10.5281/zenodo.4561898
[14] Liu T, Liu J, de Rochefort L, et al., Morphology enabled dipole inversion (MEDI) from a single angle acquisition: comparison with COSMOS in human brain imaging. Magn Reson Med. 2011 Apr 4. doi: 10.1002/mrm.22816 / PMID: 21465541
[15] Shin,H.G, Lee, J. et al., χ-separation: Magnetic susceptibility source separation toward iron and myelin mapping in the brain, NeuroImage, Volume 240, 2021, 118371, ISSN 1053-8119, https://doi.org/10.1016/j.neuroimage.2021.118371.
[16] Cardoso MJ, Modat M, et al., Geodesic Information Flows: Spatially-Variant Graphs and Their Application to Segmentation and Fusion. IEEE Trans Med Imaging. 2015 Sep;34(9):1976-88. doi: 10.1109/TMI.2015.2418298. Epub 2015 Apr 14. PMID: 25879909.
[17] Valverde, Sergi, et al. “One-shot domain adaptation in multiple sclerosis lesion segmentation using convolutional neural networks” https://arxiv.org/abs/1805.12415
[18] Ferran Prados, M. Jorge Cardoso, Ninon Burgos, Claudia AM Wheeler-Kingshott, Sebastien Ourselin. NiftyWeb: web based platform for image processing on the cloud. International Society for Magnetic Resonance in Medicine (ISMRM) 24th Scientific Meeting and Exhibition - Singapore 2016
[19] H P, Vinutha & Poornima, B. & Sagar, B., (2018). Detection of Outliers Using Interquartile Range Technique from Intrusion Dataset. 10.1007/978-981-10-7563
[20] RStudio Team (2020). RStudio: Integrated Development for R. RStudio, PBC, Boston, MA URL http://www.rstudio.com/.
[21] Fu X, Lu Z, Wang Y, Huang L, Wang X, Zhang H, Xiao Z. A Clinical Research Study of Cognitive Dysfunction and Affective Impairment after Isolated Brainstem Stroke. Front Aging Neurosci. 2017 Dec 19;9:400. doi: 10.3389/fnagi.2017.00400. PMID: 29311895; PMCID: PMC57422
Figures
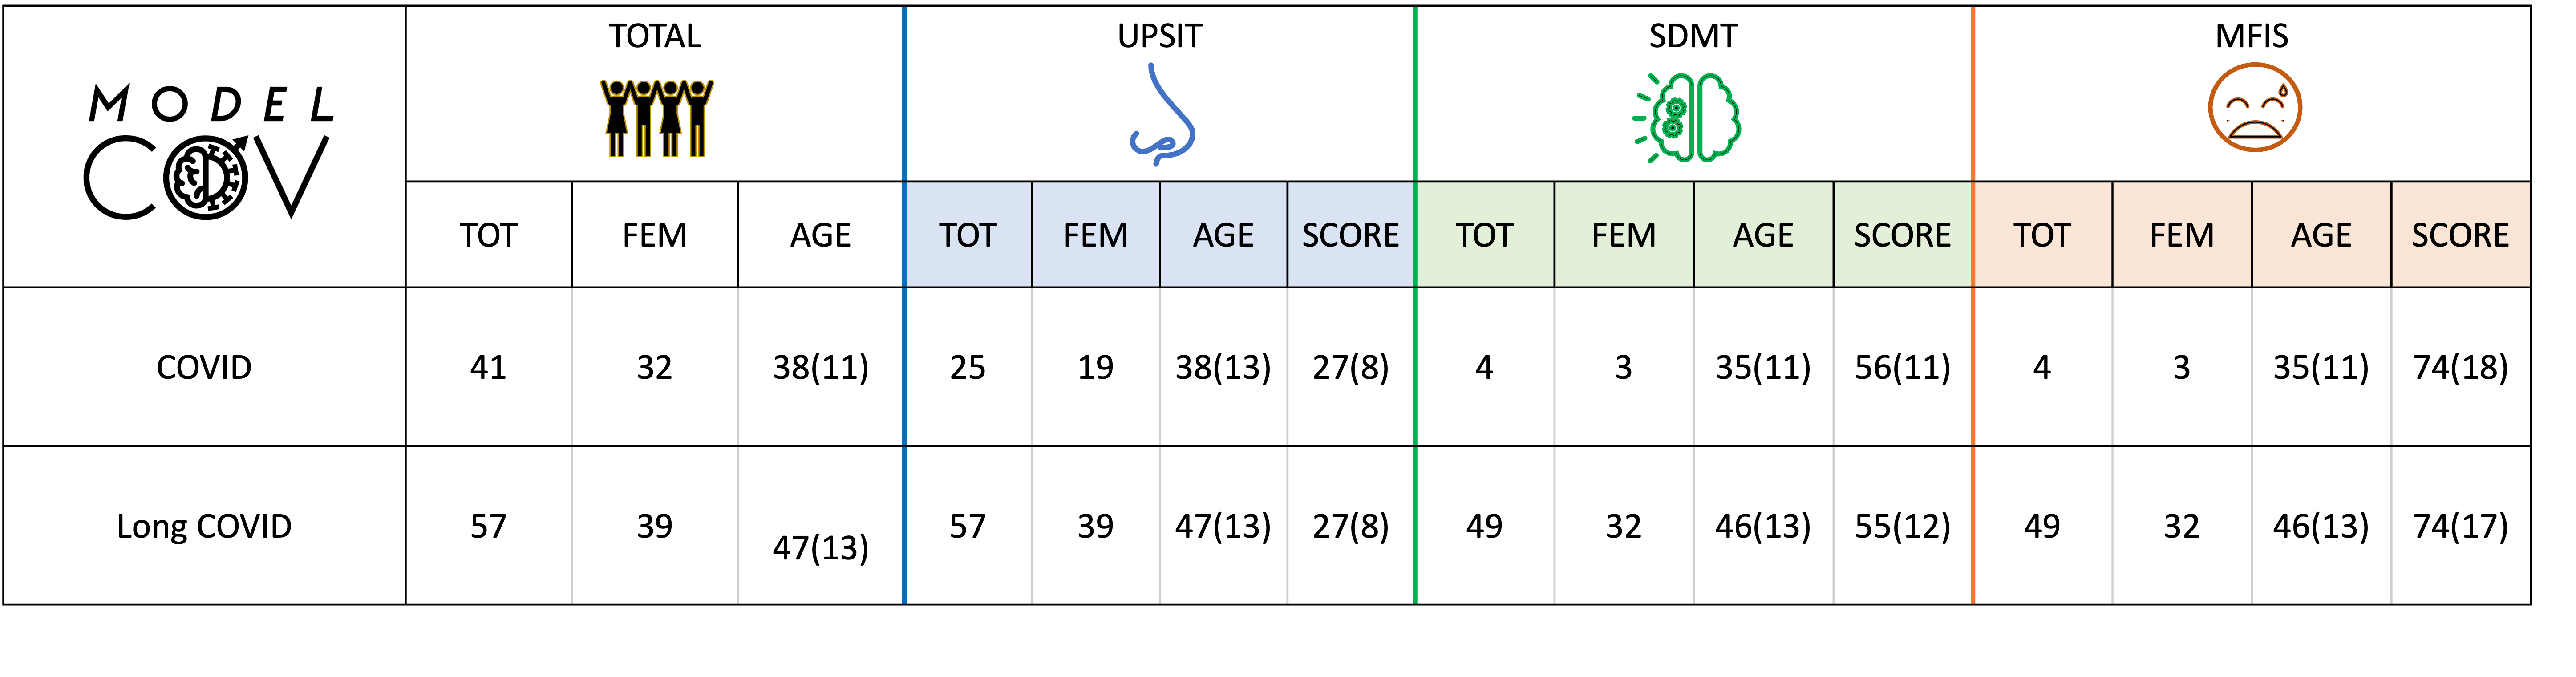
Figure 1| Database table. First column represents the total number of subjects acquired for each group (COVID and long-COVID) together with their age and sex. In the other columns the number of subjects who underwent UPSIT–smell function test (blue), SDMT-cognitive function test (green), and MFIS–fatigue test (orange) are reported per group. All COVID and long-COVID subjects were entered in the statistical analyses as one group, where scores reflected the presence or absence of certain symptoms.
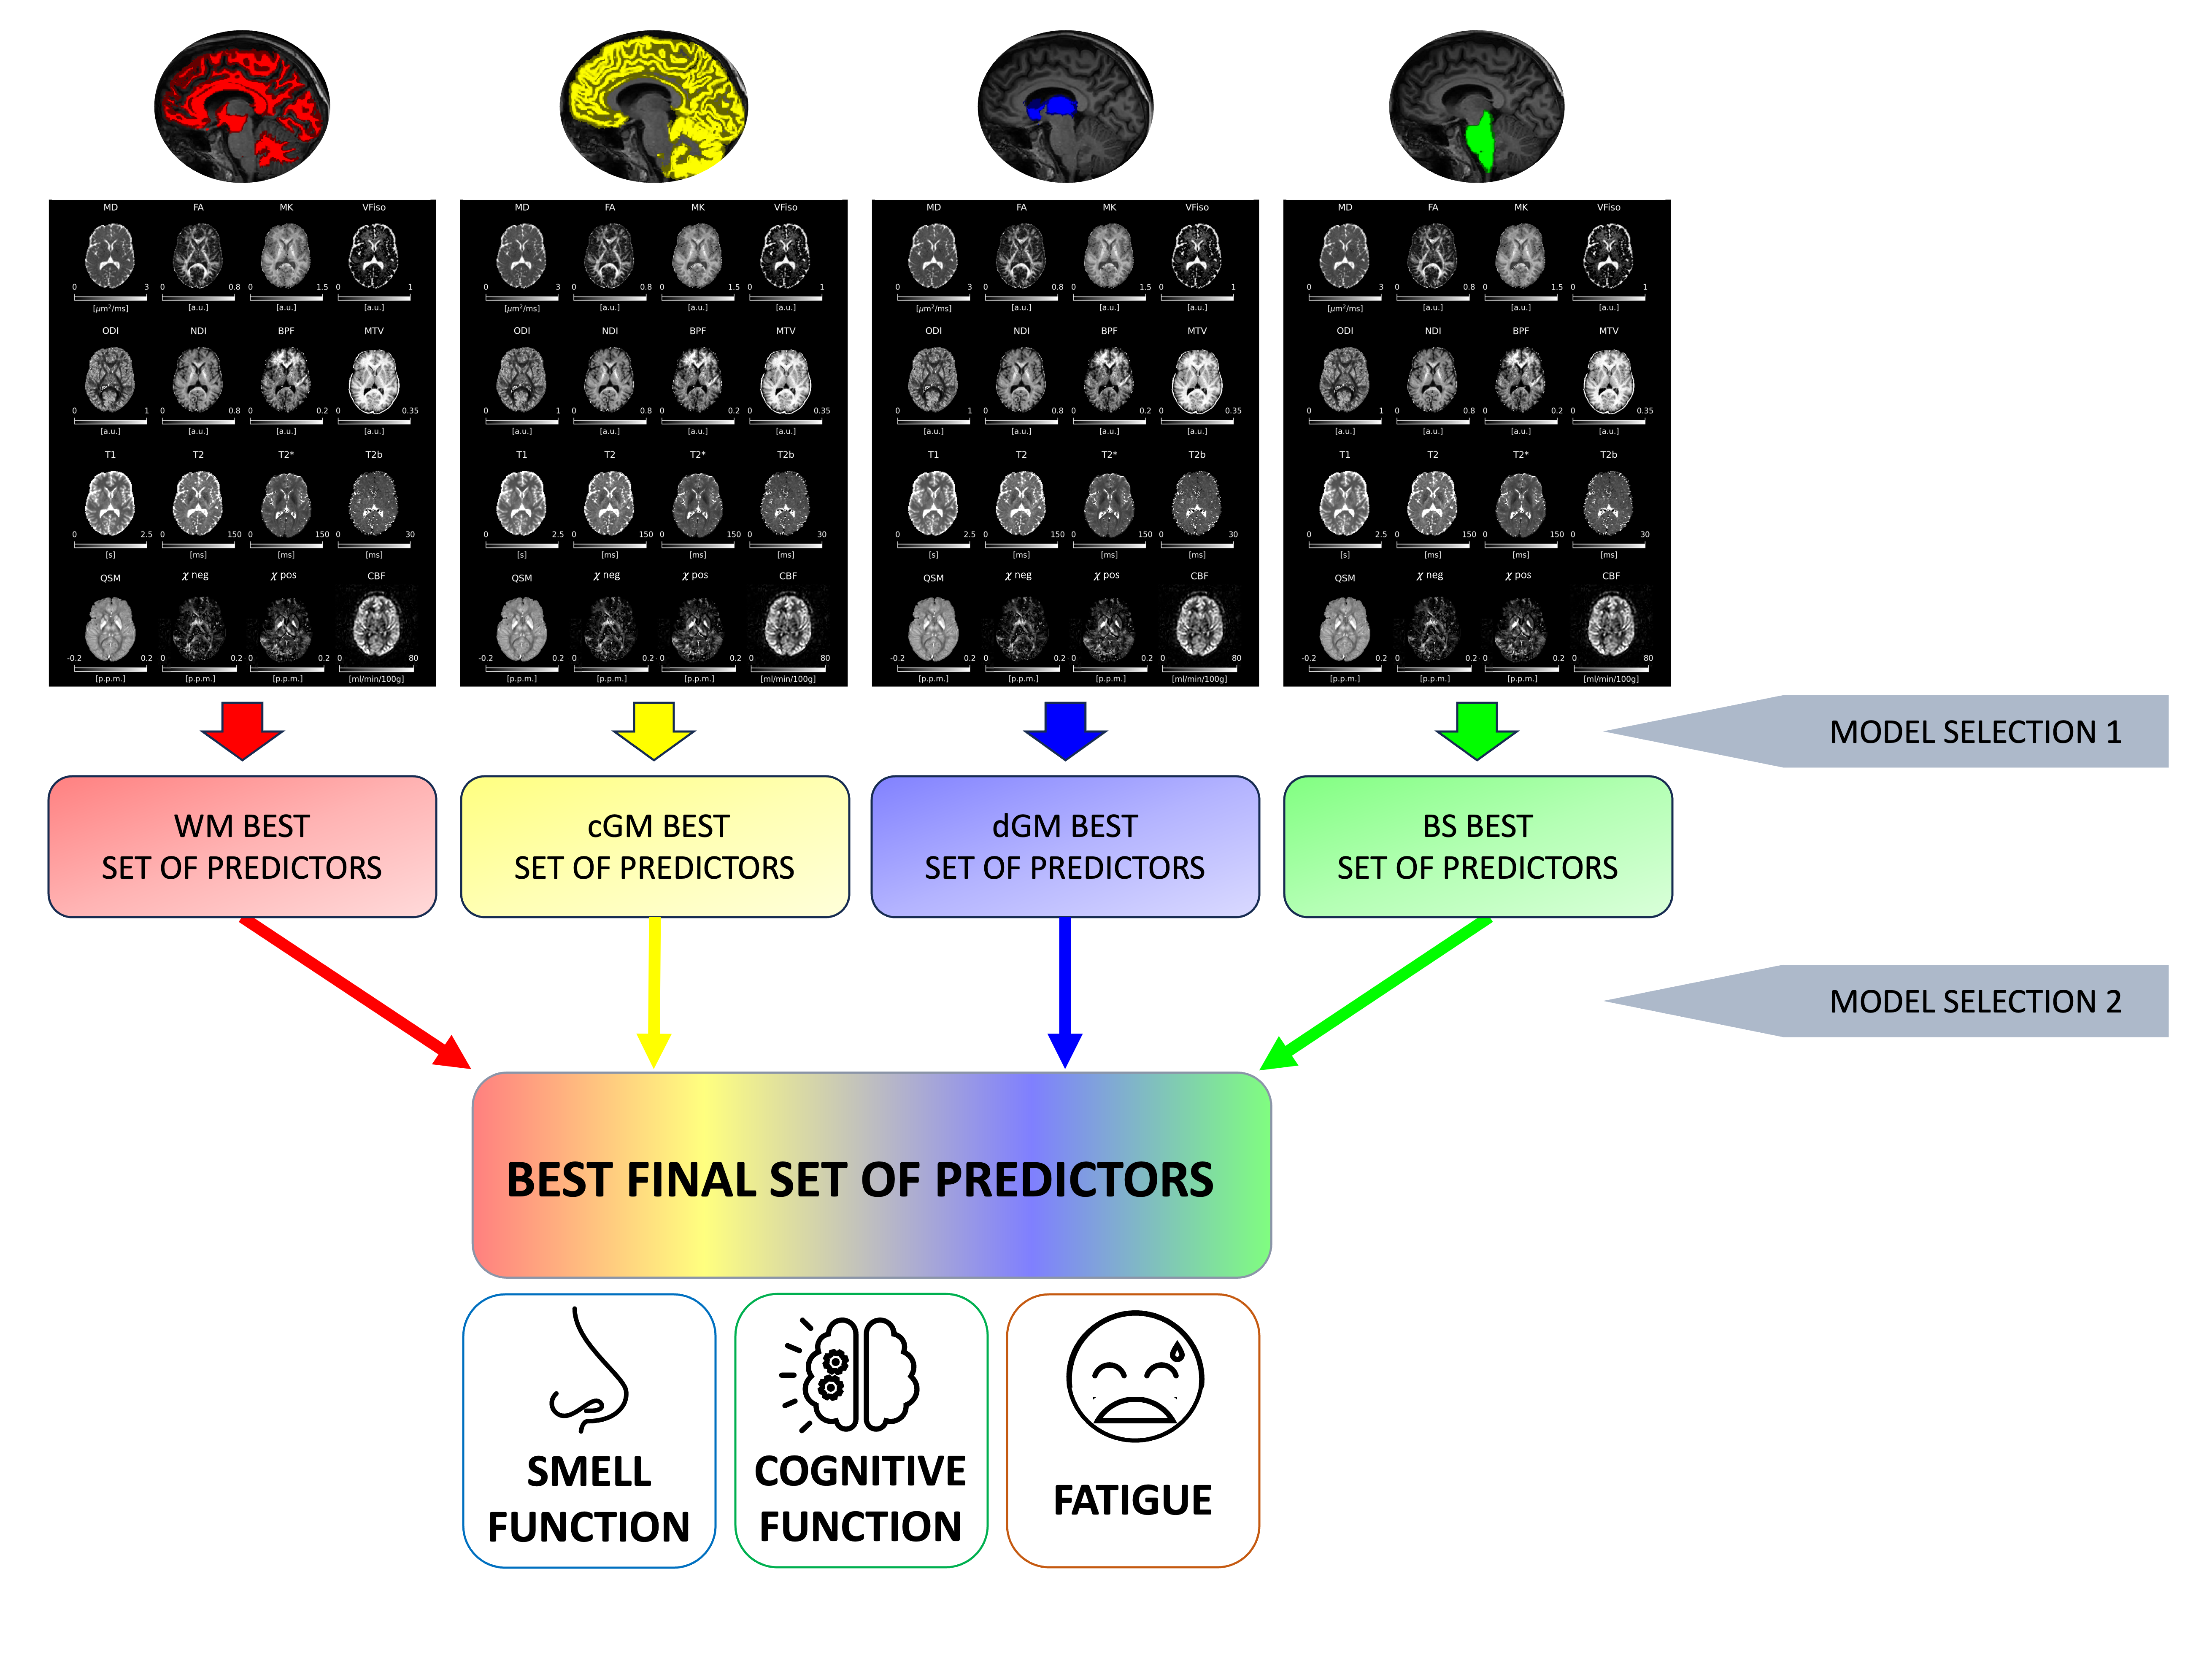
Figure 2| Statistical method. First, mean of all the qMRI metrics were computed in the white matter (WM), cortical and deep grey matter (cGM, dGM), and in the brain stem (BS). Then, a first model selection was performed identifying the best regional set of predictors. Finally, a second model selection was run, identifying the best final set of predictors for each of the symptoms (smell function, cognitive function and fatigue).
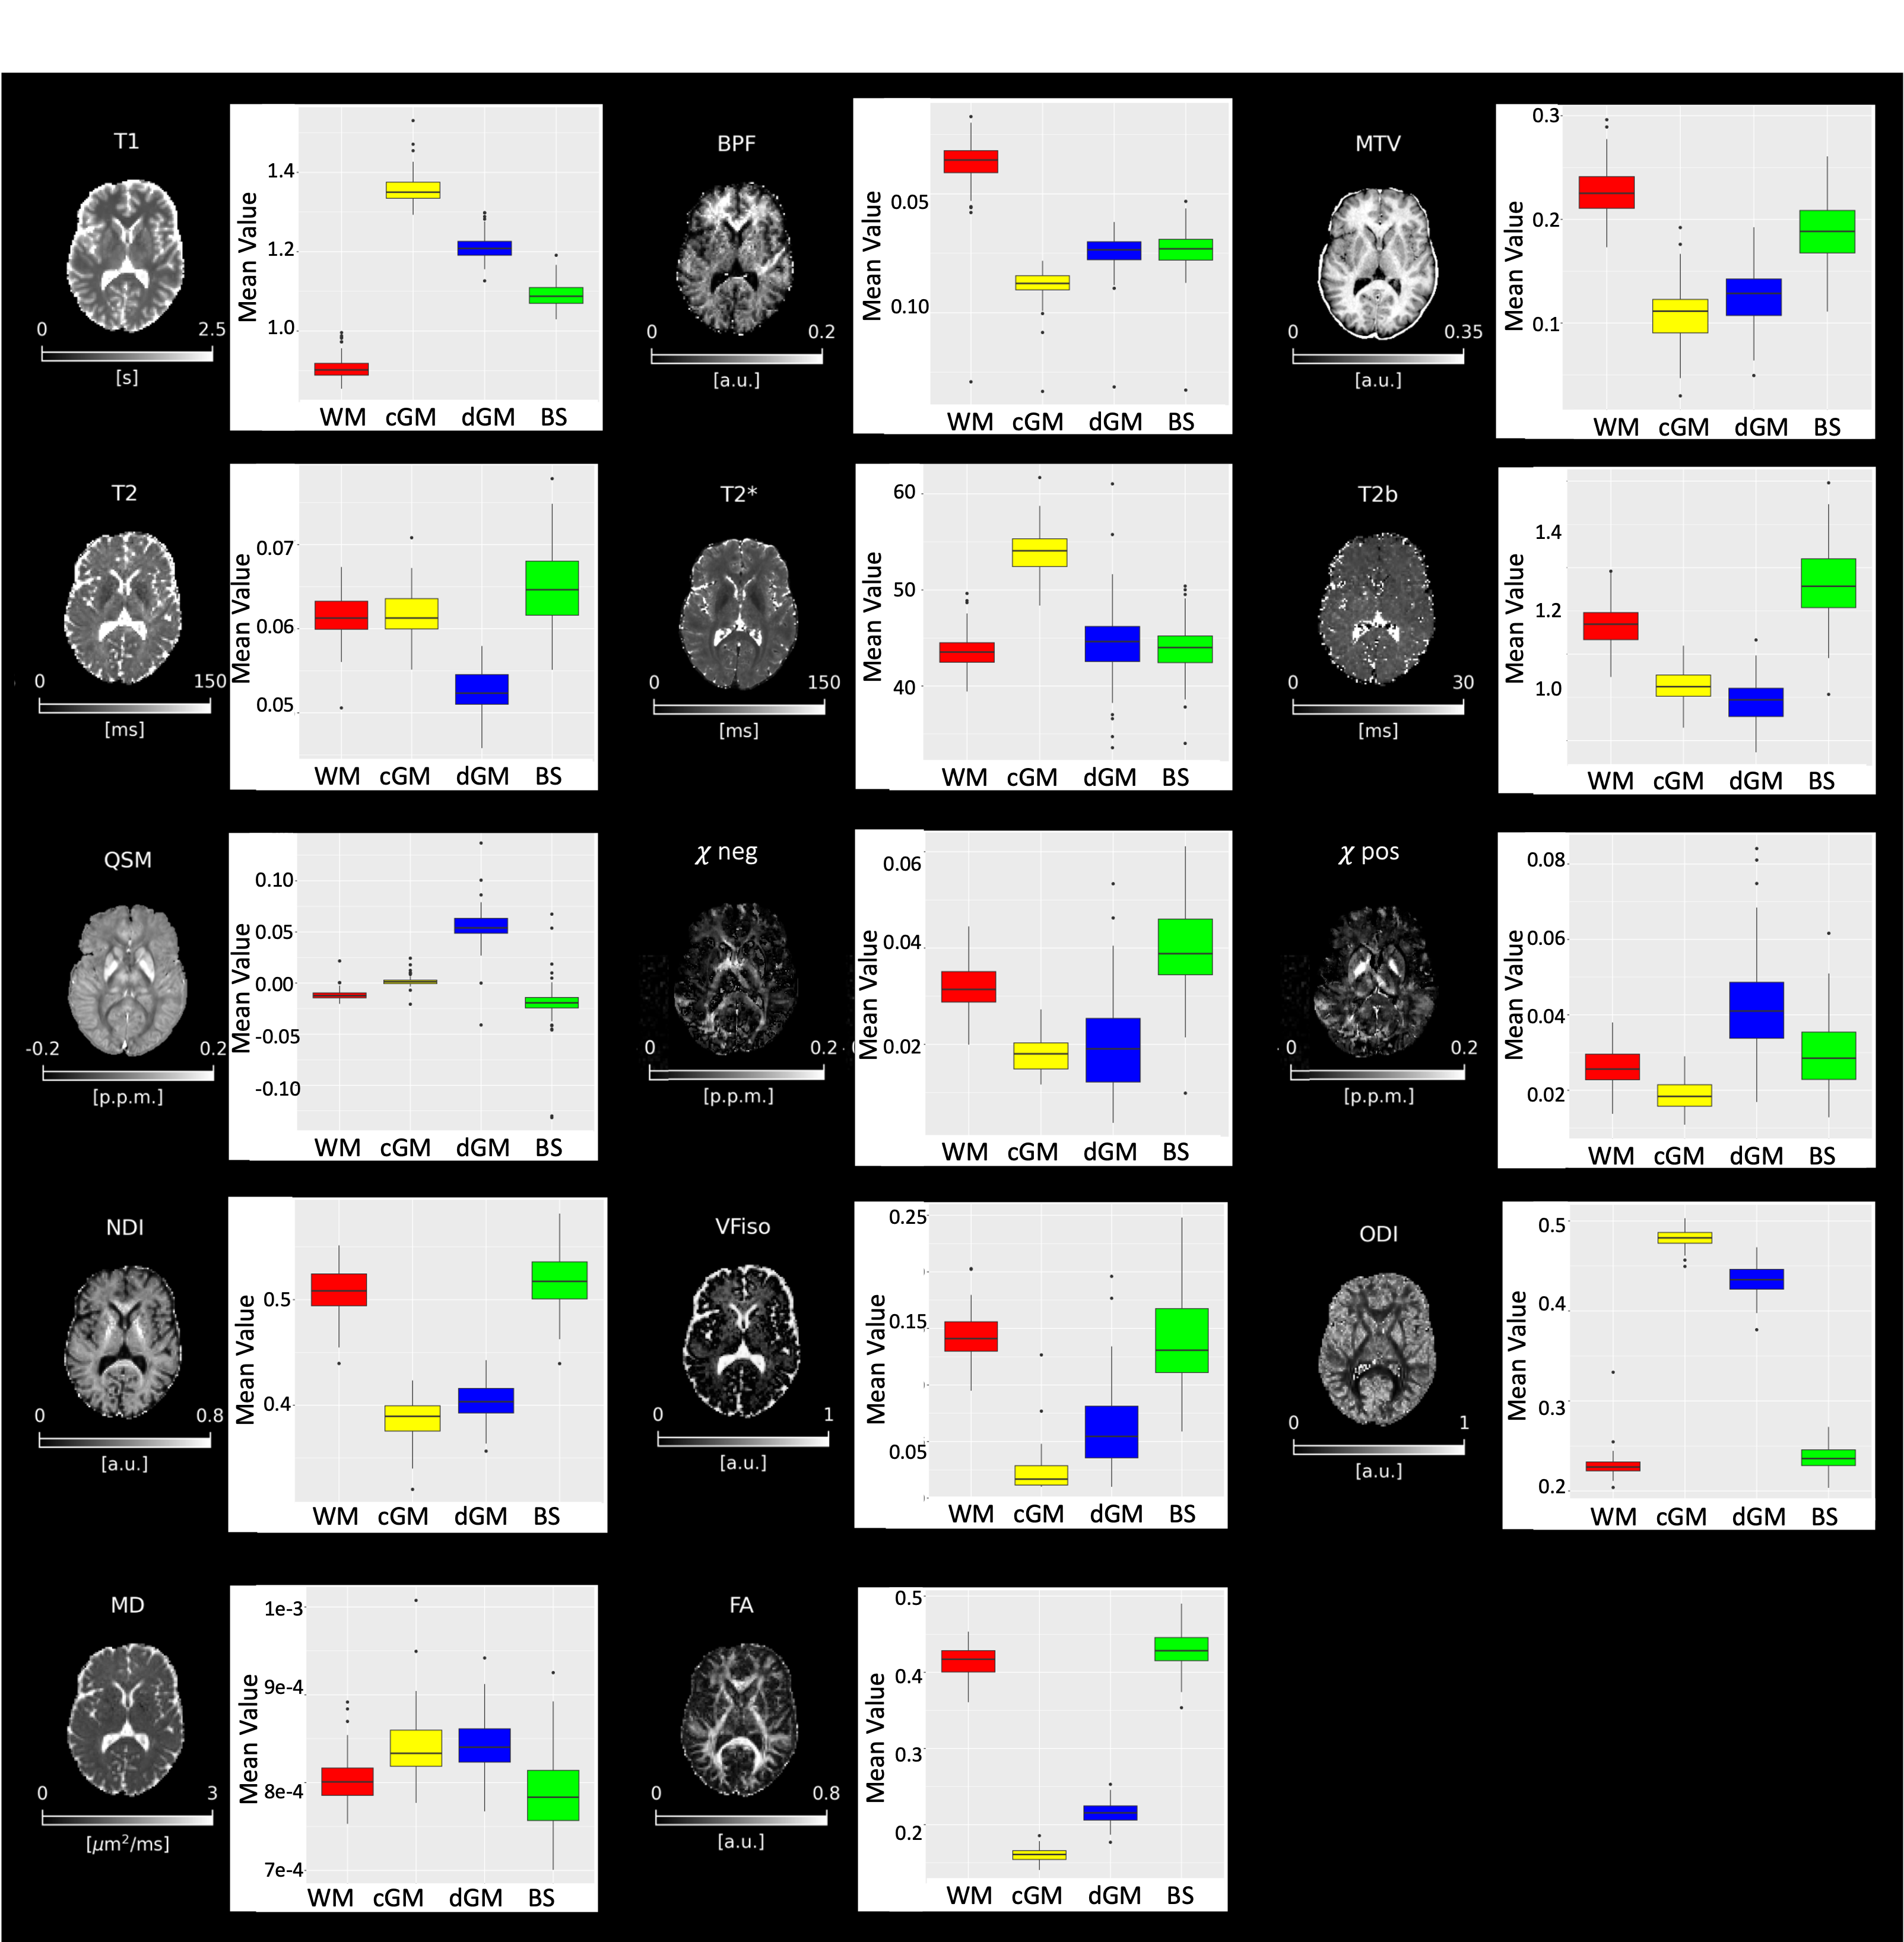
Figure 3| Quantitative MRI maps and descriptive analysis. Overview of all the quantitative maps obtained from the multimodal MRI protocol associated with a boxplot representing the subjects’ mean values distribution. BPF = bound pool fraction; MTV = macromolecular tissue volume, T2b = T2 of bound protons; QSM = quantitative susceptibility mapping; χneg = negative susceptibility; χpos = positive susceptibility; NDI = neurite density index; VFiso = isotropic volume fraction; ODI = orientation dispersion index; MD = mean diffusivity; FA = fractional anisotropy.
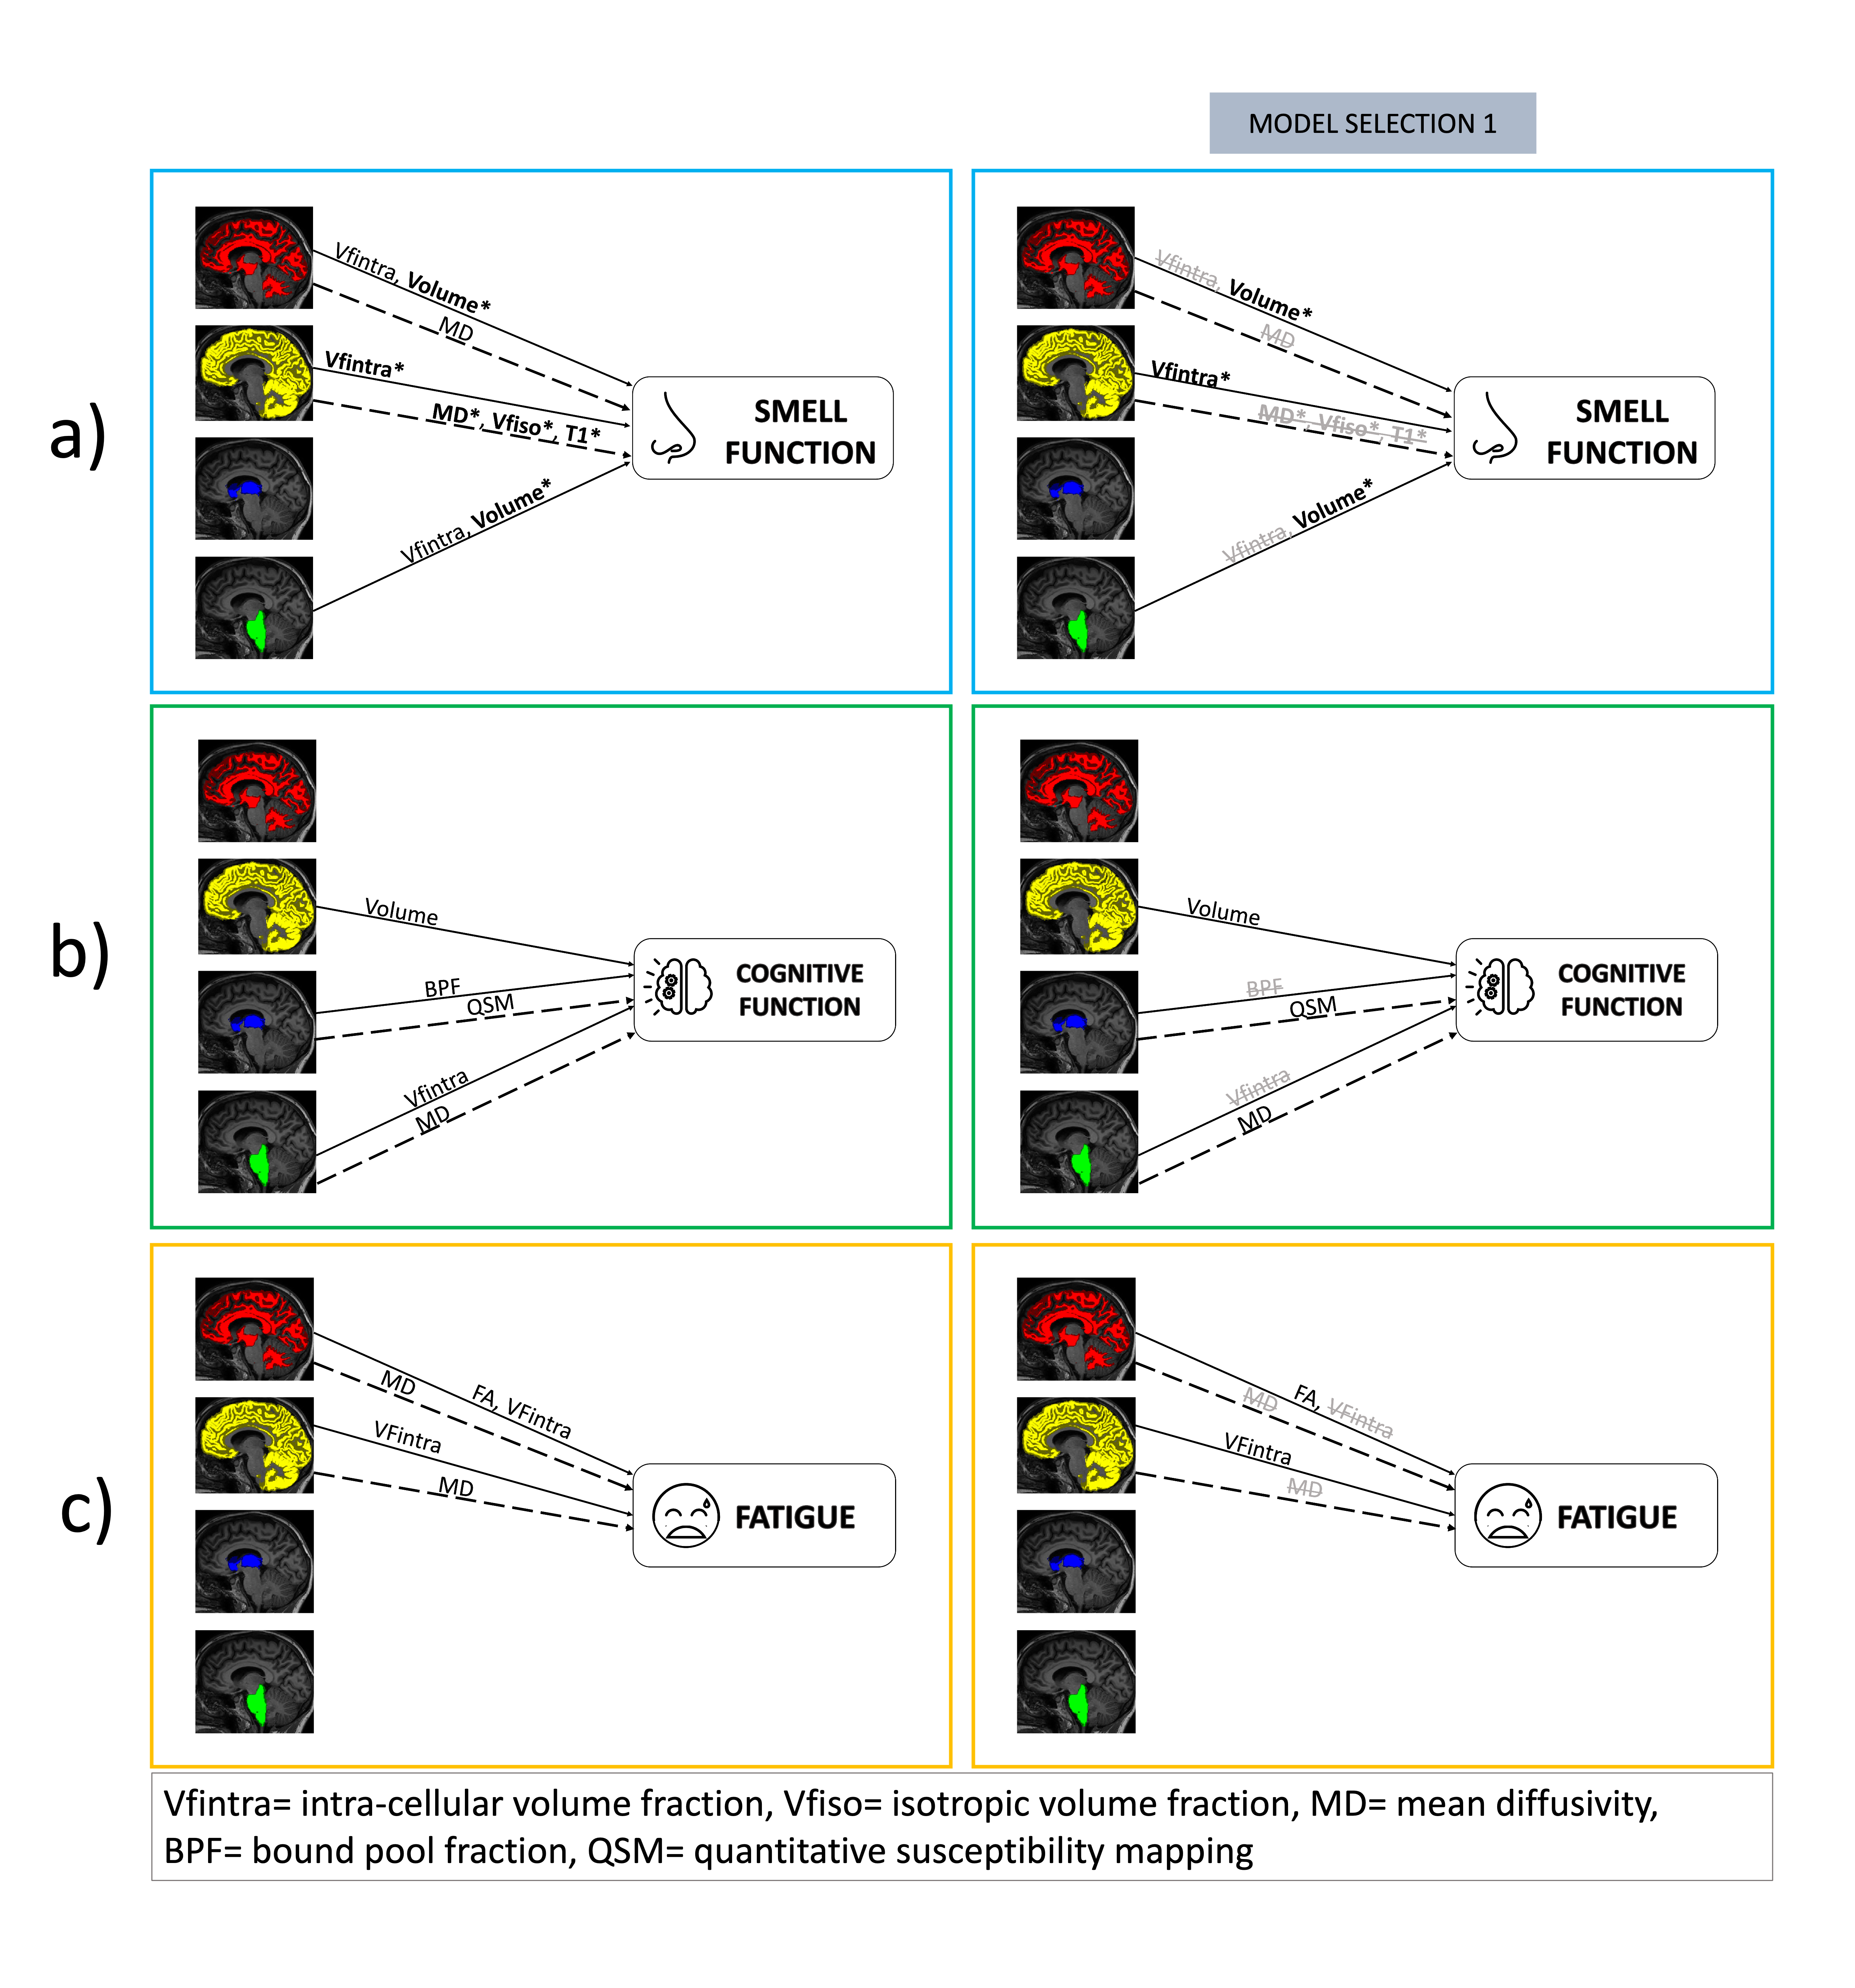
Figure 4| Test score models. First column represents the correlation between each of the MRI metrics and smell function (a), cognitive function (b) and fatigue (c). Second column represents the best set of predictors for each ROI as a result of the first model selection. Straight arrows represent positive correlations while dotted arrows represent negative correlations. Bold metrics are those with p<0.01, non-bold ones correlate with p<0.05.
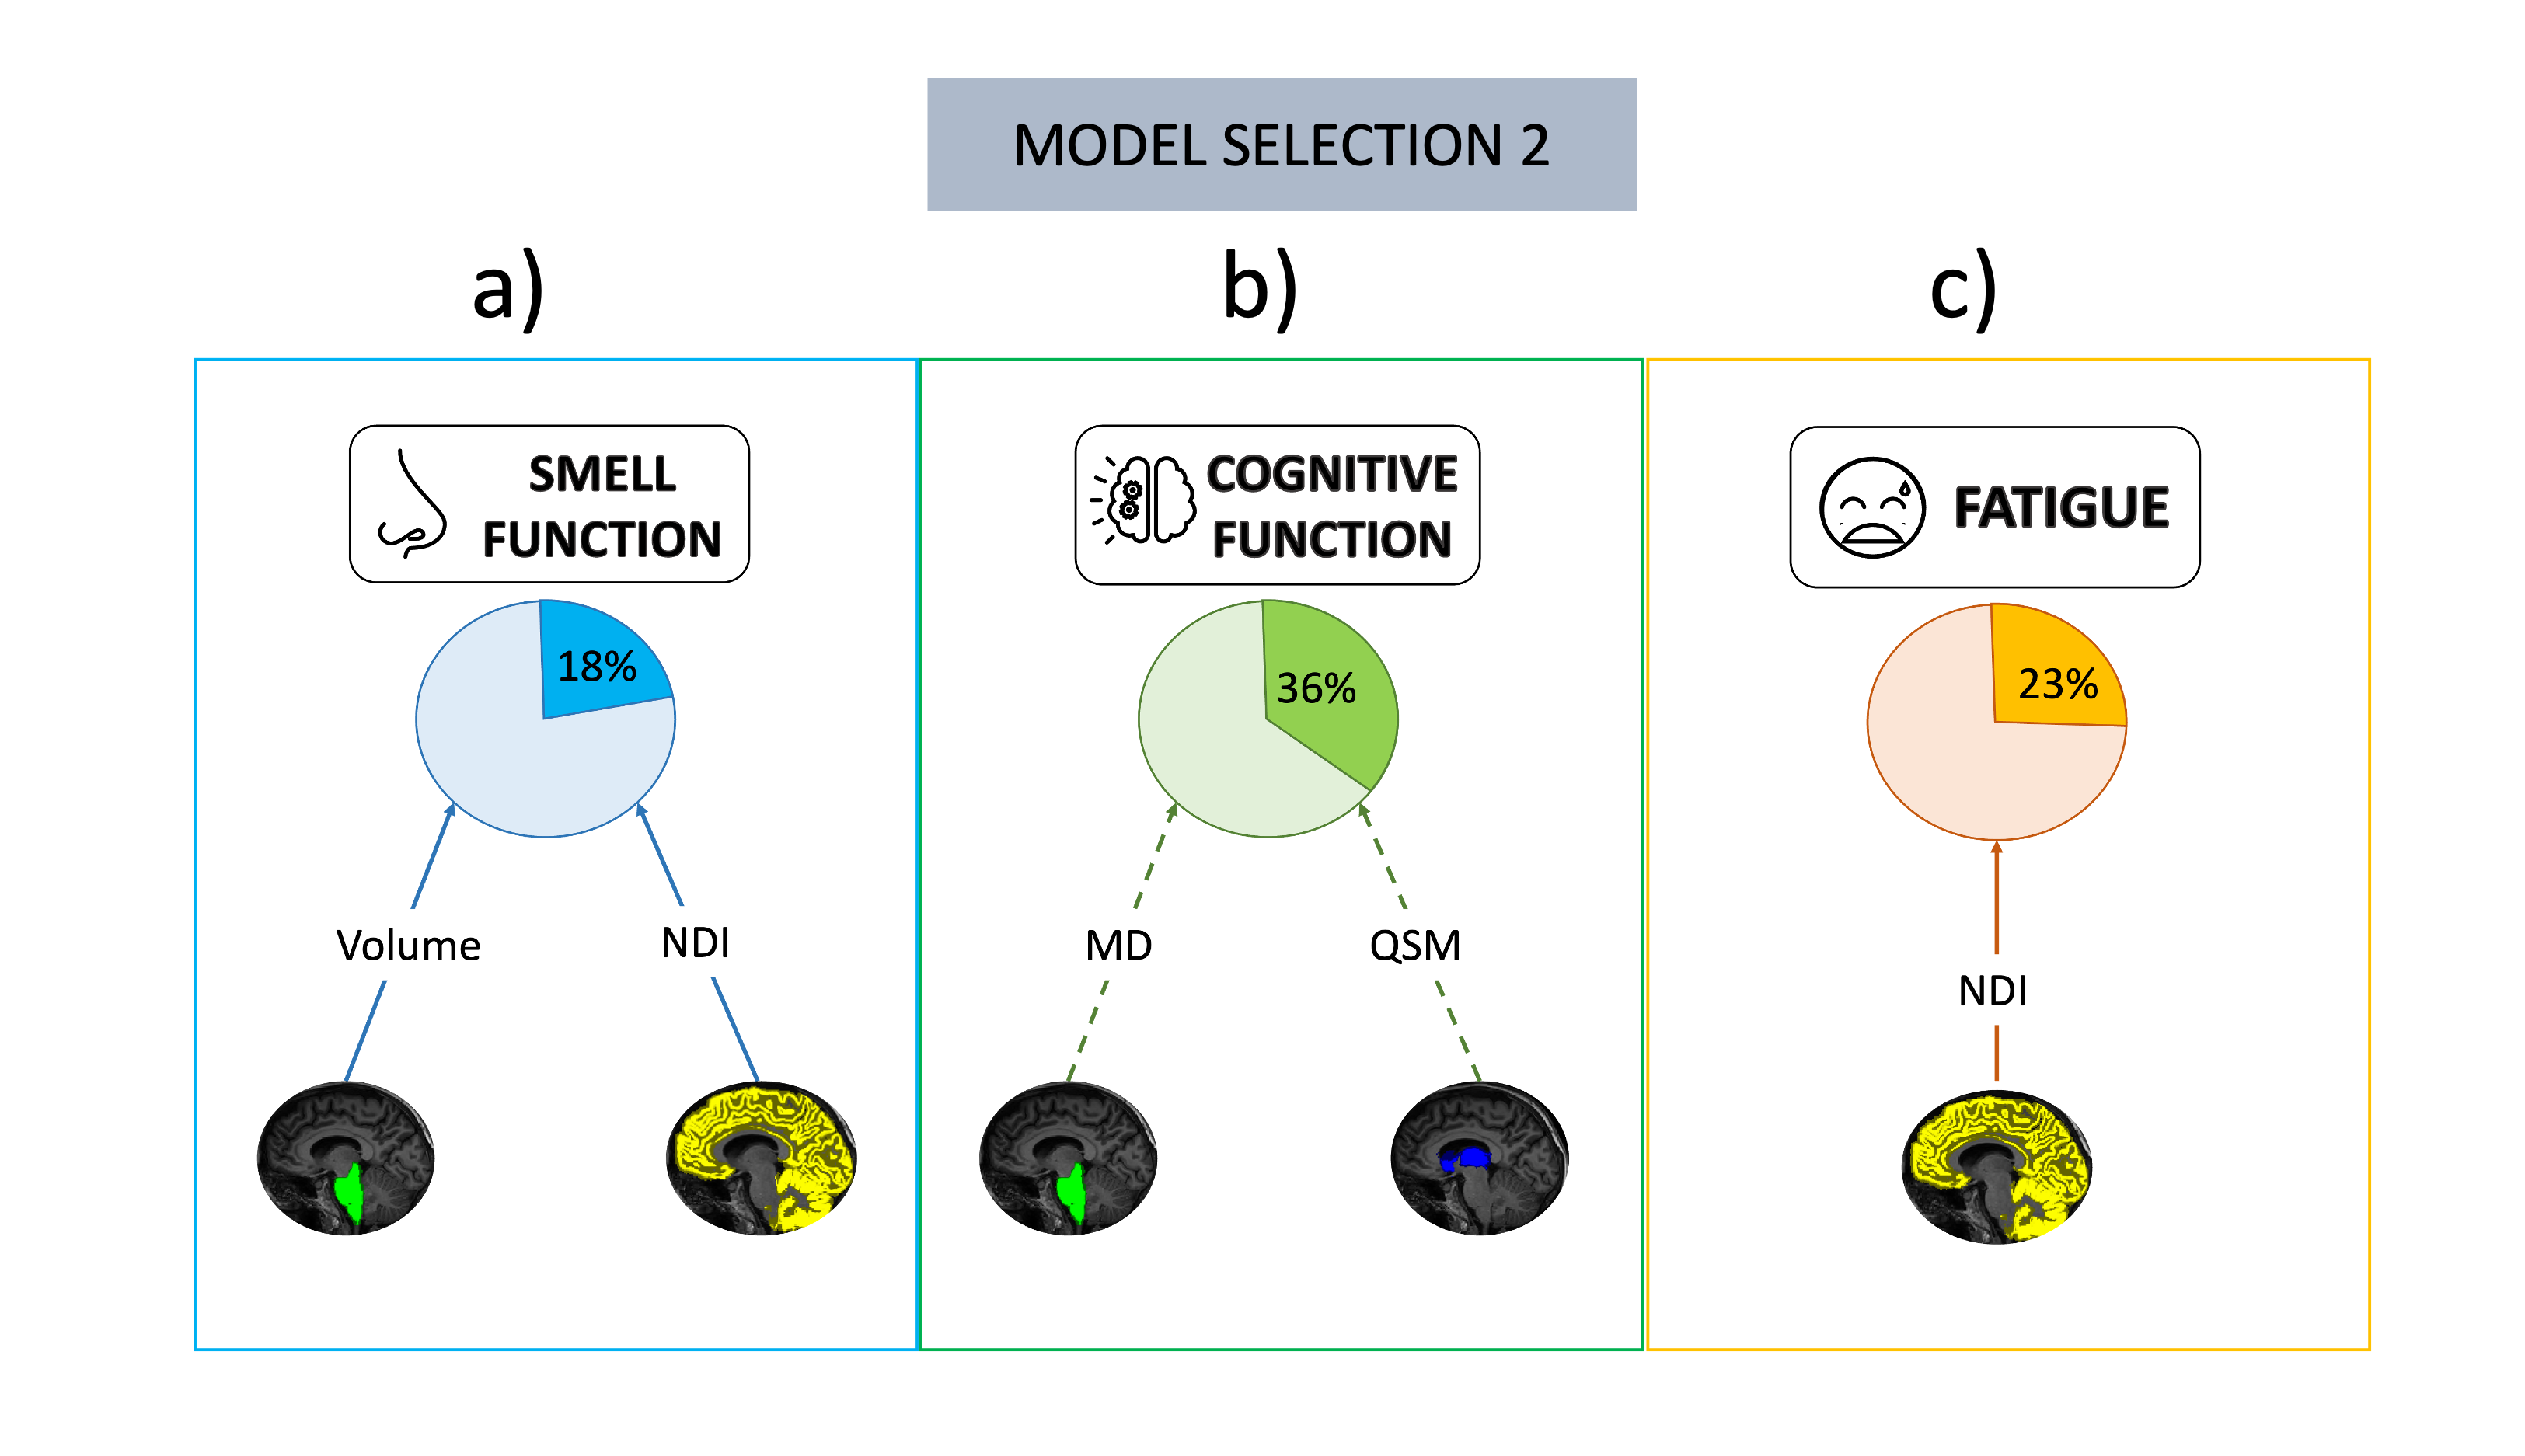
Figure 5| Symptoms best models. Box a) contains smell function best model: greater volume in brain stem (BS) and greater neurite density index (NDI) in cortical grey matter (cGM) are associated with better smell function scores (R2=0.18). Box b) contains cognitive function best model: lower mean diffusivity (MD) in the BS and lower quantitative susceptibility mapping (QSM) in the deep grey matter are associated with better cognitive function (R2=0.36). Box c) contains fatigue best model: greater cGM NDI is associated with worse fatigue (R2=0.23).