0977
Obstructive Sleep Apnea: Feasibility of Concurrent Evaluation of Neurometabolic Rate and Upper Airway Architecture During Sleep in the Scanner1Radiology, University of Pennsylvania, Philadelphia, PA, United States, 2Medicine, University of Pennsylvania, Philadelphia, PA, United States, 3Neurology, University of Pennsylvania, Philadelphia, PA, United States
Synopsis
Keywords: Neuroinflammation, Brain Connectivity, Cerebral Metabolic Rate of Oxygen
Motivation: Obstructive sleep apnea (OSA) is a common disorder predisposing patients to heart disease, stroke, and cognitive dysfunction.
Goal(s): To gain insights into the association between brain metabolism and changes in upper airway architecture during spontaneous apneas during sleep in the scanner.
Approach: A time-resolved pulse sequence was designed that yields neurometabolic parameters and airway anatomy at 6-second temporal resolution, along with EEG monitoring during a 90-minute scan.
Results: Data demonstrate associations between transient airway architectural changes and brain vascular-metabolic alterations, notably a steep drop in cerebral metabolic rate of oxygen (CMRO2) during sleep and following apneic events, providing new insight into the disorder.
Impact: Understanding the acute structural and neurometabolic consequences of apneic events in obstructive sleep apnea will provide new insight into the disease and provide a method to evaluate the response to treatment.
Background and Motivation
Obstructive sleep apnea (OSA) is the most common sleep disorder and a recognized risk factor for hypertension, heart disease, metabolic disorders, stroke, and cognitive dysfunction, with an estimated worldwide prevalence of one billion people (1). The cyclical events of nocturnal hypoxia and hypoxemia (2) are at the core of the disorder’s pathogenesis, involving upregulation of neuroinflammation (3), oxidative stress and endothelial dysfunction (4), predisposing OSA patients to cardiac and neurovascular disease (5), along with impaired cognitive function and neurodegeneration (6). Some of the present authors have previously used structural MRI to visualize and quantify upper airway anatomy in OSA patients (7) and, more recently, physiological MRI to measure variations in brain metabolism during induced apneas (8), as well as during sleep in healthy subject (9). However, the dynamic relationships between airway anatomic changes, hypoxic episodes, and their effects on brain metabolism, have not previously been studied.Methods
Toward the above objective we have designed a pulse sequence allowing spatially interleaved structural and metabolic MRI to OSA patients subjected to a 90-minute protocol during wakefulness and sleep, with simultaneous EEG recording and synchronization with airflow plethysmography (NOX Medical, Reykjavík, Iceland) for direct detection of sleep-disordered breathing, apneas and hypopneas. The device quantifies upper airway airflow in real time. The sequence used, here referred to as single-band upper-airway OxFlow (sbUA‑OxFlow) contains an OxFlow module for measuring CBF and venous O2 saturation (SvO2) preceded by a gradient-echo module during which views were collected in an interleaved manner using centric encoding to obtain one mid-line sagittal and two axial slices across the upper airway in 2.045s during the 6 second sequence interval (Figure 1). Axial slices were prescribed at retropalatal and retroglossal locations where the majority of airway closures occur (10). The pulse sequence was designed by means of SequenceTree, a pulse sequence design and editing tool used in the authors’ prior work (11). The pulse sequence was implemented on a 3T Siemens Prisma system. Sleep stage was determined based on EEG power spectra. Filtering of the gradient noise corrupted signal was accomplished as described in (12). Passive acoustic noise control was used to facilitate sleep via earplugs and earphones. Figure 2 displays the time-series protocol. Whole-brain cerebral metabolic rate of oxygen (CMRO2) was computed via Fick’s Principle (Eq. 1): CMRO2 = Ca·CBF·(SaO2-SvO2) with arterial saturation (SaO2) having been obtained by pulse oximetry. Ca in Eq. 1 is the oxygen carrying capacity of blood, obtained from a measurement of hematocrit.Results
Figure 3 displays the time-course obtained from an OSA patient (M, 62 y) who is currently undergoing CPAP treatment but who was willing to participate in a feasibility study after having agreed to a 48-hour washout period prior to the study (two consecutive nights without wearing CPAP mask). The data show the metabolic response to a series of closely spaced apneas that occurred during stage-2 sleep, causing a steep drop in CMRO2 resulting from much reduced arteriovenous difference (AvO2 = SaO2–SvO2) due to both, arterial desaturation and substantially increased SvO2 and elevated CBF (the latter two effects are consistent with the hypercapnic-hypoxic response to apnea (13)). The deepest drop in CMRO2 occurred during stage-2 (N2) sleep as the patient did not achieve slow-wave (N3) sleep. The occurrence of successive apneas in this subject is confirmed by the simultaneously recorded airflow plethysmogram in Fig. 3b showing a string of short periods of disrupted airflow (corresponding to apneas). Retropalatal airway closure indicated by the temporary arrest of breathing is clearly evident in the sagittal image of Fig. 4 representing a roughly one-minute segment of the 90-minute time series. The authors have since observed apneas during light sleep in two additional subjects (data not shown).Discussion
The present temporally resolved quantitative MRI data demonstrate the feasibility of monitoring the dynamic changes in airway caliber during sleep -- both during respiration and apneas -- along with neuro-vascular-metabolic parameters. The large arterial desaturation (reduced SaO2), along with increases in CBF and SvO2 during successive apneas, observed in the patient with independently determined sleep apnea, provides dynamic information that may in the future be able to guide therapy.Conclusions
MRI is presently the only modality with potential to concurrently quantify brain oxygen metabolic parameters during sleep and capturing the transient response to apneas, along with upper airway dynamic alterations as they occur in obstructive sleep apnea.Acknowledgements
NIH P41 EB029460, NIH R21 AG065816References
1. Benjafield AV, Ayas NT, Eastwood PR, Heinzer R, Ip MSM, Morrell MJ, Nunez CM, Patel SR, Penzel T, Pepin JL, Peppard PE, Sinha S, Tufik S, Valentine K, Malhotra A. Estimation of the global prevalence and burden of obstructive sleep apnoea: a literature-based analysis. Lancet Respir Med 2019;7(8):687-698.
2. Madsen PL, Holm S, Herning M, Lassen NA. Average blood flow and oxygen uptake in the human brain during resting wakefulness: a critical appraisal of the Kety-Schmidt technique. J Cereb Blood Flow Metab 1993;13(4):646-655.
3. Deng Y, Liu K, Pan Y, Ren J, Shang J, Chen L, Liu H. TLR2 antagonism attenuates the hippocampal neuronal damage in a murine model of sleep apnea via inhibiting neuroinflammation and oxidative stress. Sleep Breath 2020;24(4):1613-1621.
4. Lavie L. Oxidative stress in obstructive sleep apnea and intermittent hypoxia--revisited--the bad ugly and good: implications to the heart and brain. Sleep Med Rev 2015;20:27-45.
5. Durgan DJ, Bryan RM, Jr. Cerebrovascular consequences of obstructive sleep apnea. J Am Heart Assoc 2012;1(4):e000091.
6. Bucks RS, Olaithe M, Eastwood P. Neurocognitive function in obstructive sleep apnoea: a meta-review. Respirology 2013;18(1):61-70.
7. Feng Y, Keenan BT, Wang S, Leinwand S, Wiemken A, Pack AI, Schwab RJ. Dynamic Upper Airway Imaging during Wakefulness in Obese Subjects with and without Sleep Apnea. Am J Respir Crit Care Med 2018;198(11):1435-1443.
8. Wu PH, Rodríguez-Soto AE, Wiemken A, Englund EK, Rodgers ZB, Langham MC, Schwab RJ, Detre JA, Guo W, Wehrli FW. MRI evaluation of cerebral metabolic rate of oxygen (CMRO(2)) in obstructive sleep apnea. J Cereb Blood Flow Metab 2022;42(6):1049-1060.
9. Caporale A, Lee H, Lei H, Rao H, Langham MC, Detre JA, Wu PH, Wehrli FW. Cerebral metabolic rate of oxygen during transition from wakefulness to sleep measured with high temporal resolution OxFlow MRI with concurrent EEG. J Cereb Blood Flow Metab 2021;41(4):780-792.
10. Gamaleldin O, Bahgat A, Anwar O, Seif-Elnasr M, Eissa L, Razek A, Shehata GM, Khalifa MH. Role of dynamic sleep MRI in obstructive sleep apnea syndrome. Oral Radiol 2021;37(3):376-384.
11. Magland JF, Li C, Langham MC, Wehrli FW. Pulse sequence programming in a dynamic visual environment: SequenceTree. Magn Reson Med 2016;75(1):257-265.
12. Caporale AS, Barclay AM, Xu J, Rao H, Lee H, Langham MC, Detre JA, Wehrli FW. Superior sagittal sinus flow as a proxy for tracking global cerebral blood flow dynamics during wakefulness and sleep. J Cerebral Blood Flow Metab 2023;In Press.
13. Wu PH, Rodriguez-Soto AE, Wiemken A, Englund EK, Rodgers ZB, Langham MC, Schwab RJ, Detre JA, Guo W, Wehrli FW. MRI evaluation of cerebral metabolic rate of oxygen (CMRO(2)) in obstructive sleep apnea. J Cereb Blood Flow Metab 2022;42(6):1049-1060.
Figures
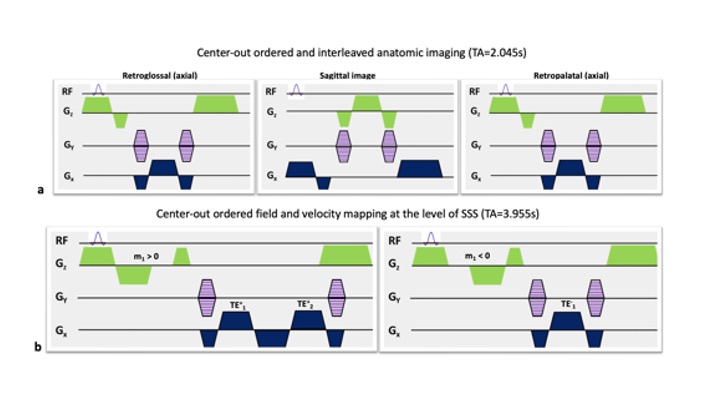
Figure 1: Pulse sequence for quantifying neurometabolic parameters and visualizing upper airway by concatenating a) and b).
a) Axial (at level of retroglossal and retropalatal airway) and mid-sagittal anatomic upper airway images collected by interleaving 3 RF-spoiled gradient echoes (SPGR) with partial Fourier (3/4) acquisition..
b) Two SPGR with non-zero first moment m1 are interleaved. Pulse cycles with m1>0 collect 2 echoes (TE+1, TE+2) but 1 echo when m1<0, TE-1. Field map for SvO2 quantification is generated from TE+1 and TE+2, and velocity map is computed from TE+1 and TE-1.
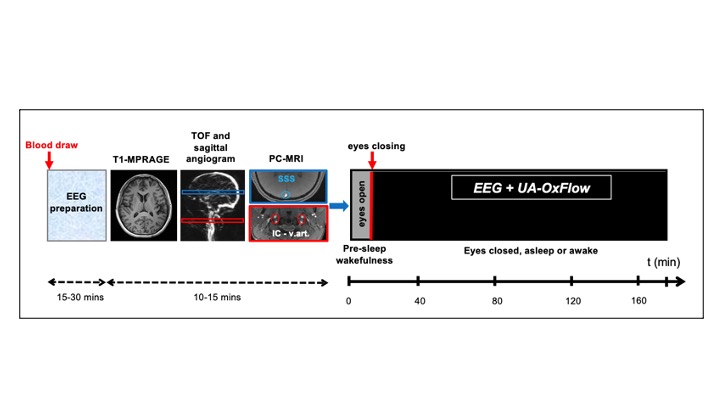
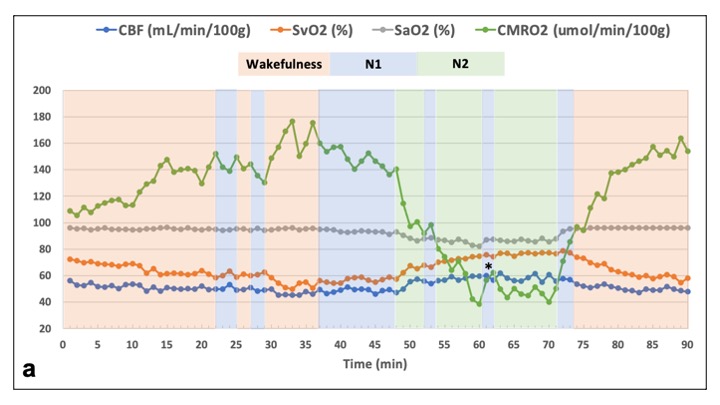
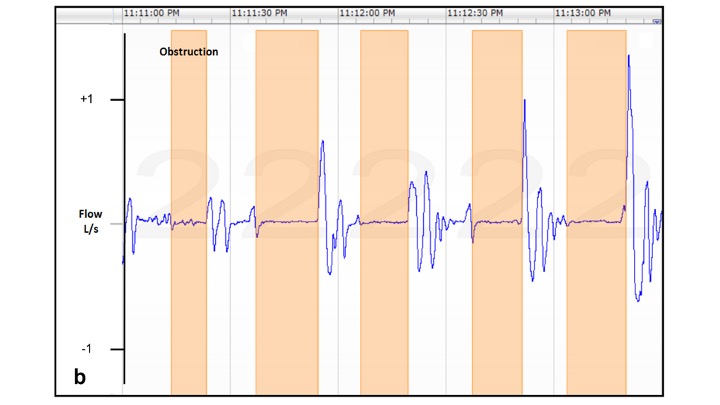
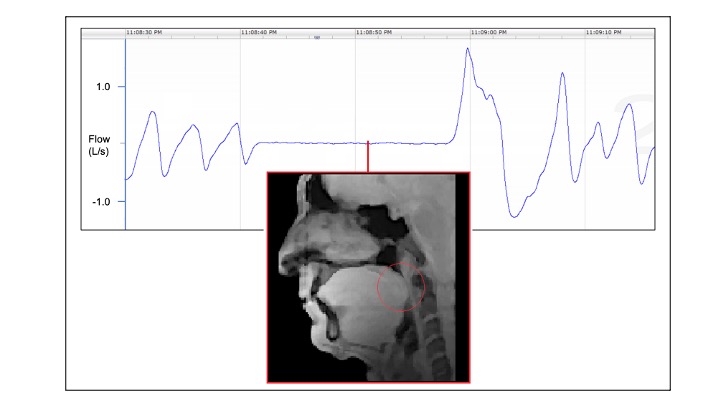
Figure 5: Forty-second section of airflow plethysmogram capturing a 20-second apnea period in the patient of Fig. 3 and 4, along with midline sagittal airway image indicating retropalatal obstruction (red circle). Data obtained with UA‑OxFlow at a frame rate of 6 seconds, each comprising two axial and one sagittal anatomic image obtained in 2.1. s.